Abstract
While e-learning lectures allow students to learn at their own pace, it is difficult to manage students’ concentration, which prevents them from receiving valuable information from lectures. Therefore, we propose a method for detecting student distraction during e-learning lectures using machine learning, based on human face and posture information that can be collected using only an ordinary web camera. In this study, we first collected video data of the faces of subjects taking e-learning lectures and used the OpenFace and GAST-Net libraries to obtain face and posture information. Next, from the face and posture data, we extracted features such as the area of the eyes and mouth, the angle of the gaze direction, and the angle of the neck and shoulders. Finally, we used various machine learning models, such as random forest and XGBoost, to detect states of distraction during e-learning lectures. The results show that our binary classification models trained only on the individual’s data achieved more than 90% recall.
Keywords: e-Learning, Distraction detection, Machine learning, Facial features, Postural information
Introduction
In the last decade, the e-learning market has been rapidly growing due to the spread of the Internet and the development of information technology [7]. Furthermore, the spread of COVID-19 has made face-to-face lectures more difficult, so sales of e-learning increased from 2019 to 2020 more than in other years, and they are expected to exceed 300,000 million Japanese yen by 2021. Therefore, it can be recognised that e-learning has penetrated society as a new way of conducting lectures, and it can be assumed that the market will continue to expand in the future.
E-learning allows both teachers and students to teach and take courses in their own homes and other locations, and students can choose their own time to attend lectures and proceed with learning at their own pace. However, they may continue learning even when their concentration and arousal levels are low, thus not being able to receive valuable information from the lecture. In addition, it is difficult for teachers to perceive the concentration levels of their students. Therefore, we think that it is important to develop new educational applications that detect the distracted state of students during e-learning lectures.
It has been shown that the distracted state is related to facial, posture, and biometric information, such as heart rate and electrodermal activity (EDA) [5, 6]. The general method to acquire the data is to use a specific device such as a depth camera or biometric sensor, but most of these devices are expensive, and their practicality is low. Another problem is that it is necessary to analyse a large amount of data in real time to detect distractions. Therefore, we propose a method to detect students’ distraction during e-learning lectures using machine learning based on human facial and postural information, which can be collected from an ordinary web camera alone. Our method may be helpful in the following use-case scenarios of educational applications: First, teachers will be able to understand at what point in the e-learning content the student became distracted. Second, the class environment can be designed to help students maintain their concentration, for example, by suggesting breaks.
Related work
In this section, we summarise relevant studies that show the relationship between a human face and posture information and the level of concentration.
De Castro et al. [5] detected distraction during driving based on facial information. They acquired facial feature points, action units (AUs), and gaze information as facial information, and obtained an F1-value of 95% when using the k-nearest neighbour algorithm (KNN). From their results, the relationship between facial information and distracted state was clarified, and the effectiveness of analysis using machine learning was also recognised.
Uema et al. [11] created an application for estimating the level of concentration using smart glasses (JINS MEME) that can measure the blink and head movements of a person. They developed an original algorithm to estimate the concentration based on the number and intensity of blinks. This suggests that blink information may also be relevant to concentration. In addition, they have been providing a service based on the algorithm mentioned above in Japan.
Aoyama et al. [1] investigated the relationship between physical activity (postural information) and the level of concentration of students taking a remote class using a smartphone’s accelerometer. The subjects attended the lecture with their smartphones hanging around their necks, and the accelerations were acquired. As a result of an evaluation using repeated measures ANOVA, it was found that the physical activity of the students while the teacher was speaking was related to their level of concentration.
Tsuruoka et al. [10] estimated the level of concentration of students based on data obtained from their seated posture using a cushion-type device. They used an electroencephalograph to measure the level of concentration during the learning task. As a result of analysing the seated posture information during the concentration state, it was recognised that the highest concentration level was achieved when the students were in a forward-leaning posture.
Yang et al. [12] used Electroencephalography (EEG) sensor to detect distractions during e-learning. They detected distractions in unknown subjects with a 74.75% recall.
Daniel et al. [4] used an eye tracker to classify concentration and distraction states. They obtained a 90.7% accuracy.
As described above, the relationship between facial information, postural information, and the level of concentration is clarified, but since the level of concentration is estimated using specific devices such as JINS MEME, cushion devices and EEG sensor, it may be difficult to develop a practical system easily. In this study, we propose a machine-learning method for detecting distractions that can be easily introduced without depending on special devices because it detects distractions using data obtained from a web camera alone. Our study attempted two tasks: binary classification (distraction and other states) and multi-class classification (distraction, concentration, and normal states).
Proposed method
The outline of our distraction detection method primarily follows an ordinary machine learning approach, as follows: 1) Data acquisition and extraction; 2) Preprocessing; 3) Feature extraction; 4) Feature selection; 5) Labelling; 6) Machine learning; 7) Performance evaluation. In this section, we describe the details of each item.
Data acquisition and extraction
In our study, we first recorded the video of a student attending an e-learning lecture from the shoulders up using a web camera installed on a PC. We employed OpenFace [2] to obtain face information and a graph attention spatio-temporal convolutional network (GAST-Net) [8] to obtain posture information from video data. OpenFace is a library developed by Baltrušaitis et al. for extracting facial information from video data, and it can acquire 68 facial feature points, eye movements, head movements, and AUs. An AU is an encoding of human facial expressions using a combination of various facial muscle movements. The GAST-Net is a library developed by Liu et al. for estimating and extracting human 3D skeletal coordinates. It is an algorithm that first estimates 2D skeletal coordinates from video data using HRNet and then estimates 3D skeletal coordinates from the coordinates estimated by deep learning. In addition, students taking the e-learning course were asked to wear a wristband-type sensor (Empatica E4) to acquire EDA data showing the electrical activity of the skin surface corresponding to the activity of sweat glands. The EDA data were analysed using an EDA analysis tool to detect skin conductance response (SCR), which is an indicator of rapid peaks in the EDA data. Since SCR has been shown to be associated with distractibility in previous studies [3, 9], it was used as a label in our study. The labelling method using SCR can detect the distracted state that students do not recognise during e-learning lectures, and it is possible to identify at what point in the e-learning lecture the students became distracted.
Preprocessing
If there are missing values or outliers in the acquired data, a machine learning model may not be able to train properly, and if the quality of the data is low, the performance of the model may deteriorate. In our study, data were acquired every frame (30 fps), so the time interval between data is narrow, and it is unlikely that the face and postural information will change significantly in that interval. Therefore, we interpolated the data by inserting previous values for missing values. To detect outliers, we applied the isolation forest in scikit-learn library. It was developed based on the decision tree classification method, which repeatedly splits the decision tree until each data point is isolated and detects the data points which finished splitting at a shallow depth as outliers. The detected outliers were deleted and interpolated using the missing value method, as described above.
Feature extraction
Table 1 shows the feature values extracted in our study. The 68 facial feature points (in order -) shown in Fig. 1 were obtained using OpenFace, and the distances between (centre point) and each point were calculated. The distance from the eyebrow to the eye and from the eyebrow to the mouth were calculated separately for the left and right sides. The distances from the left eyebrow to the left eye and mouth were calculated from to and from to , respectively, and the distances from the right eyebrow to the right eye and mouth were calculated from to and from to , respectively.
Table 1.
Extracted features
| Data | Feature |
|---|---|
| Facial feature point | Distance from nose to each point, eyebrows to eyes and Eyebrows to mouth |
| Head movement | Position of the head (x,y axes), Angle of rotation of the head (yaw, pitch, roll) |
| Eye | Area, Number of blinks, Vertical and horizontal distance, Coordinates of gaze direction, Angle of gaze |
| Mouth | Area, Number of absences, Vertical and horizontal distances |
| AU | Strength(none - very strong) |
| 3D skeletal coordinates | Distance between each feature point pair, Area of the three feature points, Angle between the centre point and the other points |
Fig. 1.
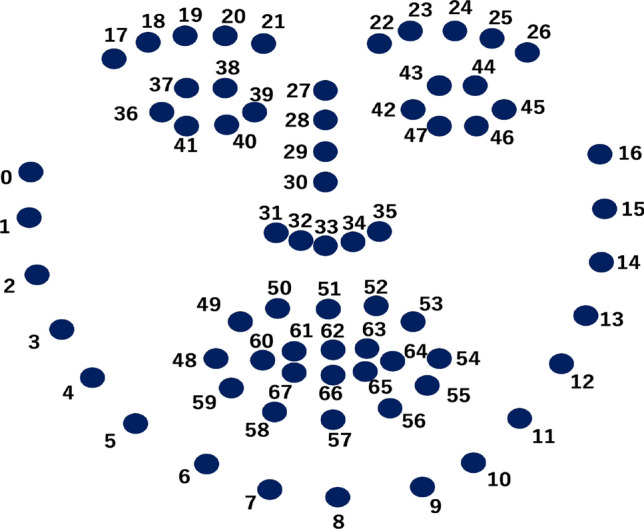
Facial feature points acquired by OpenFace
From the eye and mouth information, the area of the feature points surrounding each part and the length between feature points connecting the height and width of each part were calculated to represent the opening of each part. In particular, let and are the x and y coordinates of each . Then, the area S of the feature points is defined by:
| 1 |
where if , then .
Yawn was detected when the vertical length of the mouth increased rapidly for 3 s. From the eye information, the direction and angle of gaze were also extracted as feature values, and since these extraction methods were implemented in OpenFace, the data were used. Since the head position, rotation angle, and AU strength are also already implemented in OpenFace, we used these as features.
The coordinates shown in Fig. 2 were obtained from the 3D skeletal coordinates. The distance between each part of the body, the area of the three feature points (neck, thorax, and shoulders) and the angle between the centre point (thorax) and the other points in the area of the red frame in Fig. 2 obtained from the recorded video were extracted as feature values. We aggregated the extracted features using a tumbling window with a window size of 10 s, and added the average, maximum, and minimum values and first quartile, third quartile, variance, and standard deviation of each feature to our dataset.
Fig. 2.
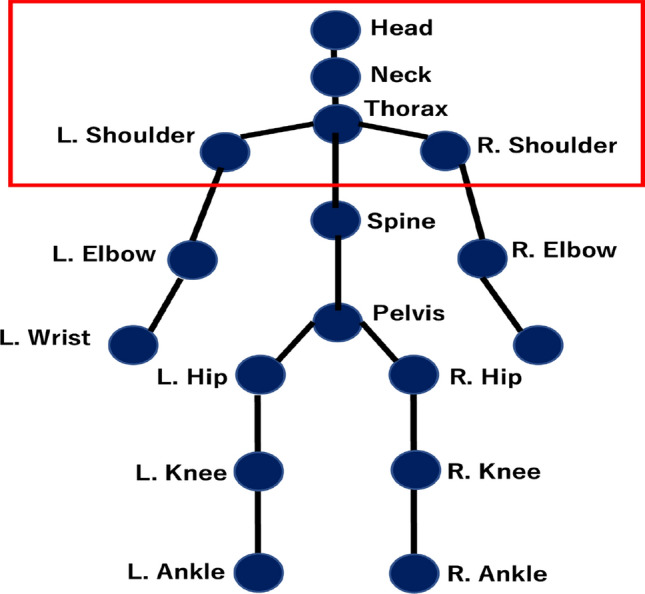
3D skeletal information obtained by GAST-Net
Feature selection
In machine learning, if the number of features is too large, the machine learning model becomes too complex, and the possibility of overfitting increases. Therefore, it is necessary to select only those features that significantly contribute to the performance of the model. To find features that contribute to prediction, we selected features with the importance calculation method using random forest, XGBoost, and permutation importance and selected the method with the highest performance. Permutation importance is a method that shuffles the extracted features one by one and determines the importance of the features based on the degree of decrease in prediction accuracy when the feature is no longer functional. In our study, we selected the top 60 features that were determined to be important for each machine learning model described in Sect. 3.6.
Labelling
Many previous studies on the detection of distracted states have used methods that rely on the subjectivity of the subjects, such as questionnaires or subjects’ self-reports, for labelling methods. However, a labelling method based only on the subject’s subjective evaluation has the problem that it is not possible to detect the distracted state without the subject themself being aware of it. In addition, since labelling methods based on questionnaires and subjects’ self-reports evaluate the level of concentration for the entire e-learning lecture, it is not possible to grasp at which point in the e-learning lecture the students became distracted.
We used SCR, which is biometric information that has been shown to be related to the level of arousal and fatigue. SCR is known to occur rarely in the state of concentration (Fig. 3) and frequently in the state of distraction (Fig. 4). In addition, it has been shown that SCR occurs approximately one to three times per minute under normal conditions. Therefore, in our study, in the binary classification, the state in which SCR occurs more than four times per minute was defined as the distracted state, and the state in which SCR occurs only three times per minute or less was defined as other state. In the multi-class classification, the state in which SCR occurred four or more times per minute, one to three times per minute and zero times per minute were labeled as distraction, normal, and concentration, respectively.
Fig. 3.
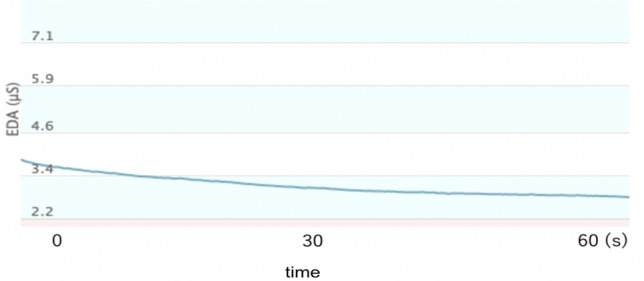
Example of concentration state
Fig. 4.
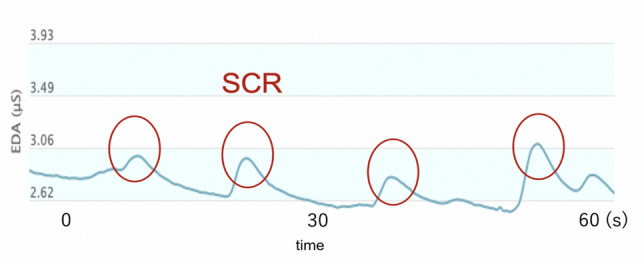
Example of distracted state
Machine learning
The machine learning models used in our study are as follows: Random forest; XGBoost; Decision tree; Support vector machine (SVM) and KNN. The best machine learning model for detecting distractions was selected by comparing their evaluation performance.
For the feature selection method, random forest and XGBoost selected their own importance calculation methods, while the decision tree, SVM, and KNN used permutation importance.
Performance evaluation
As performance measures of the machine learning models, we used accuracy (ACC), precision (PRE), recall (REC), and F1-value (F1), where we use the macro-average of the evaluation indices for multi-class classification. These evaluation indices can be calculated using the following equations, where the variables are based on the confusion matrix in Table 2.
| 2 |
| 3 |
| 4 |
| 5 |
Table 2.
Confusion matrix
| Predicted classes | ||||||
|---|---|---|---|---|---|---|
| Positive | Negative | |||||
| Actual classes | Positive | True positive (TP) | False negative (FN) | |||
| Negative | False positive (FP) | True negative (TN) | ||||
Experiments and results
In our experiment, we created a dataset by recording a video of a subject attending an e-learning lecture and implementing the proposed method. After training the machine learning models using the dataset, we evaluated the performance of the machine learning models based on the above evaluation metrics.
Details of our experiment
The subjects were nine males aged between 22 and 25 years, and each of them took an e-learning course on machine learning provided by a Japanese company (https://www.kikagaku.ai/) and an online class provided by the Department of Industrial Administration, Tokyo University of Science, for approximately 60 to 120 mins. The equipment used in this experiment is shown in Table 3. The experiment scene is also shown in Fig. 5. We applied the proposed method for a video taken by a webcam of a subject taking a course while the subject was wearing Empatica E4.
Table 3.
Details of experimental equipment
| Device type | Device name | Acquisition data |
|---|---|---|
| Web camera | 720p FaceTime HD camera (30fps) | Video data |
| Wrist device type sensor | Empatica E4 | EDA |
Fig. 5.
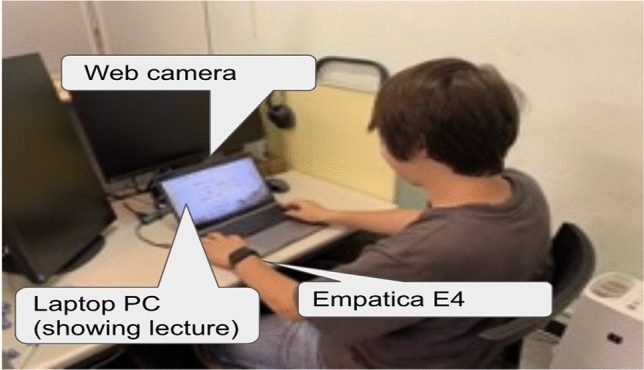
Example of our experiment scene
The number of samples obtained in this study and the flow of creating dataset are shown in Table 4 and Fig. 6, respectively. Each data set has 60 features, with 3736 samples for the individual data and 7442 for the whole subject data. Our dataset consists of samples of the aggregated data and corresponding labels based on their time stamps. Each sample is 10 seconds apart and has its own time stamp since the data were aggregated using a tumbling window from the list of frames of video data (30 fps), as mentioned in Section 3.3. For example, from one minute video data (i.e., frames), we obtain six samples (i.e., 300 frames data are aggregated into one partition, see also left-side of Fig. 6). Corresponding labels are provided one-minute intervals based on the SCRs in EDA data (cf. Sect. 3.5) where the starting time of the timestamps of EDA data were adjusted to that of video data. For example, from the number of SCRs per minute on EDA data, we obtain one label (see also right-side of Fig. 6), and associate the label with a corresponding sample of aggregated data.
Table 4.
Number of the sample
| Binary class | Multi-class | ||||
|---|---|---|---|---|---|
| Distraction | Other | Distraction | Concentration | Normal | |
| Individual data | 1893 | 1843 | 1893 | 248 | 1595 |
| Entire data | 4172 | 3270 | 4172 | 491 | 2779 |
Fig. 6.
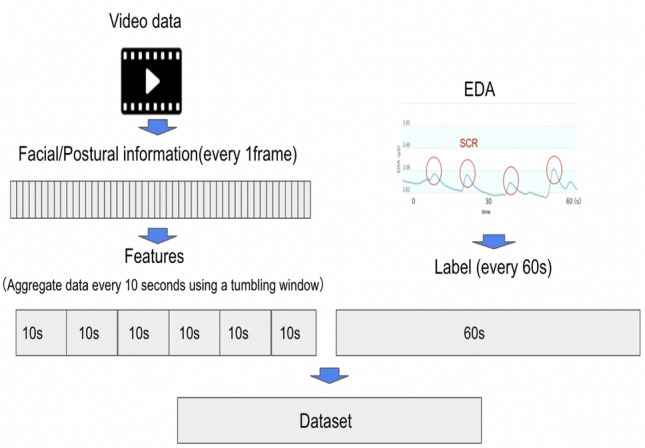
The flow of creating a dataset
We evaluated the performance of our machine learning models trained only on the individual data and whole subject data. For the evaluation of the individual data, we used the data of the subject who had the most data. However, to reduce bias due to the amount of data from each subject, we sampled the data of the subjects used in the training and adjusted it so that it was equal to the amount of data from the other subjects. The number of samples labeled distracted was greater than the number of samples labeled concentrated or normal, resulting in an unbalanced data set. Note that we regard the distracted state of subjects as a positive case to evaluate the model performance.
When machine learning is performed on an unbalanced dataset, the predicted classes are likely to be those with a large number of samples, and the performance of the model for those with a small number of samples may be reduced. Therefore, we applied the undersampling method and adjusted the number of samples in the data set to be balanced.
For the evaluation of the whole subject data, we split our dataset into an unknown subject (i.e., test data) and the remainders, then evaluate the generalization performance of our model (i.e., measuring how ours can classify an unknown subject data well based on the remainders’). In what follows, we refer the approach based on the whole subject data as ‘unknown subject data.’
Results
We evaluated the model performance on the individual data and unknown subject data. First of all, Figs. 7 and 8 shows the binary classification and the multi-class classification results for the individual data, respectively. For the evaluation of these data, we used a 10-fold cross-validation. As shown in Fig. 7, for binary classification, XGBoost and random forest can detect distractors with a recall of over 90%. However, for multi-class classification, all evaluated metrics decreased by 10–25%. This was probably due to the increase in the number of classification labels and the fact that the number of samples for all classes was greatly reduced by the under-sampling method owing to the small number of samples for concentration states. Therefore, it is necessary to conduct additional experiments to induce concentration states and to ensure a sufficient number of samples.
Fig. 7.
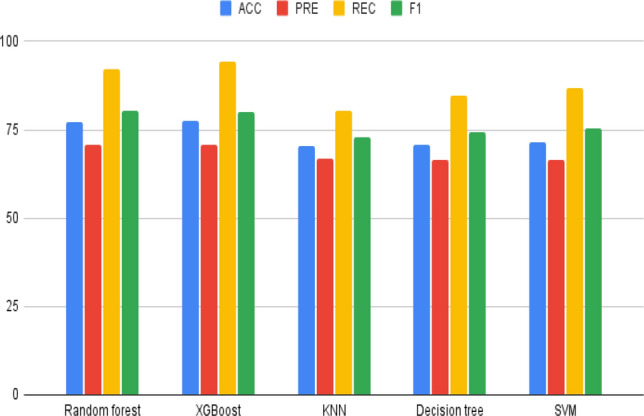
Binary classification performance for the individual data (%)
Fig. 8.
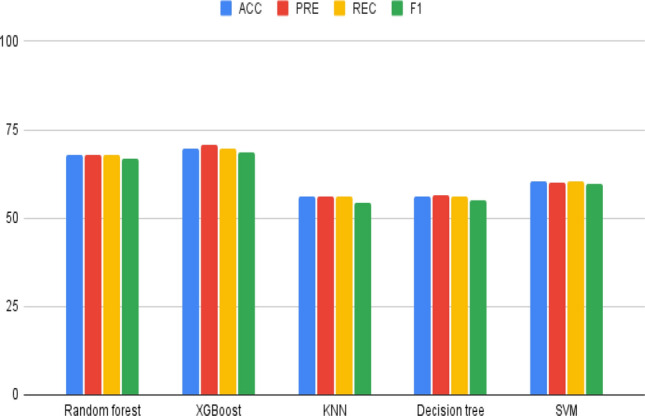
Multi-class classification performance for the individual data (%)
Figures 9 and 10 show the binary classification and the multi-class classification results, respectively, where training was performed on data excluding all data of one subject, and the unknown subject data that were not used for training were evaluated as test data. From the results in Fig. 9, we can see that the random forest performed the best for binary classification. For multi-class classification, we confirmed that the KNN showed the best performance. However, compared to Fig. 7, the performance of binary classification decreased by about 10–30% when using a random forest. In addition, when KNN is used for multi-class classification, each evaluation value is reduced by 10% compared with Fig. 8. Therefore, it can be recognised that most of the features extracted in this study are dependent on the individual.
Fig. 9.
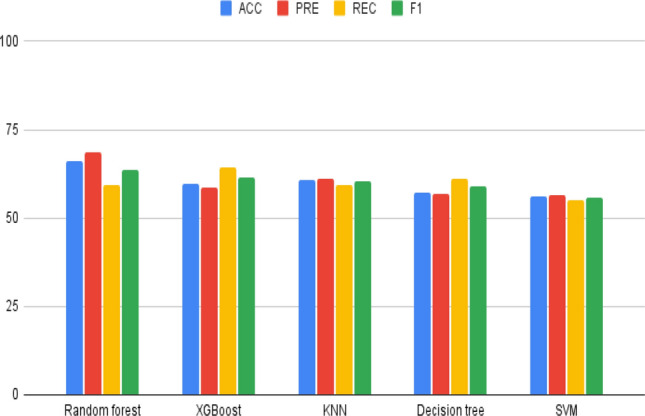
Binary classification performance for unknown subject data(%)
Fig. 10.
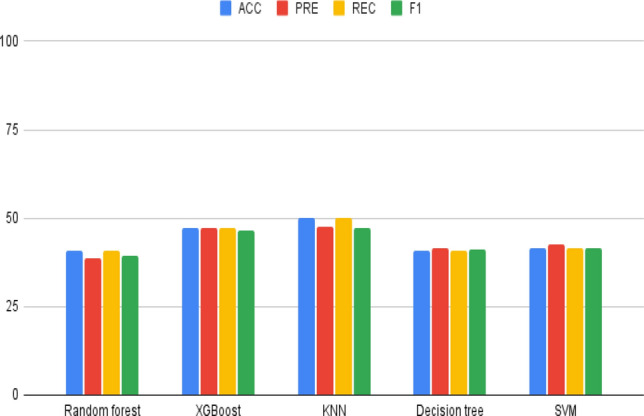
Multi-classification performance for unknown subject data (%)
Discussion
Figure 11 shows the top 20 features in terms of importance when binary classification was performed on the individual’s data using XGBoost. It can be recognised that the feature that contributed the most to the classification is AU45, which represents the intensity of blinking. In our study, the number of blinks was also detected as a feature, but it was confirmed that the feature that contributed to the classification was the intensity rather than the number of blinks. Since previous studies have shown that the intensity of blinking is related to the degree of fatigue, it can be assumed that the subjects became distracted when they were feeling tired. Other features related to eye movements were also ranked high. In particular, eye gaze information was ranked higher than features such as those representing eye opening. Therefore, it is suggested that eye movement information may be useful in distinguishing the points of interest and the points of disinterest in the e-learning lecture by understanding what the subject was looking at. In our study, we confirmed that the importance of posture-related features was also high. In particular, from the calculated ranking, it can be inferred that shoulder movement is important. Since shoulder movement can be expected to change depending on the movement of the cheekbones, folded arms, and so on, we assume that the performance of the machine learning model will be further improved if we use behaviour during the e-learning lecture as a feature.
Fig. 11.
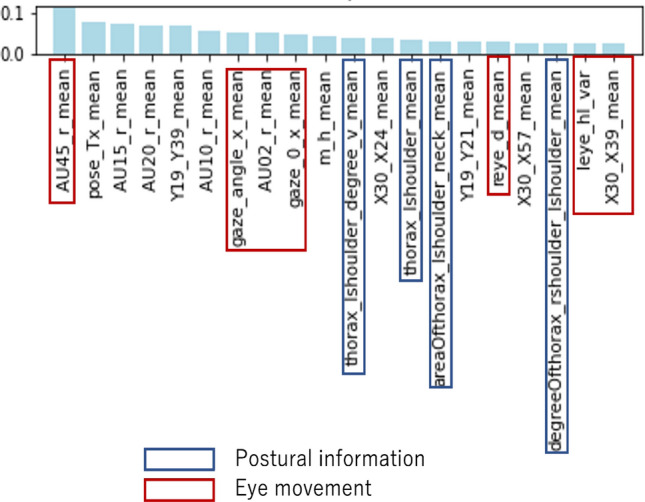
Important features of XGBoost for the individual data
Figure 12 shows the learning curve of the random forest model trained on the unknown subject data. We say that the accuracy of prediction on training data as training accuracy, and that on validation data as validation accuracy. We can observe that there is a gap between the training and validation accuracies, indicating that the machine learning model created in our study tends to overfit. However, because the validation accuracy does not converge, performance improvement can be expected by increasing the amount of data.
Fig. 12.
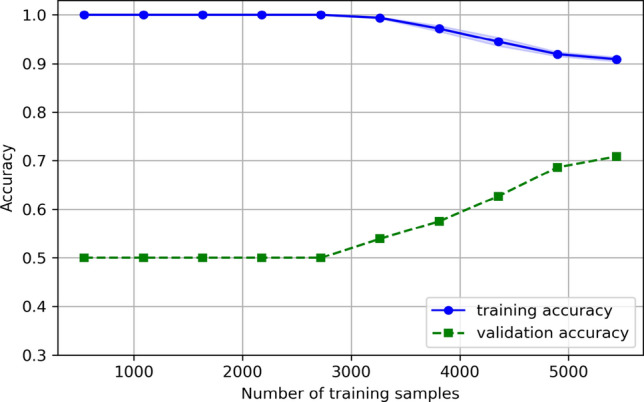
Learning curve of random forest for the unknown subject data
Figure 13 shows the learning curve for multi-class classification using KNN. In the case of multi-class classification, the difference between the learning and verification accuracies becomes larger than in the case of binary classification, and it can be confirmed that the system is overfitted, as in the case of binary classification. In addition, because the verification accuracy tends to converge, it can be inferred that increasing the amount of data may not improve the performance. Therefore, to obtain high accuracy in the case of multi-class classification, it is necessary to use a powerful machine learning model suitable for time-series data other than that used in our study.
Fig. 13.
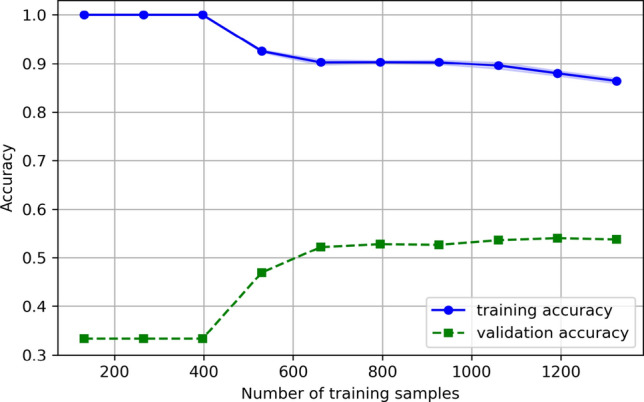
Learning curve of KNN for the unknown subject data
In our study, we were able to detect distractions during e-learning with up to 66.08% accuracy and 64.29% recall for data from unknown subjects. Let us compare our results with previous studies of Yang et al. and Daniel et al. mentioned in Section2. Yang et al. achieved a 74.75% recall to detect distractions of unknown subjects during E-learning based on EEG. Daniel et al. also achieved a 90.7% accuracy to classify concentration and distraction states by using an eye tracker.
These results indicate that the performance of our models in this study is lower than that of existing studies. This may be due to the fact that related studies used specific devices and obtained higher quality data. However, as mentioned above, the current sample size of the training dataset is found to be inadequate. Therefore, by increasing the number of samples in the training dataset, the performance of the machine learning model can be expected to be improved. In addition, our results indicates that some detected actions such as cheekbones and yawning are associated with the distracted state, which meets our intuition. Therefore, we expect that combining the idea of the existing studies and ours might yield better results and can be a possible candidate for further direction.
Conclusion
We proposed a machine learning method for detecting distracted states of students during e-learning lectures using extracted human face and postural information from web cameras alone. We evaluated the performance of our machine learning models using only the data of individuals and using that of unknown subjects. In the case of binary classification using only individual data, XGBoost and random forest achieved over 90% recall. However, in the case of multi-class classification, all the evaluation performance decreased by 10–25% due to the application of under-sampling. As For the test data of unknowns, the best performance was obtained by random forest for binary classification and KNN for multi-class classification. However, the performance decreased compared with the case of using only individual data, which implies that it is necessary to extract robust features for many subjects. Therefore, our models are the most suitable for the binary classification task of distraction states.
In our study, we confirmed that eye movements and posture information are features that contribute to the detection of distraction. In particular, we found that shoulder movement is important for posture information. In future research, we plan to improve the performance of the machine learning model by extracting the behaviour of students during e-learning lectures (e.g. cheekbones and folded arms) as features from the acquired postural information. Because the machine learning model for detecting the distraction of unknown subjects created in our study was overfitted, it is necessary to continue experiments and increase the amount of data. In addition, we plan to introduce deep learning models that are suitable for time-series data, such as long short-term memory, which were not used in this study, and compare their performance with the machine learning model proposed in our study.
Footnotes
This work was presented in part at the joint symposium of the 27th International Symposium on Artificial Life and Robotics, the 7th International Symposium on BioComplexity, and the 5th International Symposium on Swarm Behavior and Bio-Inspired Robotics (Online, January 25–27, 2022).
References
- 1.Aoyama H, Miyake Y, Nozawa T. The relationship between learner engagement and teacher-learner synchronization in distance education (in Japanese) Res Rep JET Conf. 2021;2:64–71. [Google Scholar]
- 2.Baltrušaitis T, Zadeh A, Lim YC, Morency LP (2018) OpenFace 2.0: Facial behavior analysis toolkit. In: The 13th IEEE international conference on automatic face & gesture recognition (FG 2018) pp. 59–66
- 3.Braithwaite JJ, Watson DG, Jones R, Rowe M. A guide for analysing electrodermal activity (EDA) & skin conductance responses (SCRs) for psychological experiments. Psychophysiology. 2013;49(1):1017–1034. [Google Scholar]
- 4.Daniel KN, Kamioka E. Detection of learner’s concentration in distance learning system with multiple biological information. J Comput Commun. 2017;5(04):1. doi: 10.4236/jcc.2017.54001. [DOI] [Google Scholar]
- 5.De Castro MJC, Medina JRE, Lopez JPG, de Goma JC, Devaraj M (2018) A non-intrusive method for detecting visual distraction indicators of transport network vehicle service drivers using computer vision. The 10th International Conference on Humanoid, Nanotechnology, Information Technology, Communication and Control, Environment and Management, pp 1–5
- 6.Gjoreski M, Gams MŽ, Luštrek M, Genc P, Garbas JU, Hassan T. Machine learning and end-to-end deep learning for monitoring driver distractions from physiological and visual signals. IEEE Access. 2020;8:70590–70603. doi: 10.1109/ACCESS.2020.2986810. [DOI] [Google Scholar]
- 7.Yano Research Institute Ltd. Conducting research on the e-learning market (2021) (in Japanese): https://www.yano.co.jp/press-release/show/press_id/2702. Access date 08/03/2021
- 8.Liu J, Rojas J, Liang Z, Li Y, Guan Y (2020) A graph attention spatio-temporal convolutional networks for 3D human pose estimation in video. arXiv:2003.14179
- 9.Shimizu M, Munekata N, Matsubara H (2012) Analysis of attention span and performance by skin conductivity response (in Japanese). The 74th National Convention of Information Processing Society of Japan 1:145–146
- 10.Tsuruoka H, Ryutaro G, Yokota Y, Naruse Y, Yairi I (2017) Evaluation of sitting posture and learning status using cushion shaped device (in Japanese). The 31st Annual Conference of the Japanese Society for Artificial Intelligence, p 3N23
- 11.Uema Y, Inoue K (2017) JINS MEME algorithm for estimation and tracking of concentration of users. In: Proceedings of the 2017 ACM International Joint Conference on Pervasive and Ubiquitous Computing, pp 297–300
- 12.Yang SM, Chen CM, Yu CM (2015) Assessing the attention levels of students by using a novel attention aware system based on brainwave signals, pp 379–384


