

Editorial Summary:
Rearrangements in MAP3K8 respond to MEK inhibition and represent the most common genetic driver in pediatric spitzoid melanoma and some adult melanomas lacking other MAPK alterations and for which clinical testing is warranted
INTRODUCTION
Spitzoid melanoma is a specific morphologic variant of melanoma that most commonly affects children and adolescents and ranges on the spectrum of malignancy from low-grade to overtly malignant. These tumors are generally driven by fusions of ALK, RET, NTRK1/3, MET, ROS1 and BRAF 1,2. However, in approximately 50% of cases, no genetic driver has been established 2. Clinical whole genome and transcriptome sequencing (RNA-Seq) of a spitzoid tumor from an adolescent revealed a novel gene fusion of MAP3K8, encoding a serine–threonine kinase that activates MEK 3,4. The patient who had exhausted all other therapeutic options was treated with a MEK inhibitor and underwent a transient clinical response. We subsequently analyzed spitzoid tumors from 49 patients by RNA-Seq and found in-frame fusions or C-terminal truncations in 33% of cases. The fusion transcripts and truncated genes all contained MAP3K8 exons 1–8 but lacked the autoinhibitory final exon. Data mining of RNA-Seq from the Cancer Genome Atlas (TCGA) uncovered analogous MAP3K8 rearrangements in 1.5% of adult melanomas. Thus, MAP3K8 rearrangements - uncovered by comprehensive clinical sequencing of a single case - are the most common genetic event in spitzoid melanoma, are present in adult melanomas, and could be amenable to MEK inhibition.
MAIN
An 11-year-old male presented with a dusky red soft papule on the anterior right ankle consistent with spitzoid melanoma (Fig. 1a). Seven months after initial resection, he developed a local recurrence. A repeat wide local excision was performed, but several new papules consistent with in transit metastases were developed (Fig. 1b). Over the subsequent twelve months, the patient was treated with ipilimumab and pembrolizumab, hyperthermic limb perfusion and talimogene laherparaepvec but the disease continued to progress (Supplementary Data, Extended Data 1). Following treatment failures, the patient was enrolled on an institutional clinical genomics study, Genomes for Kids (G4K; NCT02530658), and a frozen tissue sample from an in-transit metastasis underwent 30X whole genome (WGS), 100X exome and transcriptome sequencing (50 million reads).
Figure 1. Diagnosis and treatment history.
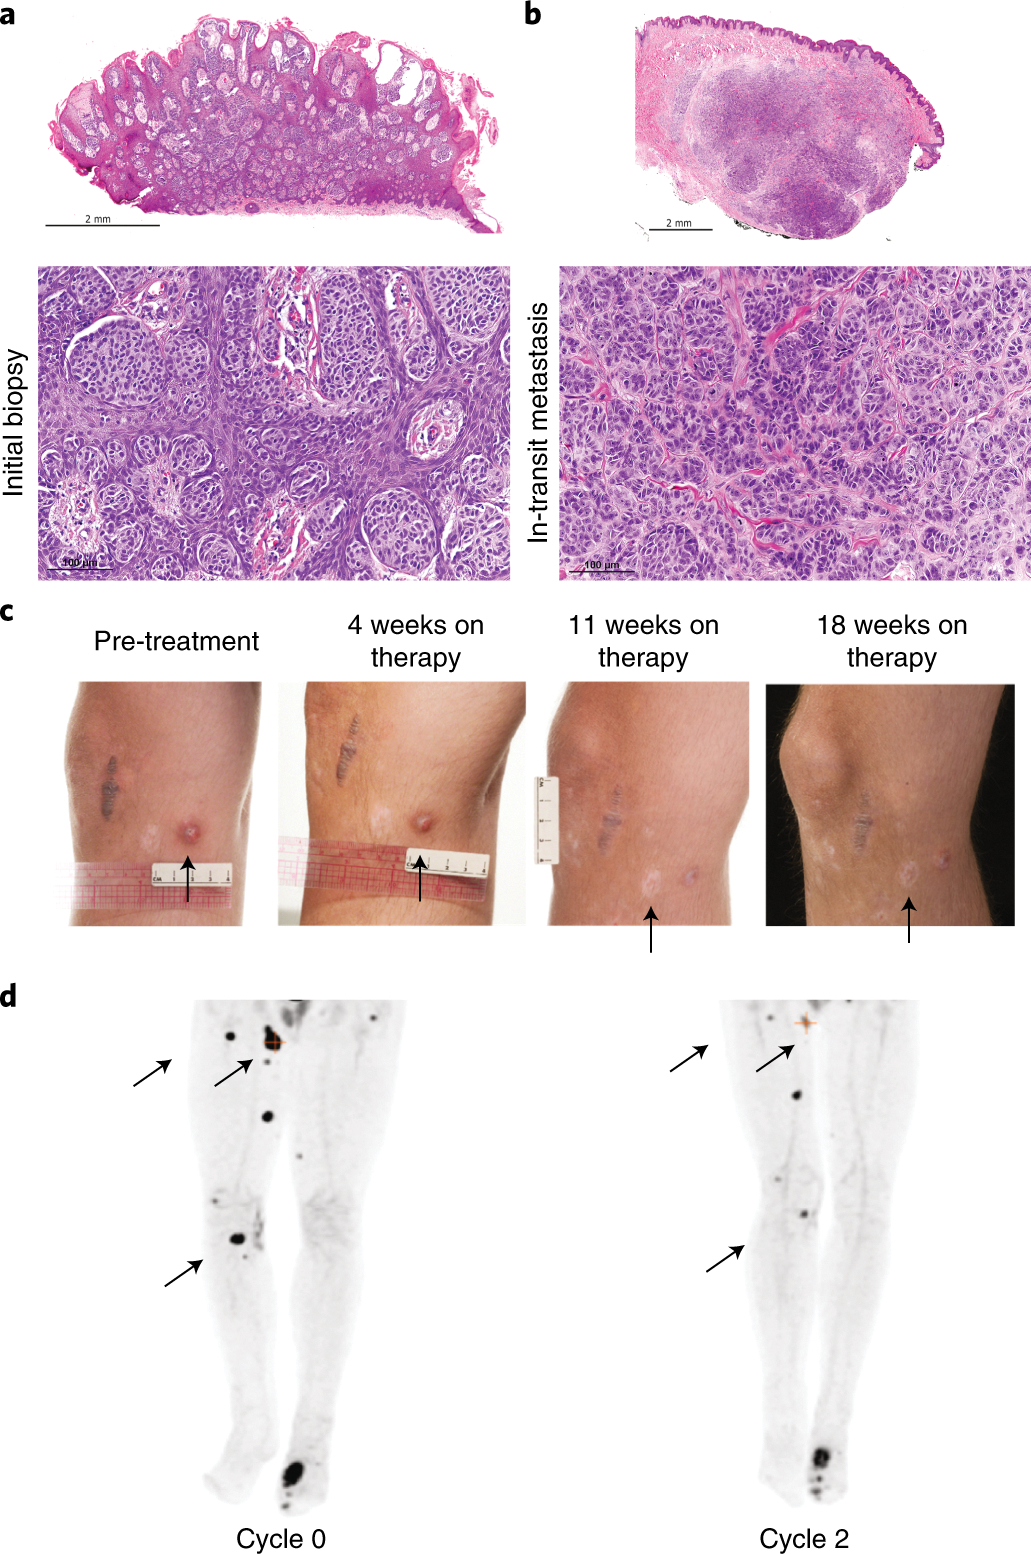
A) H and E stained sections of the initial biopsy of the primary tumor and B) resection of an in-transit metastatic nodule showing morphologic features consistent with spitzoid melanoma at the primary site and progression into an overtly malignant phenotype at the metastatic site. C) Lesions on the right lower extremity throughout trametinib therapy. D) Left PET scan at time of enrollment on a clinical trial for ERK inhibitor, LTT462, showing hypermetabolic lesions in the lower extremities as well as avid osseous metastases. Right PET scan after 2 cycles showing overall decrease in the avidity of the subcutaneous nodules. Regions of interest are indicated by black arrows.
Genomic analysis showed a mutational burden and spectrum in keeping with other adolescent melanoma cases with approximately 10 mutations/Mb and 75% being C>T transitions. Mutational signature analysis genome-wide showed that 65% of mutations could be attributed to UV-light induced DNA damage 1,5. Significant mutations included a homozygous deletion of CDKN2A/B and a complex rearrangement that dysregulated TERT which we confirmed by FISH (Fig 2a, Extended Data 2a–g). We did not find any coding mutations, structural, or copy number abnormalities at BRAF, NRAS, ALK, RET, ROS1, MET, or NTRK1/3 loci.
Figure 2. Clinical genomics sequencing.
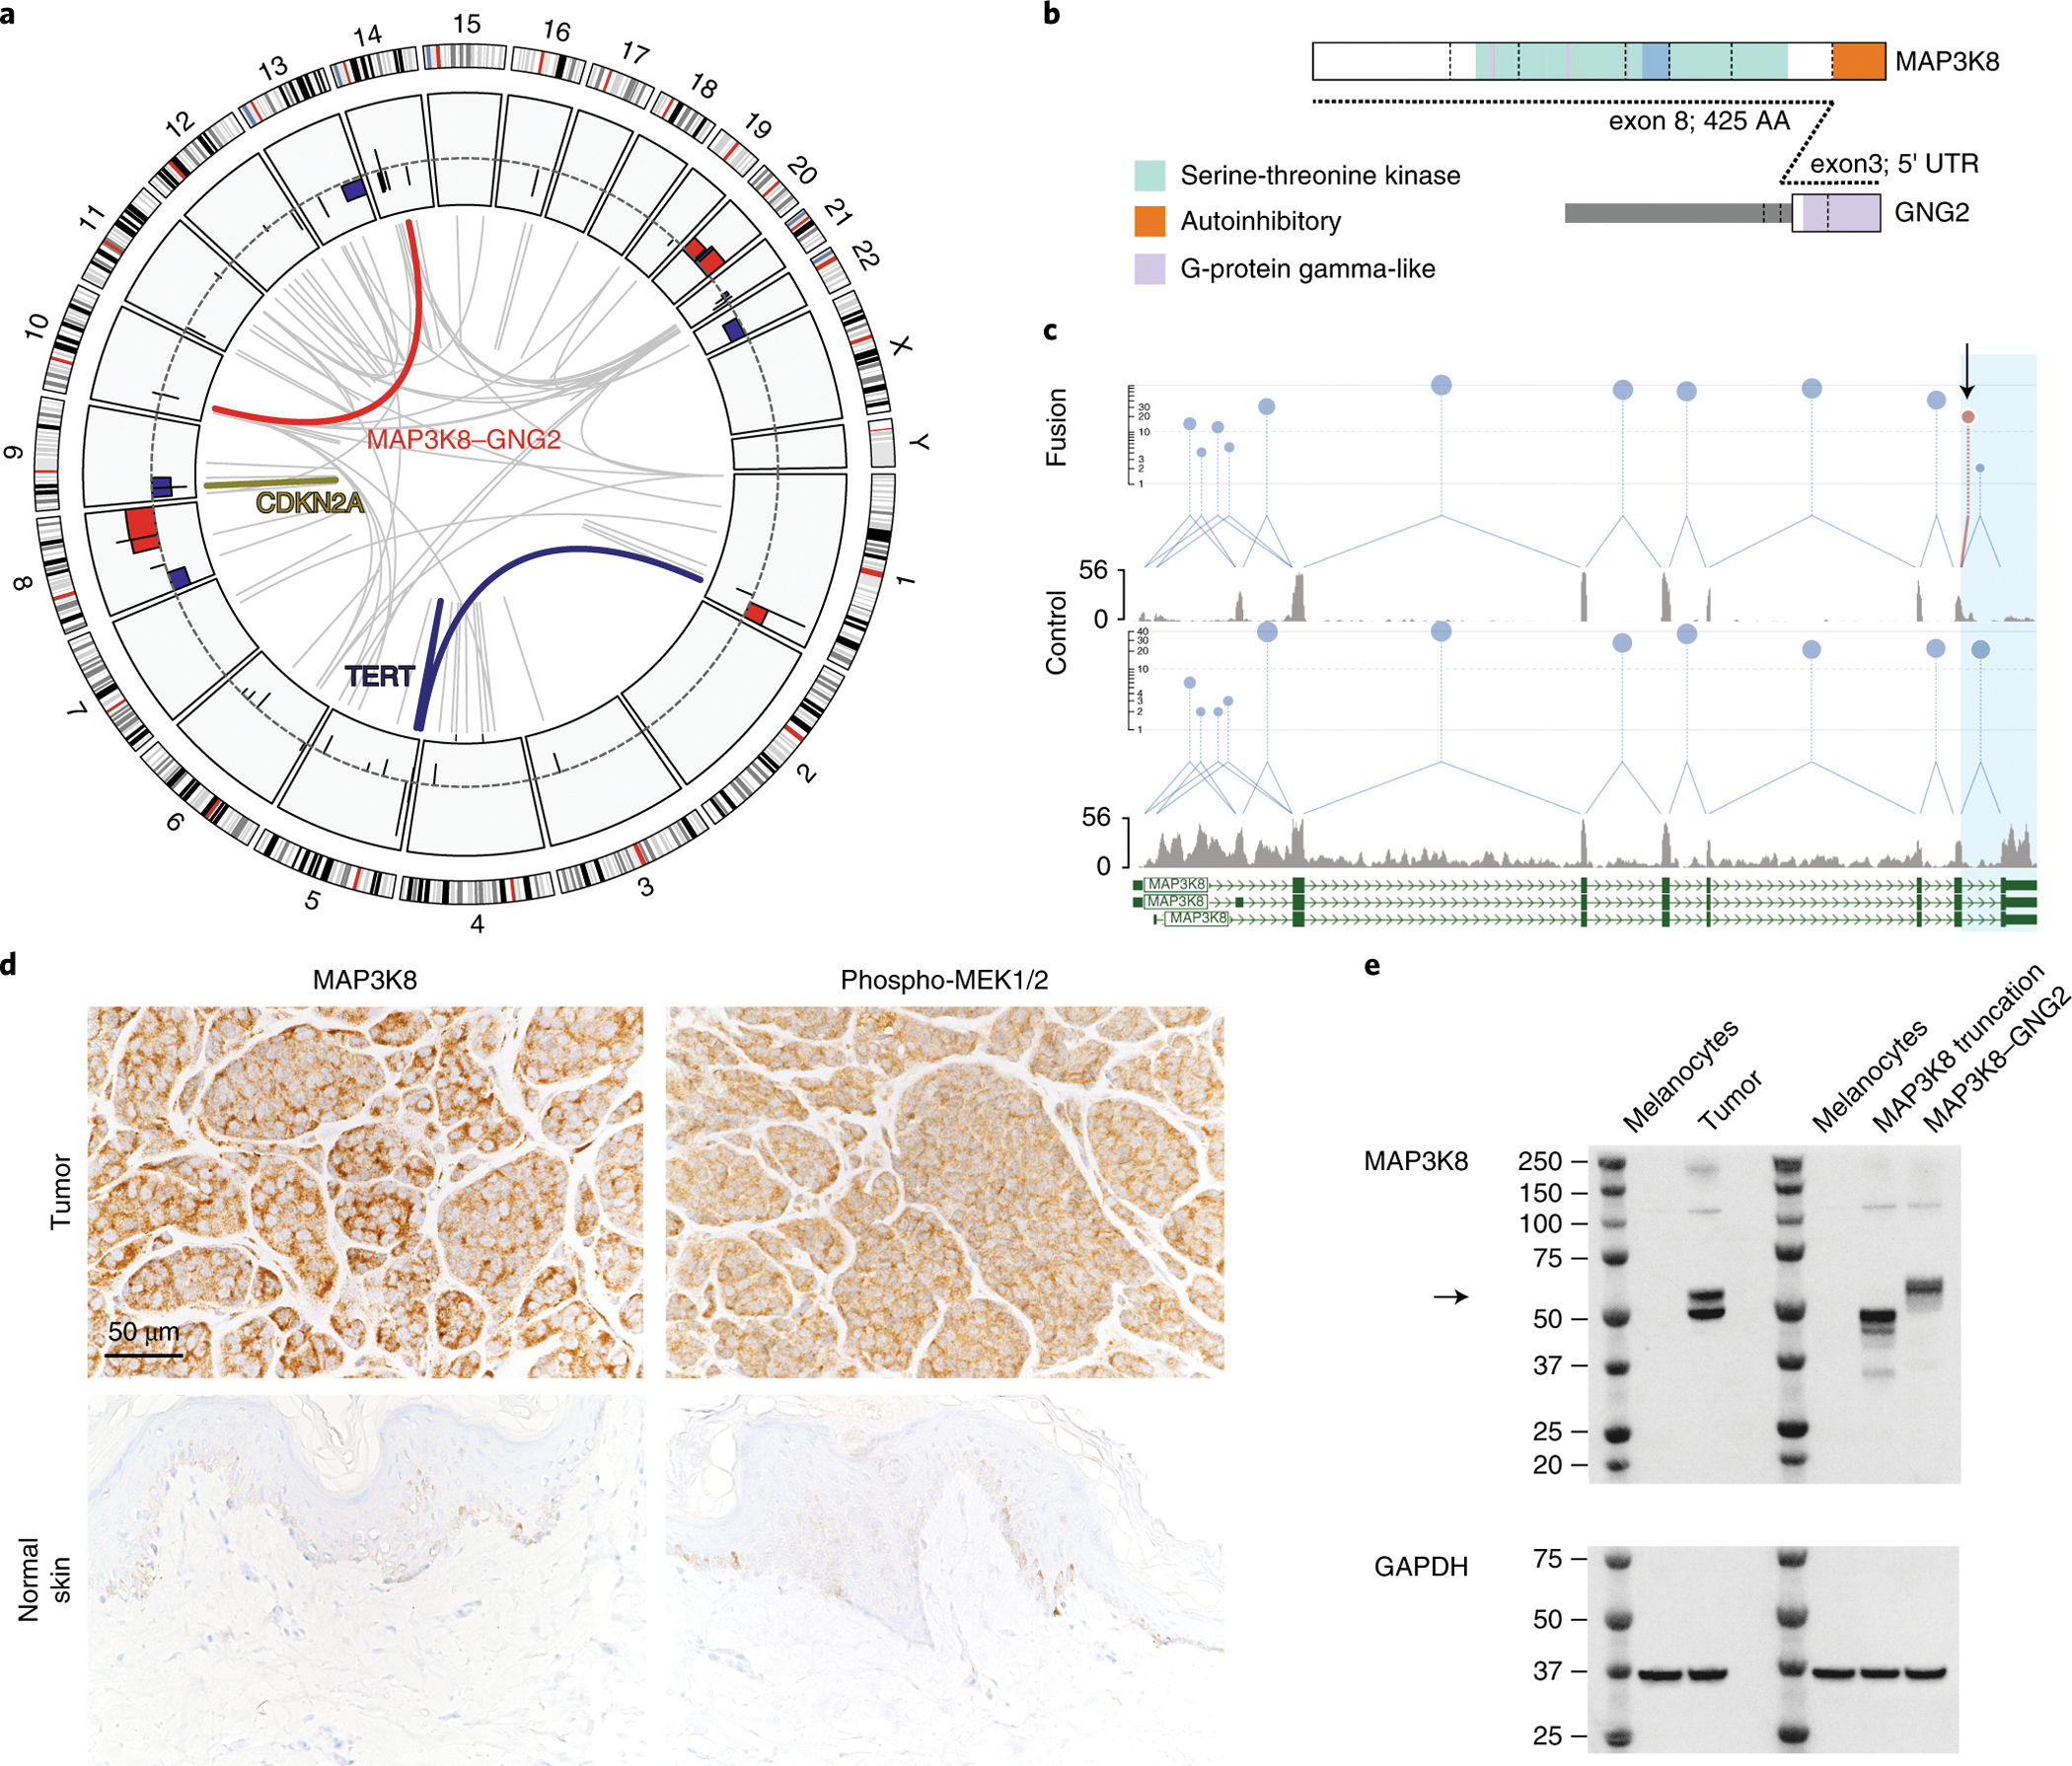
A) Somatic findings from the patient’s tumor. Chromosomes are plotted as ideograms around the outside of the circle plot. Moving inwards, copy number abnormalities are shown as histograms with gains in red and losses in blue relative to a normal diploid genome (dotted line) copy number alterations included gains at chromosome 1q, 8q and 20 and losses at 8p, 9p, 13q, 14q and 22; Structural variants are shown as inner grey links with notable variants highlighted: CDKN2A deletion in yellow, TERT deregulating translocation in dark blue and a complex translocation t(10;14) fusing MAP3K8 (RefSeq NM_005204) and GNG2 (NM_ 053064) in red. B) Schematic representation of the MAP3K8-GNG2 fusion protein from ProteinPaint 32. The MAP3K8 Serine Threonine kinase domain is shown in green, and the autoinhibitory region 8,23 (amino acids 425–467) is highlighted in orange; the GNG2 G protein gamma subunit-like motifs are in purple. The fusion point is represented by the dotted line. The fusion protein incorporates a short region of the GNG2 5’-UTR derived from the non-coding portion of GNG2 exon 2, however, the protein reading frame is preserved. C) Quantification of RNA-Seq splice junctions and sequence coverage at the MAP3K8 locus. The upper two panels show splice junctions and coverage from the MAP3K8 fused patient sample, the lower two panels show the wildtype MAP3K8 locus from an unrearranged sample (SJMEL055003_D1). The exon 8–9 region of interest is highlighted in blue and expression level is indicated on the y-axis. The fused patient sample has relatively lower MAP3K8 exon 9 expression (grey histogram) and relatively fewer exon 8–9 splices (blue links) than the unfused sample. The black arrow shows the position of the 19 MAP3K9-GNG2 spliced reads (red lollypop). D) Immunohistochemical staining for MAP3K8 and Phospho-MEK1/2 show higher expression levels in the tumor sample (upper panels) compared to a normal skin sample (lower panels); all images at 40X magnification. E) Western blot shows weak/absent MAP3K8 expression at 53 kDa in melanocytes, expression of both wildtype and fused MAP3K8 at 53 and 57 kDa in the tumor. Also shown is a truncation mutant transfected into melanocytes at 49 kDa and the MAP3K8-GNG2 fusion protein transfected into melanocytes. The black arrow indicates the position of the fusion protein at 57 kDa. The molecular weight ladder is shown in lanes 1 and 5.
We detected an in-frame fusion of MAP3K8 exon 8 with GNG2 exon 3 by WGS and RNA-Seq (Fig. 2b); RNA expression of the final exon (nine) of MAP3K8 was decreased relative to a non-rearranged melanoma case (Fig. 2c). Immunohistochemistry (IHC) confirmed that MAP3K8 protein was present and that MEK1/2 was phosphorylated (i.e., active) (Fig. 2d). Western blot on tumor lysate showed a 57.1 kDa MAP3K8-GNG2 protein (Fig. 2e). Given that MAP3K8 activates MEK 6, and no other alterations were detected within the MAPK pathway, we considered the fusion gene to be oncogenic and recommended treatment with a MEK inhibitor.
The patient started treatment with trametinib, a small-molecule inhibitor of MEK1/2, at 2mg PO daily. After 1 month of therapy, the lesions appeared smaller and less numerous on examination and PET (Fig. 1c), but a decrease in shortening fraction (SF) (>10% from baseline) on echocardiogram prompted discontinuation of the drug. Trametinib was restarted three weeks later at a reduced dose (1.5mg PO daily) when the SF improved. After one month, most lesions on examination appeared to be reduced in size; however, PET showed a mixed response (Fig. 1c). Due to cardiotoxicity and lack of continued efficacy, trametinib was withdrawn and treatment was switched to ipilimimab and nivolumab. After one course, the patient developed autoimmune hepatitis as well as progressive disease in the left metatarsal bone, prompting discontinuation of this regimen and administration of local radiotherapy to the left foot. He was then enrolled on a trial of LTT462, an ERK inhibitor; and despite mild regression of some of the lesions (Fig. 1d), the disease continued to progress. He then received therapy with enoblituzumab but developed further systemic metastases to the lungs and bone and ultimately died of progressive disease. Clinical genome sequencing of the final relapsed sample showed no additional mutations within the MAPK pathway, but the MAP3K8-GNG2 fusion had increased in genomic copy number and the expression of the fusion gene had increased approximately three-fold suggesting a role in resistance to targeted MEK/ERK inhibition7 (Extended Data 3).
To establish if MAP3K8 fusions are recurrent in pediatric spitzoid melanoma, we performed RNA-Seq on a cohort of 51 spitzoid tumor samples from 49 patients (Supplementary Tables 1 and 2). Consistent with other studies, we detected ALK fusions in 11/49 patients (22%), fusions of NTRK1/3, BRAF, RAF1, ROS1 and RET in 10/49 patients collectively (20%) 1,2, hotspot mutations in NRAS, CTNNB1 and MAP2K1 in 4/49 (8%) and other rare/novel in-frame fusions involving PRKCA, PRKCB, MITF and ARAF in 5/49 samples (10%) (Fig. 3a; Supplementary Tables 3, 4).
Figure 3. Recurrent MAP3K8 fusions/truncations in a spitzoid melanoma cohort.
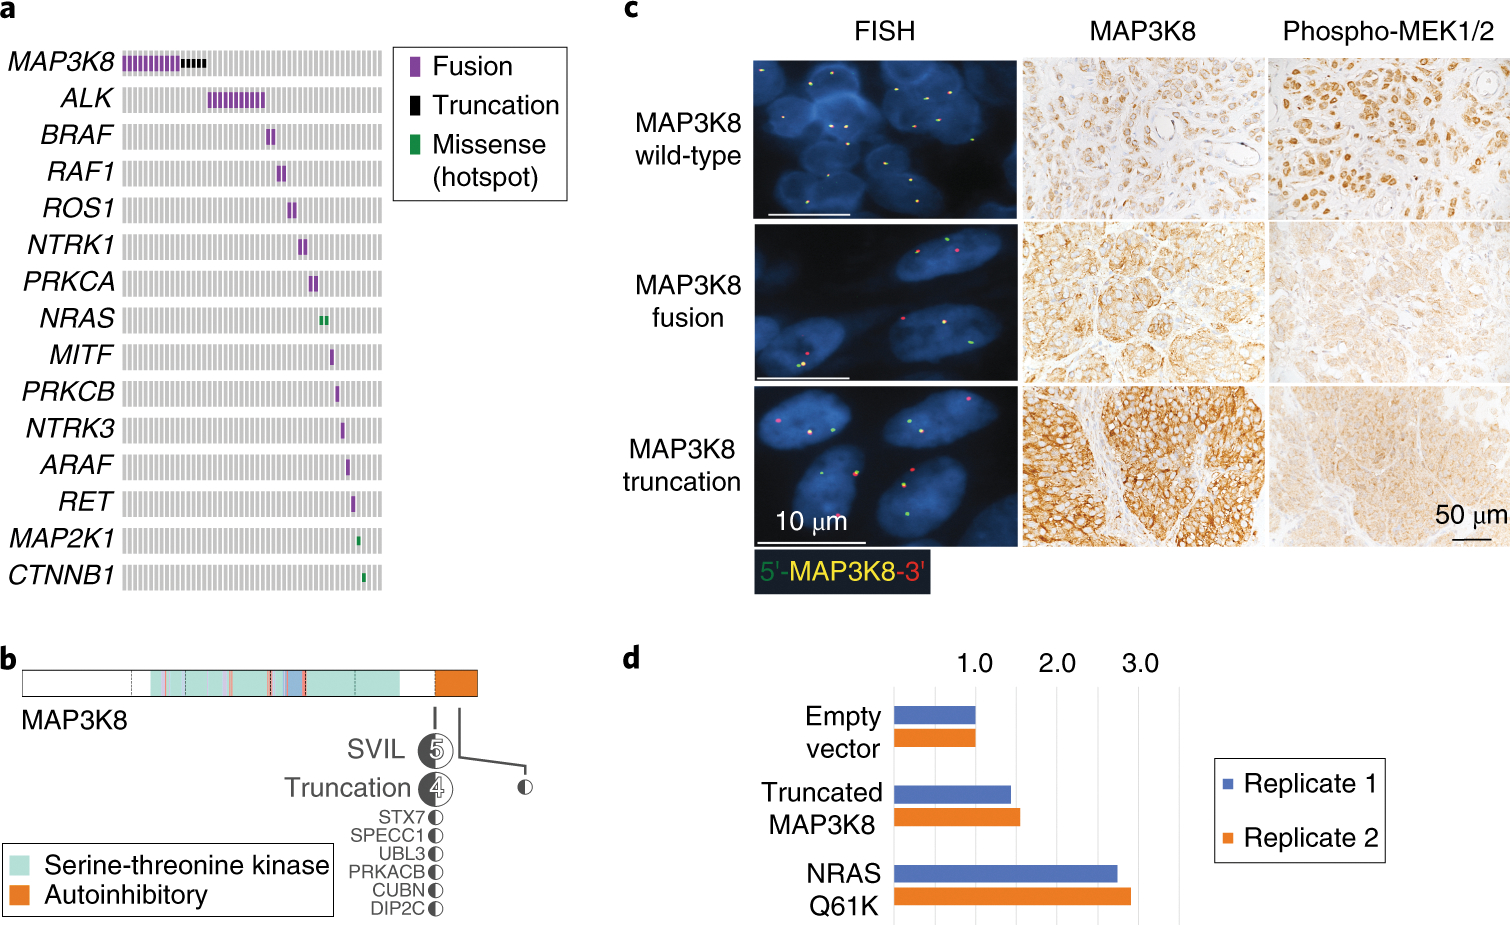
A) Tile plot showing fusions, truncations and hotspot mutations in 49 spitzoid melanomas/atypical Spitz tumors. Each patient is a single column of the grid. Fusions are shown in purple, truncations in black, hotspot mutations in green, and no mutation detected in grey. MAP3K8 fusions and truncations were the most common event in the cohort, found in 33% of cases. B) Schematic representation of MAP3K8 fusions and truncations detected by RNA-Seq. The RNA-Seq fusion point and partner genes are shown as a black/white lollypop plot. All fusions joined exon 8 of MAP3K8 to a partner locus and removed autoinhibitory exon 9. C) Representative FISH and IHC images from MAP3K8 wildtype, fused and truncated samples. Break apart FISH (column 1) confirms the translocation in two samples with the 5’ of MAP3K8 shown in green and the 3’ shown in red. All FISH images are at 100X magnification; at least 100 nuclei were analyzed across multiple fields in each tumor section; MAP3K8 rearrangements predicted by RNA-Seq were confirmed in 13/17 samples; no MAP3K8 rearrangements were observed in 11 control samples. Immunohistochemistry shows MAP3K8 and Phospho-MEK1/2 expression in the tumors. IHC staining for phospho MEK1/2 was done in 48 tumor specimens: the majority of tumor cells expressed pMEK1/2. The intensity of expression was weak in 13 tumors and moderate in 35 tumors. IHC staining for MAP3K8 was done in 45 tumor specimens. In the majority of tissue specimens (42 of 45), the antibody stained the cytoplasm of tumor cells with moderate to strong intensity compared to the adjacent squamous cells that were stained weakly or negatively. All IHC images at 40X magnification. D) Results from colony forming assays in soft agar with NIH 3T3 cells transfected, with empty vector, truncated MAP3K8 and mutant NRAS. Bar height shows the number of colonies normalized to the empty vector control for two replicates (blue and orange). Underlying colony counts for replicate one (blue) are vector=46, truncated MAP3K8=66, NRAS=126 and replicate two (orange) are 146, 226 and 424, respectively.
Strikingly, we detected MAP3K8 fusions in 11/49 patients (22%); all were in frame and included MAP3K8 exons 1–8 and replaced exon 9 with the coding sequence of one of seven alternative 3’ genes (Fig. 3b; Supplementary Table 3). An additional 5/49 patients (10%) had truncations of MAP3K8; in 4/5 cases exon 8 was fused with an intergenic region elsewhere in the genome and in a single case the truncation breakpoint fell within exon 9, replacing amino acids 440–468 with an intergenic region. We confirmed MAP3K8 rearrangements by FISH in samples from 13/16 patients where rearranged loci were sufficiently separated (> 1Mb) to be interrogated. We noted a pattern of mutual exclusivity between MAP3K8 rearrangements and other fusions or hotspot mutations, further implying that MAP3K8 was the driver oncogene in these cases (Fig. 3a).
As frozen tissue for Western blot was not available for the archival samples, we performed immunohistochemistry (IHC) on paraffin embedded tissue sections using an antibody against the N-terminus of MAP3K8. Expression was near ubiquitous across tumors but more consistently observed in the MAP3K8 fused and truncated samples than the non-rearranged samples (Fig. 3c). RNA-Seq showed that all rearranged samples had low exon 9 expression relative to exon 8 (Supplementary Table 5). In the most extreme case, SJMEL054961_D1 had 2364 RNA-Seq reads mapped to exon 8 (98th percentile in the cohort) and only 14 reads mapped to exon 9 (7th percentile), yet MAP3K8 staining was strong by IHC. All tumors tested showed MEK1/2 phosphorylation while phospho-MEK1/2 was absent in a normal skin sample (Fig. 2d). Thus, even though truncated MAP3K8 lacked the final exon, RNA-Seq combined with IHC suggested that truncated MAP3K8 mRNA was translated rather than undergoing nonsense mediated decay and the MEK was activated downstream.
The eight different MAP3K8 fusion partner genes (Fig. 3b) differed in size and had no consistent domain structure. The only shared feature was the loss of the final exon of MAP3K8 in the chimeric fusion protein. As truncated MAP3K8 also lacked the final exon, we hypothesized that replacing it with either an unrelated genetic sequence or an intergenic region that could function as a 3’UTR modulates MAP3K8 activity. Indeed, a previous study showed that C-terminal truncated MAP3K8 exhibited a 10-fold-higher kinase activity and was able to transform NIH3T3 cells 8. We replicated this finding by expressing truncated MAP3K8 in NIH3T3 cells in a colony forming assay. MAP3K8, devoid of the last exon, was oncogenic, although less so than a positive control NRAS Q61K (Fig. 3d).
MAP3K8 disruption leading to loss or replacement of the final exon was the most prevalent alteration in the 49 cases analyzed. Rearrangements were found in both atypical Spitz tumor and spitzoid melanoma cases; they may also be found in benign nevi, as other driving mutations or fusions are 9–11, but suitable benign Spitz samples were not available for us to assess.
To our knowledge, MAP3K8 has not been described as a significantly mutated gene in cancer1,2,12–14. Evaluation of point mutation data on COSMIC 15 and CBioPortal 16 revealed a potential mutational hotspot at R442 within the final exon in colorectal (n=4), ovarian (n=2), and endometrial (n=1) cancer. Although in-silico prediction showed that the mutation could be deleterious 16, functional studies are required to validate the pathogenicity of these variants (Extended Data 4; Supplementary Table 6).
To search for structural rearrangements of MAP3K8, we performed a locus-specific screen of RNA-Seq from 472 TCGA melanoma samples. As both our index patient sample and recurrence cohort showed relatively lower expression of MAP3K8 exon 9 due to the rearrangement (Fig. 2c; Supplementary Table 5), we assessed TCGA samples for a similar pattern of expression. We identified seven outliers whose exon 9 expression was less than 10% of exon 8 (p < 1×10⁻¹⁰ by Grubb’s test). (Fig. 4a, 4b, Supplementary Table 7). Our fusion gene detection pipeline confirmed MAP3K8 fusions and truncations in 3/7 cases. Manual inspection of aligned reads in the remaining four cases confirmed that a structural variant junction was present, but the RNA-Seq read lengths were too short (<75bp) for automated fusion prediction (Fig. 4c; Extended Data 5; Supplementary Table 8). In all, 7/472 (1.5%) TCGA melanoma samples had evidence of MAP3K8 fusion (2/7) or truncation (5/7): None of these samples had an alternative MAPK pathway mutation according to TCGA analysis 12, aggregated data presented in NCI Genomic Data Commons, or within a database of TCGA gene fusions 13. It was not clear from the available data if these rearranged tumors were spitzoid 12,17. However, two recent studies reported a MAP3K8-DEK fusion and likely MAP3K8 truncation in acral melanomas, with the same recurrent MAP3K8 breakpoint 14,18. We, therefore, consider it likely that some adult melanomas lacking other MAPK-activating mutations are driven by this oncogene.
Figure 4. MAP3K8 fusions and truncations in TCGA melanoma samples.
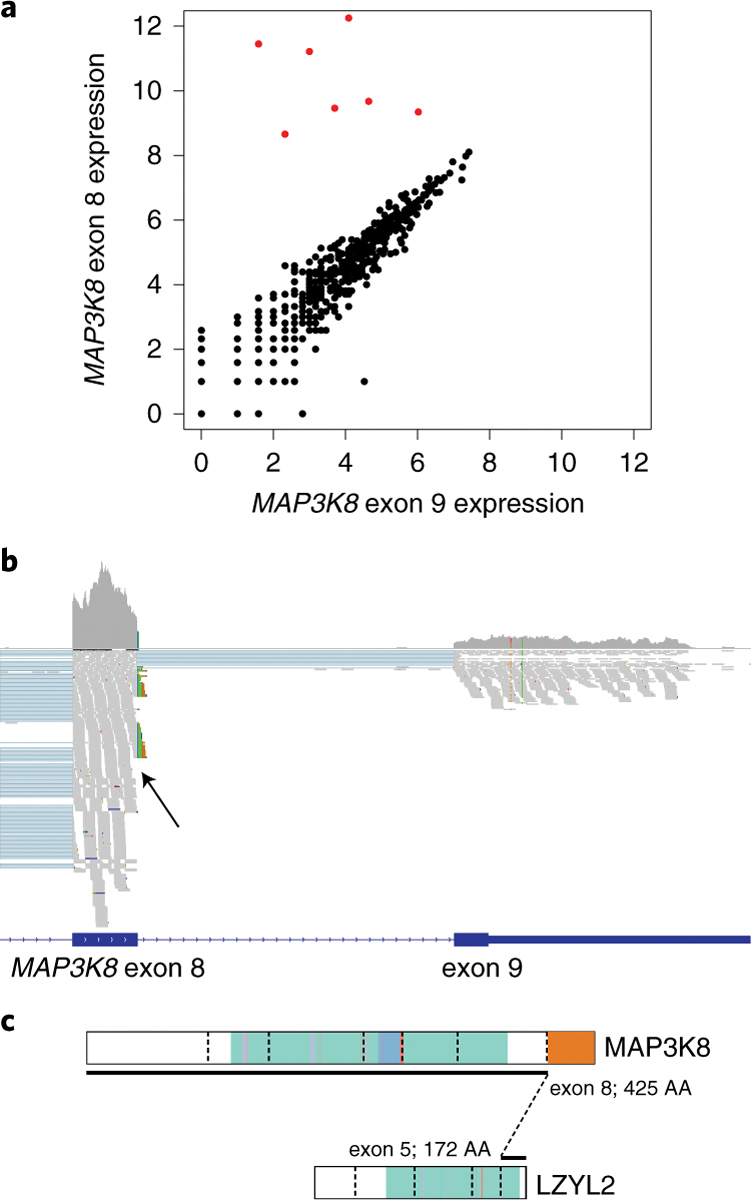
A) Scatterplot showing differential expression of exon 9 relative to exon 8 in 472 TCGA “SKMEL” melanoma samples. Raw read counts are plotted on a log2 scale. The seven samples with highly differential exon 8/9 expression are plotted in red corresponding to TCGA-ER-A196–01A, TCGA-EE-A20I-06A, TCGA-FR-A2OS-01A, TCGA-EB-A4IQ-01A, TCGA-D3-A2J6–06A, TCGA-FS-A1Z4–06A and TCGA-Z2-AA3S-06A. B) IGV visualization 33 of RNA-Seq data from TCGA-FS-A1Z4. The upper grey histogram shows relatively higher expression of MAP3K8 exon 8 compared to exon 9, similar to rearranged spitzoid samples. TCGA-FS-A1Z4 is shown here as a representative rearranged sample. All seven rearranged samples from TCGA were inspected in a similar manner and showed the same pattern of low exon 9 expression and clipped reads at the exon 8 boundary whereas a random selection of ten un-rearranged samples did not display this pattern. Aligned reads are shown below the histogram as small grey rectangles. A cluster of clipped reads indicating the presence of a MAP3K8-LZYL2 fusion is indicated with a black arrow; clipped reads on the LZYL2 side of the fusion junction corroborated this, as did BLAT alignment of the clipped reads. C) Schematic representation of MAP3K8-LZYL2 fusion found in TCGA-FS-A1Z4.
MAP3K8, also known as COT and TPL2, is a serine–threonine protein kinase that activates ERK1/2 through phosphorylation of its direct substrate MEK 3,4. MAP3K8 overexpression is oncogenic in breast, ovarian, squamous cell carcinoma and lung cancer 19–22 and preclinical studies suggest MEK inhibition is a viable strategy for tumors dependent on this oncogene 19. In melanoma cells, high MAP3K8 expression causes resistance to BRAF inhibitors through a MEK-dependent mechanism that does not require BRAF activation upstream 6. Previous functional studies showed that the C-terminal domain, encoded by the final exon, is necessary for targeting of MAP3K8 for proteasomal degradation 8. Additionally, the MAP3K8 C-terminus inhibits the activity of the kinase domain and truncated MAP3K8 has a substantially higher kinase activity than the wild type protein 8,23. Finally, C-terminal truncations and activation of MAP3K8 caused by viral integration have been described in murine T-cell lymphomas and mammary adenocarcinomas 24,25. The substantial in vitro evidence suggests that removal of the final exon of MAP3K8 through fusion or truncation is an oncogenic event that can drive spitzoid and other melanomas.
Therapeutic targeting of the MAPK signaling cascade is of great relevance to melanoma 26–31 and the presence of a MAP3K8 abnormality may predict response to trametinib. The in vivo response in our patient, although transient, provided a preliminary support for the efficacy of MEK inhibition in patients that harbor this lesion; however, future clinical studies are necessary to explore this further.
Our analysis of a single index case highlights the value of comprehensive sequencing in identifying previously undescribed somatic alterations that can impact treatment. The unbiased genome-wide approach directly facilitated detection of the fusion gene. Of note, MAP3K8 is not a targeted gene in popular FDA approved/cleared gene panels and further development cycles would be necessary to incorporate this locus into the assay design.
METHODS
Specimens
The tumor sample in our original patient, SJMEL030083, was sequenced according to an institutionally approved protocol, Genomes for Kids (IRB #Pro00005011). Written informed consent was obtained in accordance with this protocol and in accordance with ethical guidelines for protection of human subjects. Tumor purity was approximately 78% by NGS analysis, which correlated well with the pathologist’s estimate.
Archival specimens were sequenced under institutional review board-approved study (St. Jude Children’s Research Hospital IRB# XPD17–190 and XPD18–094). These studies were designated to be minimal risk and therefore granted a waiver of informed consent for the use of material previously collected for non-research purposes.
All archived samples had been reviewed by a pathologist and were consistent with spitzoid melanoma (n=36; including the index case) or atypical Spitz tumor (n=14) based on the combination of clinical, histologic and molecular cytogenetic criteria as previously described 34. TCGA sequencing data was downloaded from the NIH GDC website following appropriate data access approval (project #9335).
The specimens were obtained mostly from children and adolescents (27 females and 23 males), ranging in age from 2 to 28 years (mean, 9.5 years; median, 9 years). One sample came from an older adult patient.
Life Sciences Reporting Summary in accordance with Nature Research policies can be found in the accompanying REPORTING_SUMMARY.pdf file.
Sequencing
G4K sequencing of whole genome, exome and transcriptome from fresh frozen tissue was performed as described previously 35. For archival samples, we extracted RNA from between two and eleven FFPE tissue sections using an H & E stained guide slide to allow the technician to enrich for tumor material. 150–200ng RNA was extracted using a Maxwell RSC (Promega) using the RSC RNA FFPE Kit. Quality metrics were then determined using Qubit (Life Technologies) and BioAnalyzer (Agilent). We removed ribosomal RNA using Kapa rRNA depletion reagents and converted into cDNA libraries using Kapa RNA HyperPrep Kit with RiboErase (HMR). After adapter ligation, each cDNA library was purified and enriched by 12 cycles of PCR. Each library underwent 75-cycle paired-end sequencing on the Illumina HiSeq 4000. Three to Four samples were multiplexed into each flow cell lane. Sequence data were collected from the Illumina instrument using HiSeq Control Software (HCS) version HD 3.4.0.38 and Real-Time Analysis (RTA) version 2.7.7. After sequencing, de-multiplexing and file conversion was performed using bcl2fastq2 version 2.20.
Bioinformatics
Bioinformatics alignment, QC and analysis were performed as described previously 35–37. CICERO (Clipped-reads Extended for RNA Optimization) is an assembly-based algorithm used for fusion gene detection. CICERO comprises four main steps: 1) soft-clip site selection; 2) read assembly; 3) contig mapping and 4) fusion annotation and ranking. In the first step, sites with soft-clip reads are filtered to remove those with low frequency (<1%) of soft-clipped reads in all RNA-Seq reads. In step 2, soft-clipped reads and their paired-end partner reads are assembled into contigs using CAP3 (v.1.0; http://seq.cs.iastate.edu/cap3.html) under default parameters and mapped to the reference genome using BLAT (v.35; https://users.soe.ucsc.edu/~kent/src/) (parameters -o 25 -z 2 -h 60 -y 10). Those with partial mapping to the soft-clip site are candidates for fusion transcripts while those not mapped to the soft-clipped site are rejected. A repeat score is calculated if a contig is mapped to multiple genomic locations. For a fusion contig that passes the step 3 mapping, a frame-check is performed to evaluate whether the fusion transcript is in-frame (step 4). This process starts by generating three alternative protein coding frames from the fusion contig, then attempts to anchor the partner genes to each reading frame. To rank fusion candidates, an overall score is assigned by considering supporting reads, expression ratio, repeat score and fusion reading frame annotation.
We manually verified fusion contigs constructed by CICERO using BLAT online at (https://genome.ucsc.edu/cgi-bin/hgBlat?command=start) and in some cases adjusted breakpoint coordinates based on BLAT results. All fusion sequence contigs are available in Supplementary Tables 3 and 8.
Counting of mapped RNA-Seq reads overlapping exons was done with HTSeq v2.7.2 38 using standard parameters. Gene level FPKM calculations were done using HTSeq and the refSeq gene model, refFlat.gtf file. Exons were numbered according to RefSeq NM_005204 and NM_ 053064. Read count plots were generated using R v.3.4.3. Mutational signature analysis was performed with the MutationalPatterns R package v.1.6.1 using recommended parameters 39. Transcriptome sequencing data were visualized using IGV v.2.4.8 33. To confirm CICERO fusion gene predictions, we also ran Defuse v.0.6.2 40 and list results in Supplementary Table 3.
Code Availability
Our fusion gene detection pipeline, based on the CICERO algorithm v.1.0 (Li et al. manuscript in preparation), is available online at https://stjude.cloud/tools and source code is available upon request.
TCGA Data Analysis
We downloaded bam file slices containing the MAP3K8 locus for all TCGA-RNA-Seq samples available through the NIH Genome Data Commons (GDC). We used HTSeq to count reads mapped to MAP3K8 exons 8 (chr10:30748184–30748430[hg19]) and the coding portion of exon 9 (chr10:30749635–30749765[hg19]). We performed Grubb’s test for a single outlier using the R “outliers” package on an array of expression ratios. After each iteration, we removed the top outlier and recalculated the statistic. Exact p-values are shown in Supplementary Table 7.
cBioPortal Data Mining
We searched the cBioPortal online (http://www.cbioportal.org) across all studies comprising 66,939 cases (September 2018) for mutations within MAP3K8. We downloaded data from the web portal, removed duplicate entries and visualized results using ProteinPaint 32 (https://pecan.stjude.cloud/proteinpaint/).
Immunohistochemistry
Immunohistochemistry (IHC) was performed on 4-μm-thick FFPE tissue sections, following heat-induced epitope retrieval (tris buffer, pH 8.5), using the following antibodies: rabbit anti-phospho-MEK1/2 (Ser221) monoclonal antibody (1:25 dilution; 16 min incubation; 2338; Cell Signaling Technology, Danvers, MA, USA), rabbit anti-MAP3K8 (amino acids 223–467) polyclonal antibody (1:600 dilution; 16 min incubation; ab137589; Abcam, Cambridge, MA, USA). The results were scored as positive or negative, and the intensity of staining was recorded. Immunohistochemistry images were captured using NIS-Elements BR (4.30.02 64bit) software.
Fluorescence in Situ Hybridization (FISH)
To validate MAP3K8 gene rearrangements, we performed MAP3K8 break-apart assay in all FFPE tissue samples found by RNA-Seq to carry the gene fusion. A subset of samples with alternative alterations were also included as negative controls. In addition, we performed break-apart PRKCA assay in samples found by RNA-Seq to have PRKCA gene fusion, and break-apart TERT promoter assay in both the primary biopsy and the metastatic tumor of the index case. Custom probes were generated, as previously described 41, using bacterial artificial chromosomes (BAC) clones, obtained from BACPAC Resources of Children’s Hospital of Oakland Research Institute (Oakland, CA, USA), flanking MAP3K8 (CH17–364M4; CH17–471D1), PRKCA (CH17–384F08 and CH17–209D17), and the TERT promoter (CH17–75N21 and CH17–410B01). Break-apart FISH for ALK was performed on samples found by RNA-Seq to have ALK fusion, using commercially available probes (CytoCell, Cat# LPS 019-A). Dual-color FISH was performed on 4-μm FFPE tissue sections, as previously described 1. FISH images were captured using CytoVision 7.5 software.
Cell lines
An hTERT immortalized human melanocyte line (ABM, Richmond, CA; #T0462) was used as a control for these studies. They were grown in Prigrow II medium containing 10% fetal bovine serum supplemented with L-glutamine (0.3g/L) and glucose (2g/L) under an atmosphere of 5% CO2. NIH 3T3 cells were also used and cultured under standard conditions.
Colony Forming Assays
Colony forming assays in NIH 3T3 cells were undertaken essentially as described previously 42. We cloned NRAS Q61K, and MAP3K8 truncated at amino acid 424 into a pCMV6 vector (Origene). Briefly, cells were transfected using Lipofectamine 3000 (ThermoFisher Scientific, Waltham, MA) and were then diluted (7,500 cells per well) into complete media at 42°C containing agar (0.3% final concentration). This was then evenly pipetted onto prepared plates containing an 0.5% agar/complete medium base. When the upper layer had set, media was applied to prevent desiccation. After 28 days incubation at 37°C, colonies were visualized by staining with nitroblue tetrazolium chloride and images were recorded using an Epson V700 scanner. Quantitation of colonies was achieved using Image J version 1.5 software (https://imagej.nih.gov/ij/).
Western blots
Samples for Western blot analysis were generated by sonication of cells in RIPA buffer containing protease and phosphatase inhibitors. Following centrifugation, supernatants were recovered, and proteins separated (25ug per lane) using precast NuPAGE 4–12% Bis-Tris gels (Life Technologies, Carlsbad, CA). After transfer to membranes, immunoreactivity to MAP3K8 (Abcam, Cambridge, UK; #ab137589) pMEK (Abcam, #ab96379), pERK1/2 (Abcam, #ab47339) and GAPDH (Cell Signaling Technology, Danvers, MA, #8884) was determined. This was accomplished using appropriate secondary antibodies and SuperSignal ECL (ThermoFisher Scientific) using a Licor Odyssey Fc system. Western blots were imaged using Image J version 1.5 software (https://imagej.nih.gov/ij/).
Data Availability
The raw WGS, exome and RNA-Seq dataset generated for the index patient are available in St. Jude Cloud, https://platform.stjude.cloud/requests/publications?publication_accession=SJC-PB-1018 and have also been deposited in EGA under accession number EGAS00001003430. RNA-Seq data from archival samples are available from the authors upon reasonable request and with permission from the St. Jude Children’s Research Hospital IRB.
Extended Data
Extended Data Fig. 1. Clinical Course.
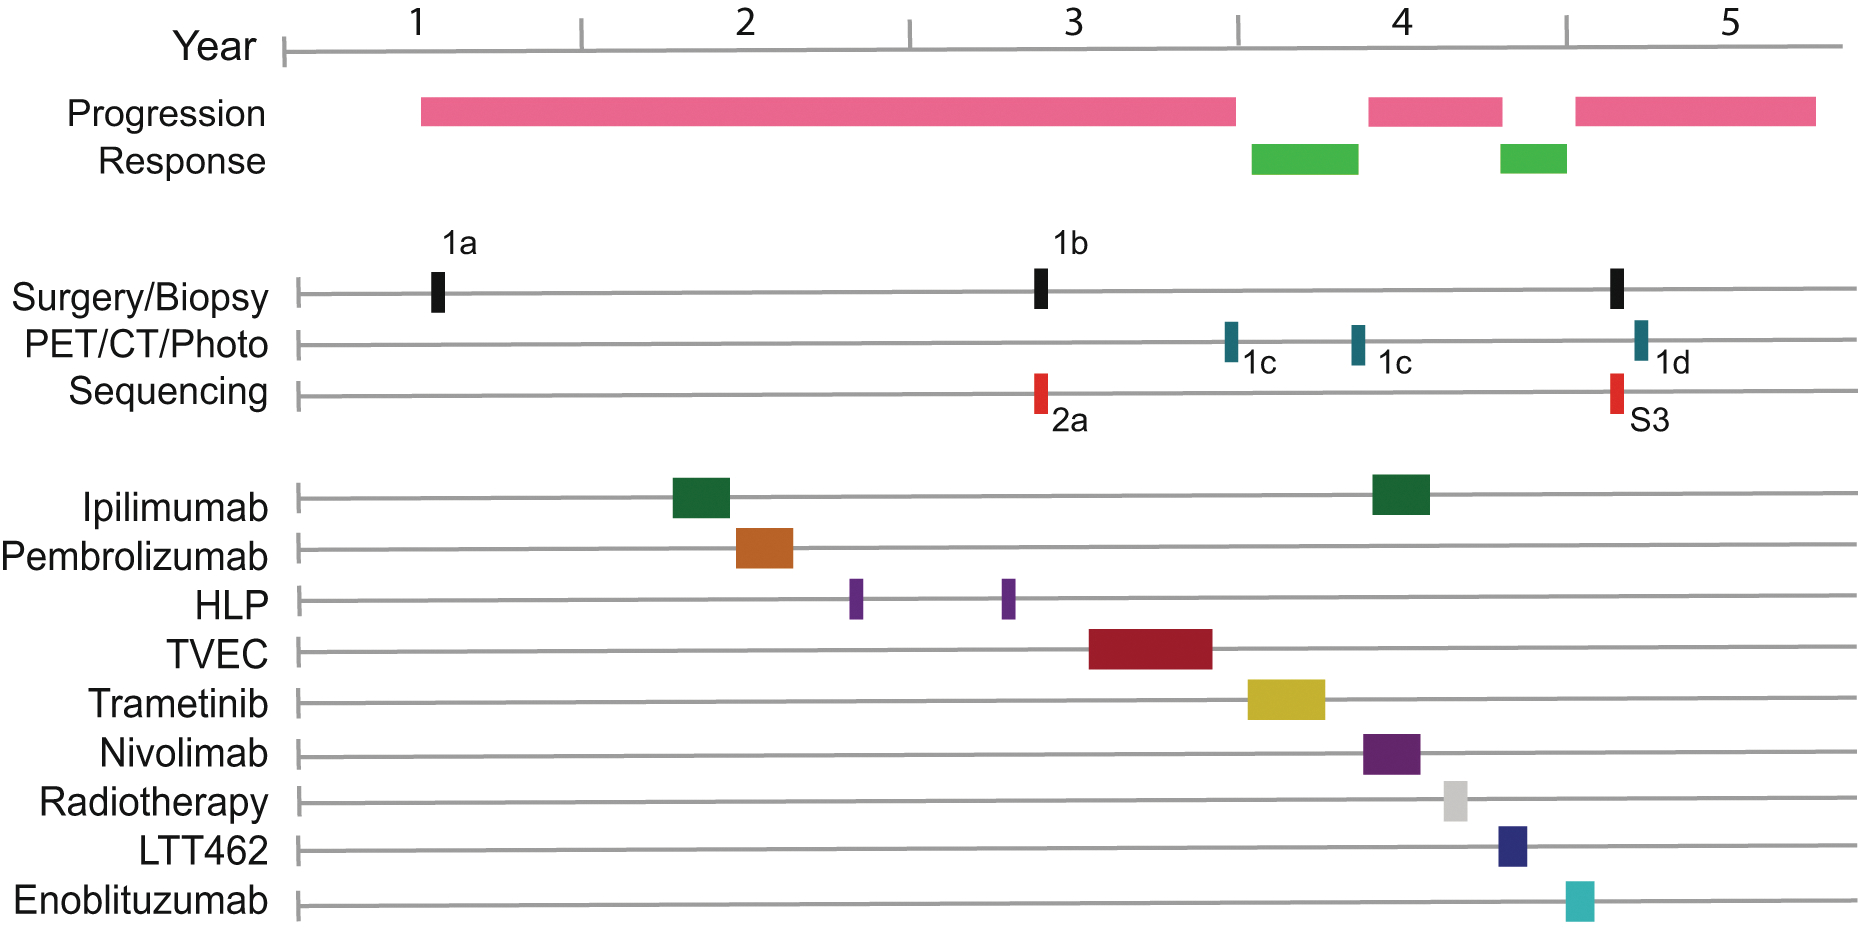
Timeline of the clinical course imaging, and treatment regimens are shown as colored rectangles along the horizontal timeline. For treatments, HLP is hyperthermic limb perfusion, TVEC is talimogene laherparaepvec and LTT462 is an ERK inhibitor. Subsequent figures within this manuscript showing specimens or images from this timeline are indicated.
Extended Data Fig. 2. TERT rearrangement in the initial tumor.
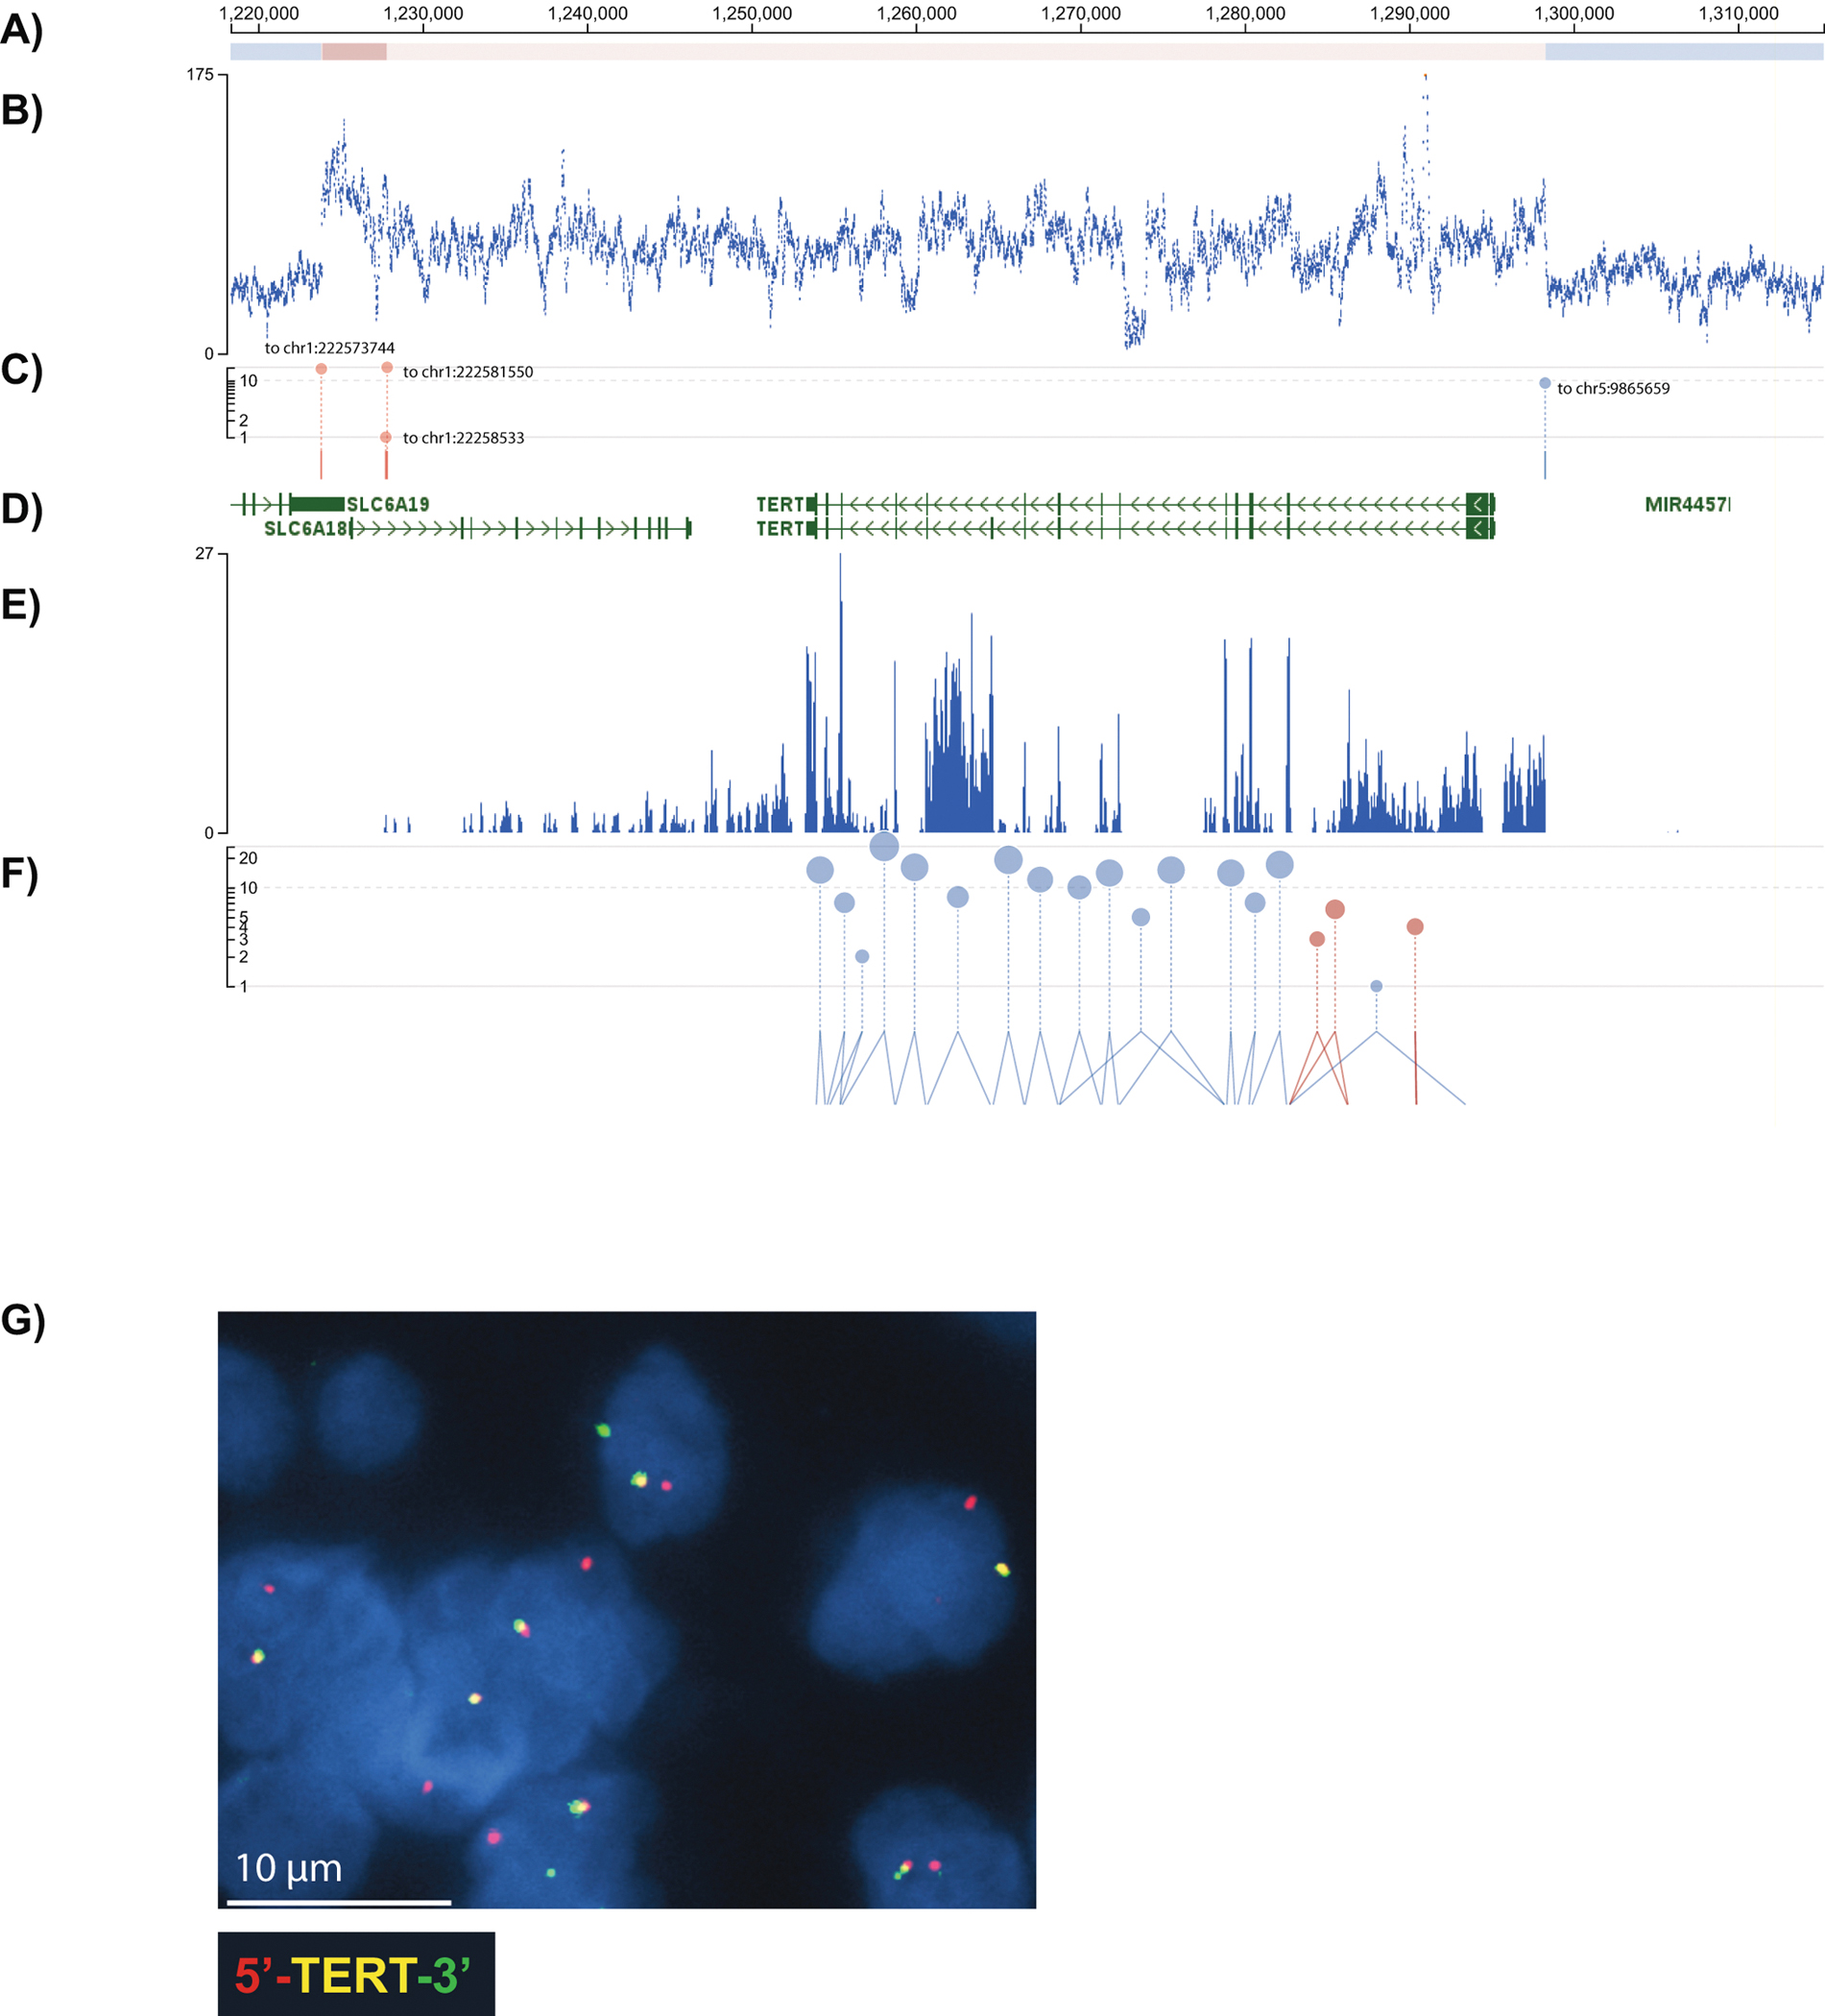
A) Copy number segments from CONSERTING 43; red shows a gain in copy number and blue, a loss. B) Scatterplot of normalized sequencing coverage from whole genome sequencing confirms a 75 kb region of neutral copy number encompassing the TERT locus flanked by deletions. C) Structural variant junctions are shown in blue for junctions within the same chromosome and red for junctions linking different chromosomes; the genome position of the partner locus is shown inline. D) RefSeq gene model showing the position of TERT. E) RNA-Seq coverage shows that TERT is expressed. We inspected RNA-Seq coverage at this locus for our 49 additional patient samples and found TERT expression to absent. F) Splice junctions detected in RNA-Seq and quantified according to the y-axis. Canonical splices are shown in blue and non-canonical splices are in red. G) An image of break-apart FISH for TERT performed on the primary tumor from the index case shows split red and green signals, consistent with TERT rearrangement. We performed FISH on X additional tumors and found this locus not to be rearranged. All FISH images are at 100X magnification.
Extended Data Fig. 3. MAP3K8 and GNG2 copy number and expression in initial and relapsed tumors.
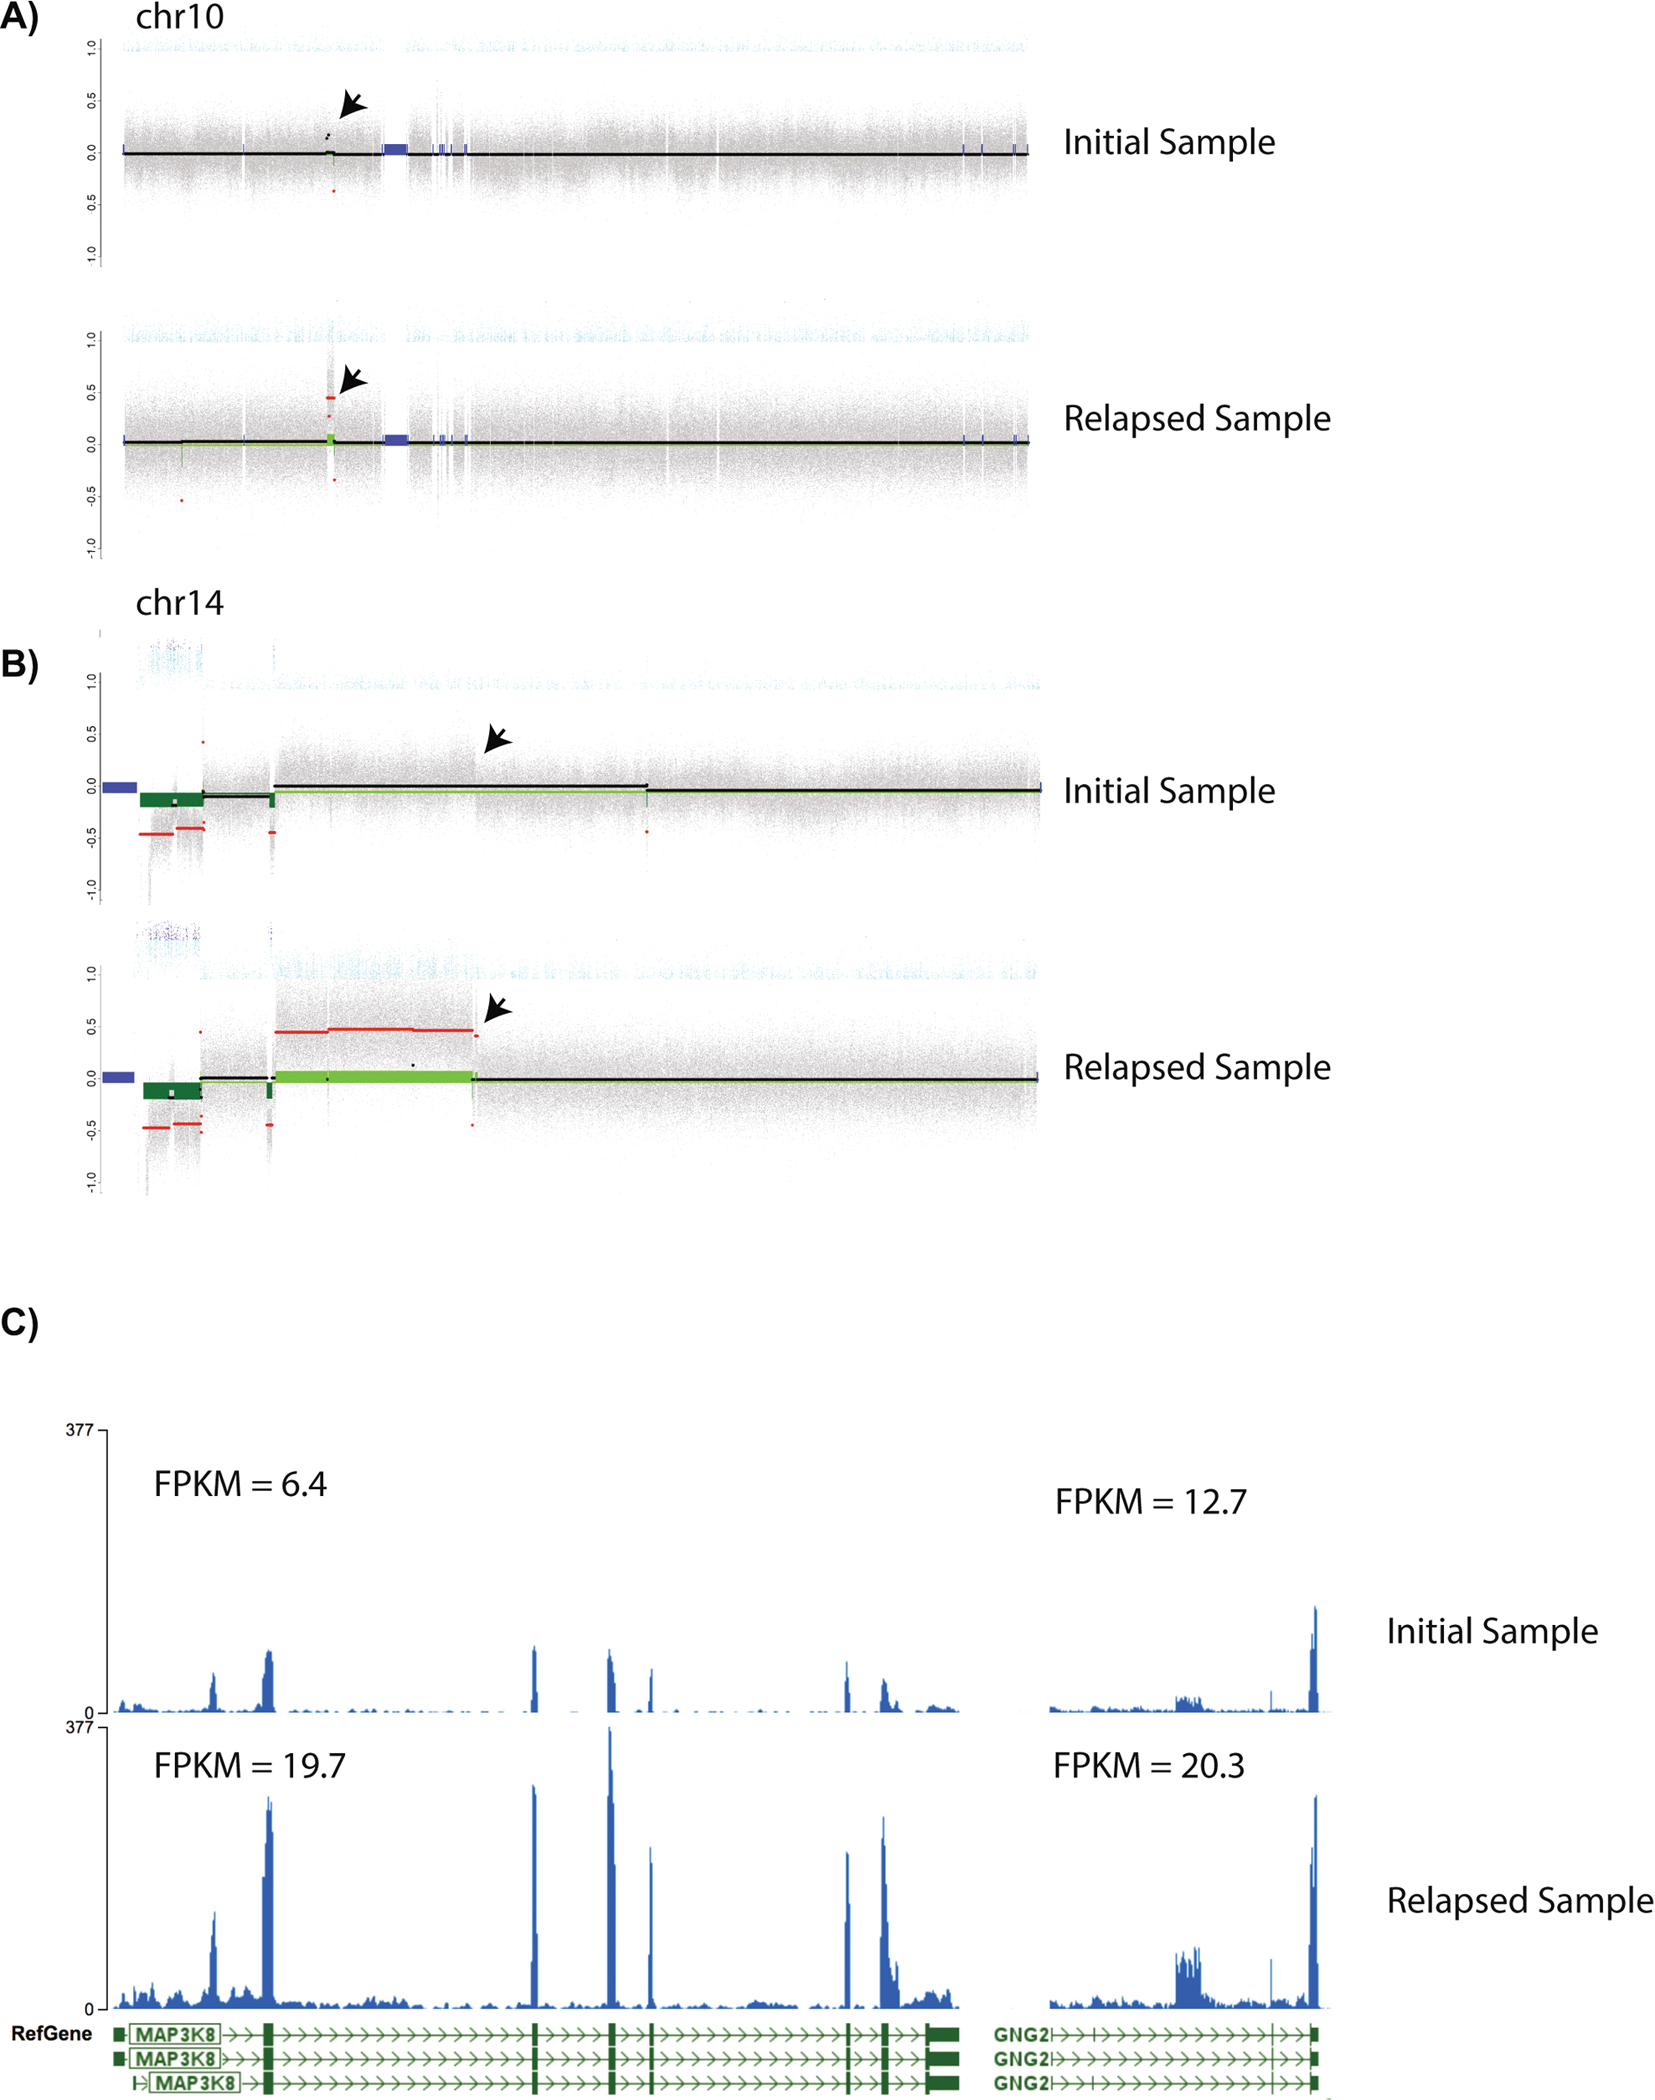
Copy number profile from CONSERTING for A) chromosomes 10 and B) chromosome 14. Grey scatterplot represents normalized whole genome sequencing read depth arranged by genome position on the x-axis. Changes in copy number are evident as segmental shifts on the y-axis. Although a deletion is evident at the start of 14q, no copy number changes are present at the MAP3K8 (chr10:30,720,950–30,752,762) or GNG2 (chr14:52,325,022–52,438,518) loci in the initial tumor sample (black arrows represent the locations of MAP3K8 and GNG2) on chromosome 10 and 14 respectively. In the relapsed sample, the copy number of both loci are increased copy number. C) RNA-Seq coverage with the initial tumor sample’s MAP3K8 and GNG2 loci in the upper panels and the relapsed tumor below. MAP3K8 and GNG2 expression are increased approximately four-fold in the relapsed sample.
Extended Data Fig. 4. MAP3K8 mutations across cBioPortal studies.
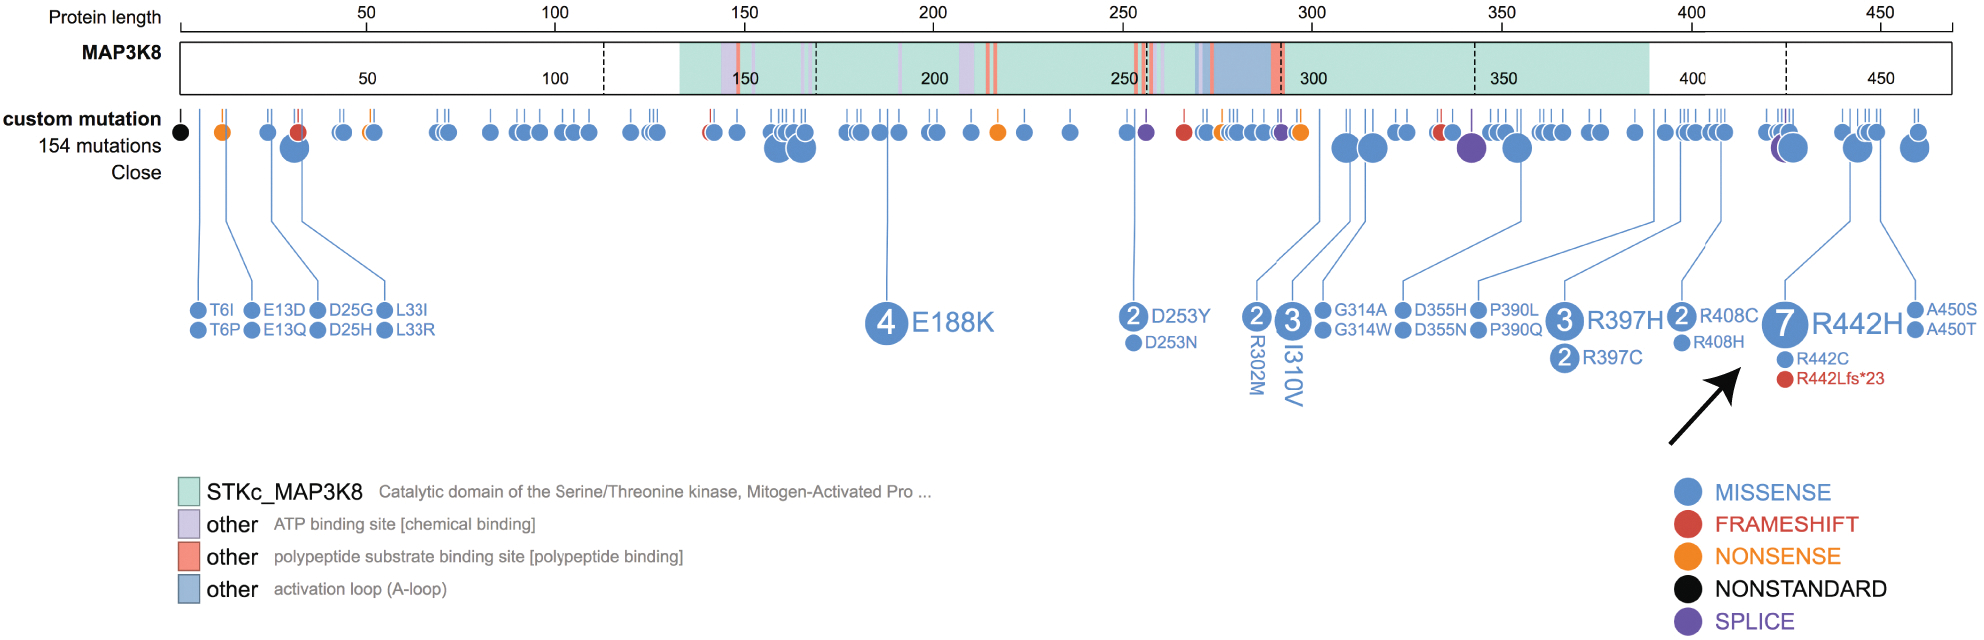
ProteinPaint 32 representation of MAP3K8 mutations found over 226 studies housed within cBioPortal 16. Specific amino acid changes are shown as lollypops with a size proportional to their frequency in the cohort. The most frequently mutated tumor types were Uterine Endometrioid Carcinoma (n=25), Colorectal Adenocarcinoma (n=21) and Cutaneous Melanoma (n=20). A hotspot at R442 is indicated by the black arrow. According to ELM 44 (http://elm.eu.org/), Arg442 it is part of the sequence KRQRSLYIDL described previously as a MAPK docking site in MAP kinase substrates 45. Interestingly, the MAP3K8 truncation in SJMEL054992_D1 is at codon R440, thus is just R442 excluded from the truncated MAP3K8.
Extended Data Fig. 5. MAP3K8 Fused and Truncated samples from TCGA.
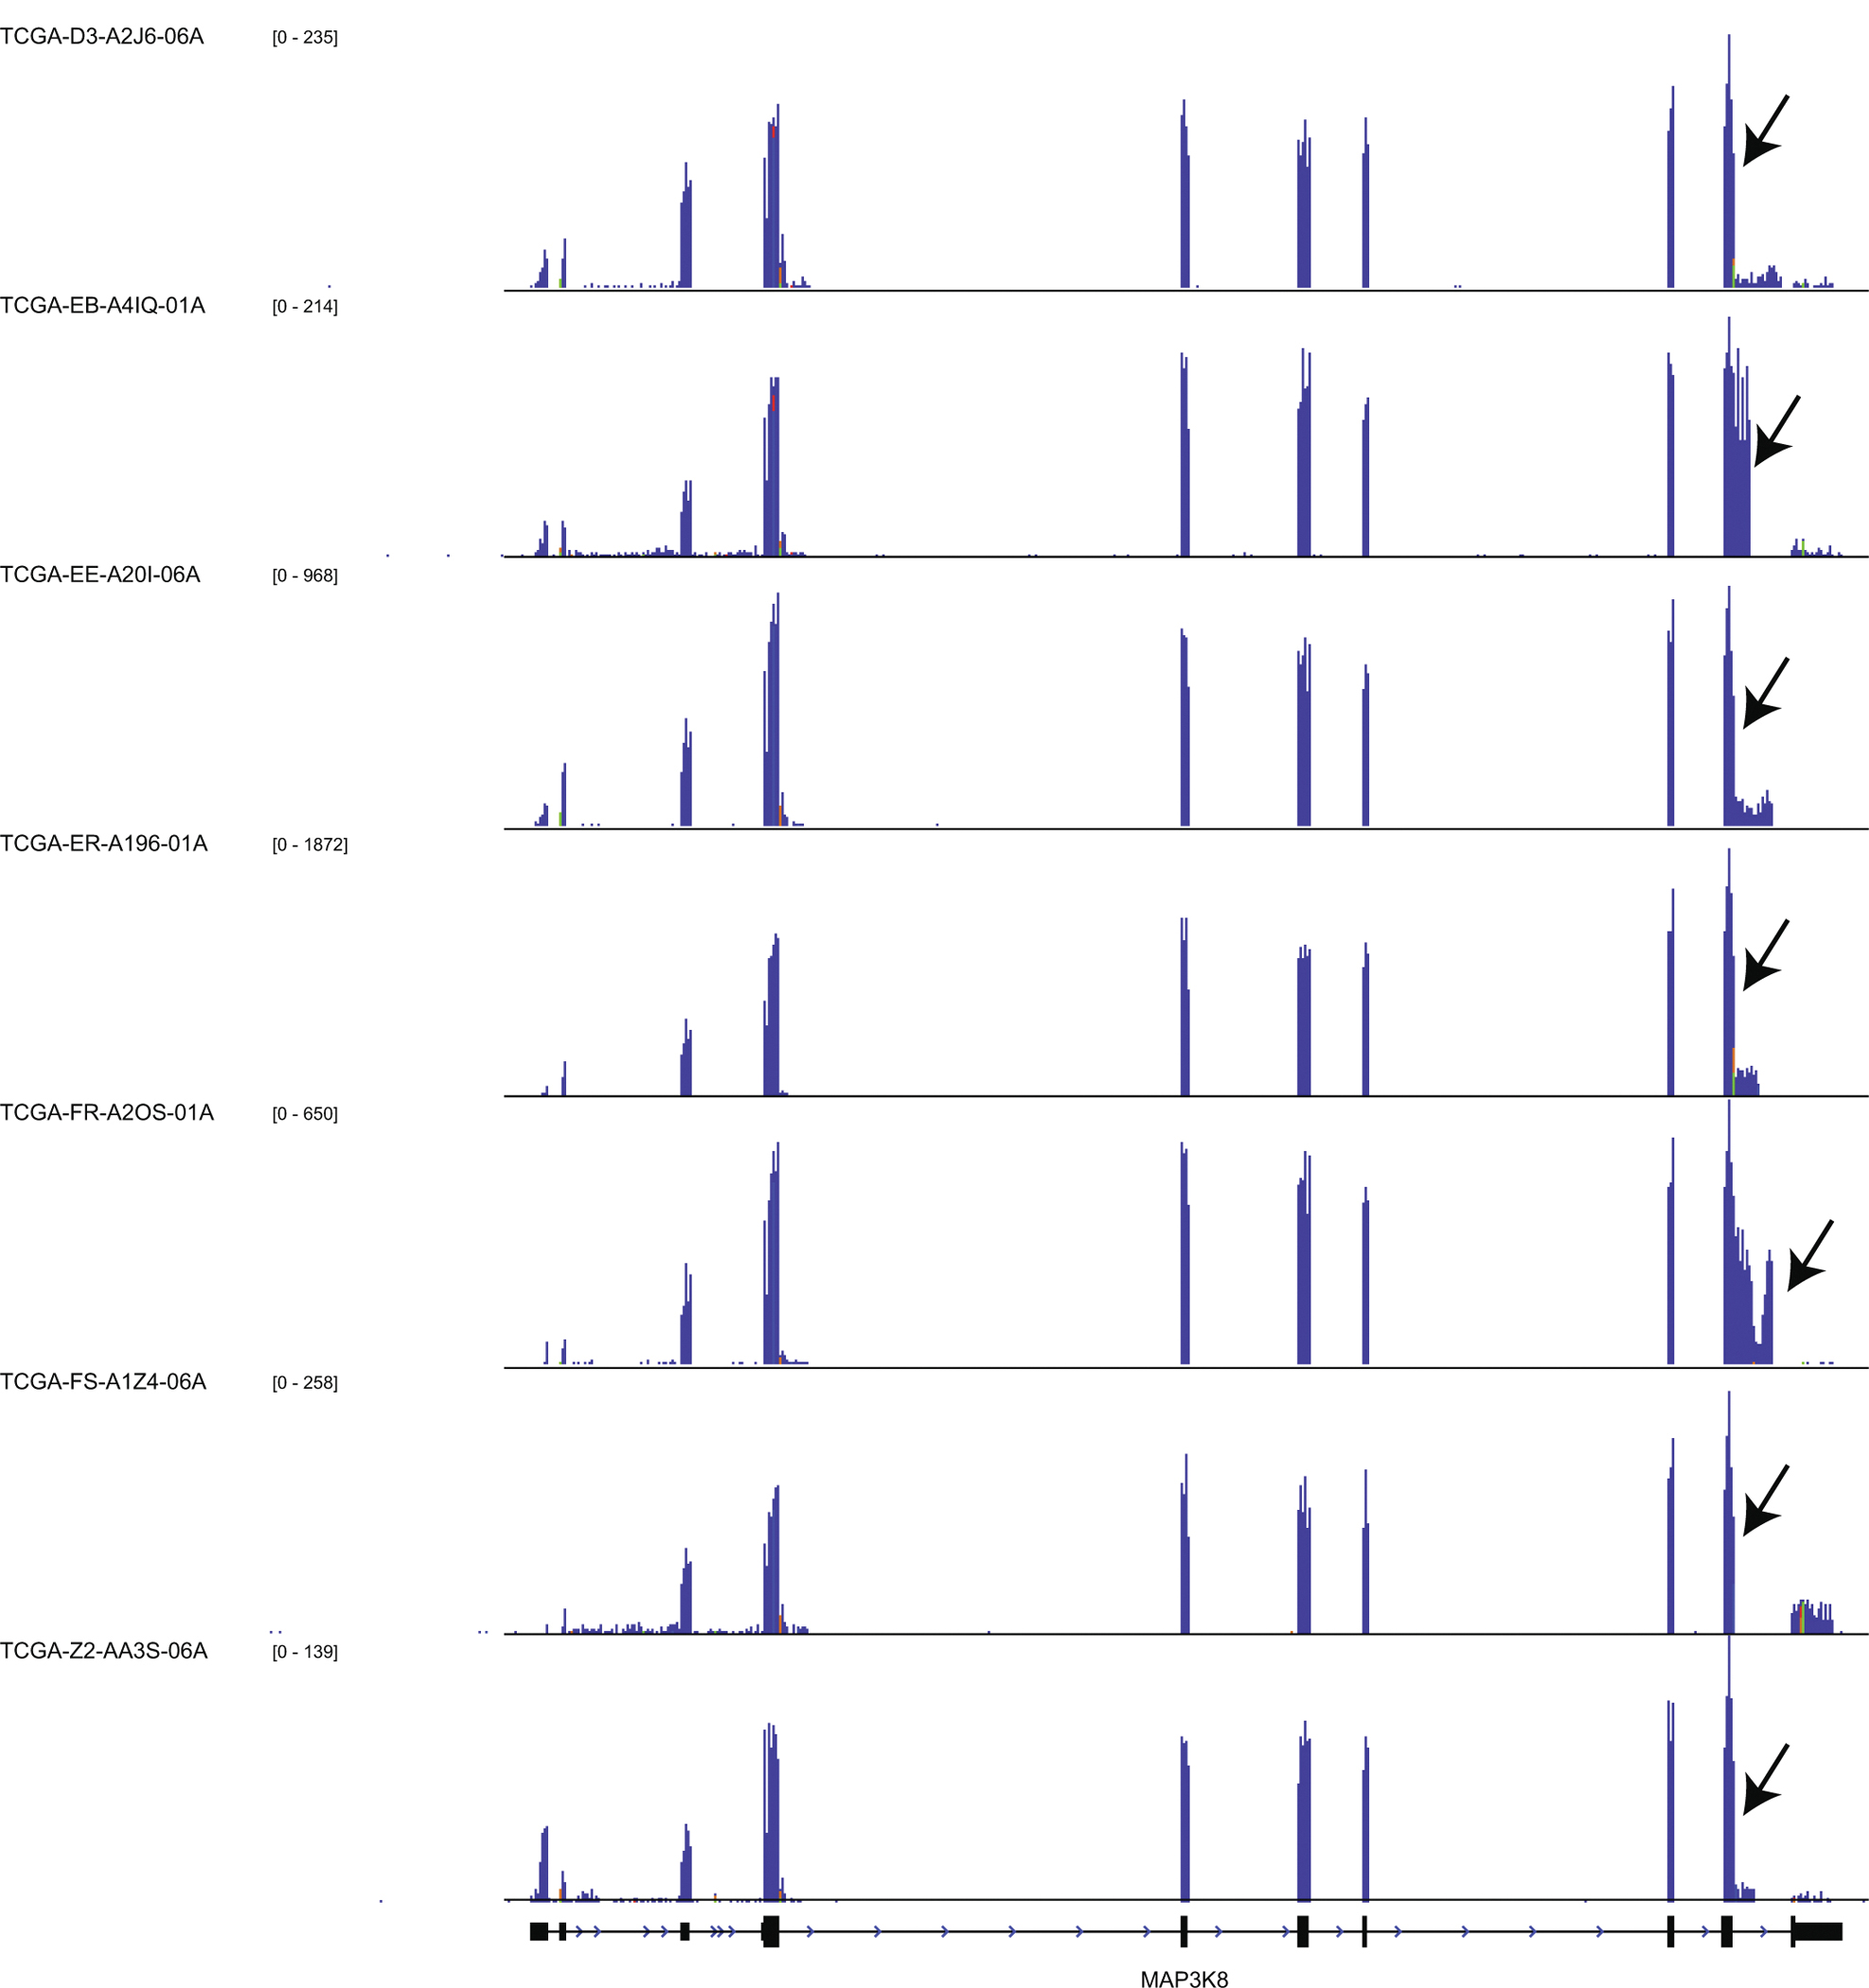
RNA-Seq coverage overlapping the MAP3K8 locus is shown by the blue histograms. Each histogram is scaled according to the corresponding Y-axis. Black arrows indicate the positions of fusions or truncations as outlined in Supplementary Table 6. The MAP3K8 locus of all seven rearranged samples is shown.
Supplementary Material
ACKNOWLEDGEMENTS
We thank Samuel Brady for critical review of the manuscript. This work was funded by the American Lebanese Syrian Associated Charities of St. Jude Children’s Research Hospital.
Footnotes
COMPETING INTERESTS
The authors declare no competing interests.
REFERENCES
- 1.Lu C et al. The genomic landscape of childhood and adolescent melanoma. J. Invest. Dermatol. 135, 816–823 (2015). [DOI] [PMC free article] [PubMed] [Google Scholar]
- 2.Wiesner T et al. Kinase fusions are frequent in Spitz tumours and spitzoid melanomas. Nat Commun 5, 3116 (2014). [DOI] [PMC free article] [PubMed] [Google Scholar]
- 3.Salmeron A et al. Activation of MEK-1 and SEK-1 by Tpl-2 proto-oncoprotein, a novel MAP kinase kinase kinase. EMBO J. 15, 817–826 (1996). [PMC free article] [PubMed] [Google Scholar]
- 4.Hagemann D, Troppmair J & Rapp UR Cot protooncoprotein activates the dual specificity kinases MEK-1 and SEK-1 and induces differentiation of PC12 cells. Oncogene 18, 1391–1400 (1999). [DOI] [PubMed] [Google Scholar]
- 5.Alexandrov LB et al. Signatures of mutational processes in human cancer. Nature 500, 415–421 (2013). [DOI] [PMC free article] [PubMed] [Google Scholar]
- 6.Johannessen CM et al. COT drives resistance to RAF inhibition through MAP kinase pathway reactivation. Nature 468, 968–972 (2010). [DOI] [PMC free article] [PubMed] [Google Scholar]
- 7.Little AS et al. Amplification of the Driving Oncogene, KRAS or BRAF, Underpins Acquired Resistance to MEK1/2 Inhibitors in Colorectal Cancer Cells. Sci. Signal. 4, ra17 (2011). [DOI] [PubMed] [Google Scholar]
- 8.Gándara ML, López P, Hernando R, Castaño JG & Alemany S The COOH-terminal domain of wild-type Cot regulates its stability and kinase specific activity. Mol. Cell. Biol. 23, 7377–7390 (2003). [DOI] [PMC free article] [PubMed] [Google Scholar]
- 9.Lazova R et al. Spitz nevi and Spitzoid melanomas - Exome sequencing and comparison to conventional melanocytic nevi and melanomas. Mod Pathol 30, 640–649 (2017). [DOI] [PMC free article] [PubMed] [Google Scholar]
- 10.Shain AH et al. The Genetic Evolution of Melanoma from Precursor Lesions. New England Journal of Medicine 373, 1926–1936 (2015). [DOI] [PubMed] [Google Scholar]
- 11.Pollock PM et al. High frequency of BRAF mutations in nevi. Nat. Genet. 33, 19–20 (2003). [DOI] [PubMed] [Google Scholar]
- 12.Cancer Genome Atlas Network. Genomic Classification of Cutaneous Melanoma. Cell 161, 1681–1696 (2015). [DOI] [PMC free article] [PubMed] [Google Scholar]
- 13.Hu X et al. TumorFusions: an integrative resource for cancer-associated transcript fusions. Nucleic Acids Res. 46, D1144–D1149 (2018). [DOI] [PMC free article] [PubMed] [Google Scholar]
- 14.Hayward NK et al. Whole-genome landscapes of major melanoma subtypes. Nature 545, 175–180 (2017). [DOI] [PubMed] [Google Scholar]
- 15.Forbes SA et al. COSMIC (the Catalogue of Somatic Mutations in Cancer): a resource to investigate acquired mutations in human cancer. Nucleic Acids Res 38, D652–657 (2010). [DOI] [PMC free article] [PubMed] [Google Scholar]
- 16.Cerami E et al. The cBio cancer genomics portal: an open platform for exploring multidimensional cancer genomics data. Cancer Discov 2, 401–404 (2012). [DOI] [PMC free article] [PubMed] [Google Scholar]
- 17.Gutman DA et al. The Digital Slide Archive: A Software Platform for Management, Integration, and Analysis of Histology for Cancer Research. Cancer Res. 77, e75–e78 (2017). [DOI] [PMC free article] [PubMed] [Google Scholar]
- 18.Liang WS et al. Integrated genomic analyses reveal frequent TERT aberrations in acral melanoma. Genome Res. 27, 524–532 (2017). [DOI] [PMC free article] [PubMed] [Google Scholar]
- 19.Gruosso T et al. MAP3K8/TPL-2/COT is a potential predictive marker for MEK inhibitor treatment in high-grade serous ovarian carcinomas. Nat Commun 6, 8583 (2015). [DOI] [PMC free article] [PubMed] [Google Scholar]
- 20.Sourvinos G, Tsatsanis C & Spandidos DA Overexpression of the Tpl-2/Cot oncogene in human breast cancer. Oncogene 18, 4968–4973 (1999). [DOI] [PubMed] [Google Scholar]
- 21.Clark AM, Reynolds SH, Anderson M & Wiest JS Mutational activation of the MAP3K8 protooncogene in lung cancer. Genes Chromosomes Cancer 41, 99–108 (2004). [DOI] [PMC free article] [PubMed] [Google Scholar]
- 22.Lee J-H et al. TPL2 Is an Oncogenic Driver in Keratocanthoma and Squamous Cell Carcinoma. Cancer Res 76, 6712–6722 (2016). [DOI] [PubMed] [Google Scholar]
- 23.Ceci JD et al. Tpl-2 is an oncogenic kinase that is activated by carboxy-terminal truncation. Genes Dev. 11, 688–700 (1997). [DOI] [PubMed] [Google Scholar]
- 24.Patriotis C, Makris A, Bear SE & Tsichlis PN Tumor progression locus 2 (Tpl-2) encodes a protein kinase involved in the progression of rodent T-cell lymphomas and in T-cell activation. Proc. Natl. Acad. Sci. U.S.A. 90, 2251–2255 (1993). [DOI] [PMC free article] [PubMed] [Google Scholar]
- 25.Erny KM, Peli J, Lambert JF, Muller V & Diggelmann H Involvement of the Tpl-2/cot oncogene in MMTV tumorigenesis. Oncogene 13, 2015–2020 (1996). [PubMed] [Google Scholar]
- 26.Poulikakos PI & Solit DB Resistance to MEK Inhibitors: Should We Co-Target Upstream? Sci. Signal. 4, pe16 (2011). [DOI] [PubMed] [Google Scholar]
- 27.Samatar AA & Poulikakos PI Targeting RAS-ERK signalling in cancer: promises and challenges. Nat Rev Drug Discov 13, 928–942 (2014). [DOI] [PubMed] [Google Scholar]
- 28.Kim KB et al. Phase II study of the MEK1/MEK2 inhibitor Trametinib in patients with metastatic BRAF-mutant cutaneous melanoma previously treated with or without a BRAF inhibitor. J. Clin. Oncol. 31, 482–489 (2013). [DOI] [PMC free article] [PubMed] [Google Scholar]
- 29.Flaherty KT et al. Improved survival with MEK inhibition in BRAF-mutated melanoma. N. Engl. J. Med. 367, 107–114 (2012). [DOI] [PubMed] [Google Scholar]
- 30.Ascierto PA et al. MEK162 for patients with advanced melanoma harbouring NRAS or Val600 BRAF mutations: a non-randomised, open-label phase 2 study. Lancet Oncol. 14, 249–256 (2013). [DOI] [PubMed] [Google Scholar]
- 31.Ranzani M et al. BRAF/NRAS wild-type melanoma, NF1 status and sensitivity to trametinib. Pigment Cell Melanoma Res 28, 117–119 (2015). [DOI] [PMC free article] [PubMed] [Google Scholar]
- 32.Zhou X et al. Exploring genomic alteration in pediatric cancer using ProteinPaint. Nat. Genet. 48, 4–6 (2016). [DOI] [PMC free article] [PubMed] [Google Scholar]
- 33.Robinson JT et al. Integrative genomics viewer. Nat Biotech 29, 24–26 (2011). [DOI] [PMC free article] [PubMed] [Google Scholar]
METHODS ONLY REFERENCES
- 34.Lee S et al. TERT Promoter Mutations Are Predictive of Aggressive Clinical Behavior in Patients with Spitzoid Melanocytic Neoplasms. Sci Rep 5, 11200 (2015). [DOI] [PMC free article] [PubMed] [Google Scholar]
- 35.Rusch M et al. Clinical cancer genomic profiling by three-platform sequencing of whole genome, whole exome and transcriptome. Nature Communications 9, 3962 (2018). [DOI] [PMC free article] [PubMed] [Google Scholar]
- 36.Wu G et al. The genomic landscape of diffuse intrinsic pontine glioma and pediatric non-brainstem high-grade glioma. Nat. Genet. 46, 444–450 (2014). [DOI] [PMC free article] [PubMed] [Google Scholar]
- 37.Roberts KG et al. Targetable kinase-activating lesions in Ph-like acute lymphoblastic leukemia. N. Engl. J. Med. 371, 1005–1015 (2014). [DOI] [PMC free article] [PubMed] [Google Scholar]
- 38.Anders S, Pyl PT & Huber W HTSeq--a Python framework to work with high-throughput sequencing data. Bioinformatics 31, 166–169 (2015). [DOI] [PMC free article] [PubMed] [Google Scholar]
- 39.Blokzijl F, Janssen R, Boxtel R. van & Cuppen E MutationalPatterns: comprehensive genome-wide analysis of mutational processes. bioRxiv 071761 (2017). doi: 10.1101/071761 [DOI] [PMC free article] [PubMed] [Google Scholar]
- 40.McPherson A et al. deFuse: an algorithm for gene fusion discovery in tumor RNA-Seq data. PLoS Comput. Biol. 7, e1001138 (2011). [DOI] [PMC free article] [PubMed] [Google Scholar]
- 41.Seynnaeve B et al. Genetic and Epigenetic Alterations of TERT Are Associated with Inferior Outcome in Adolescent and Young Adult Patients with Melanoma. Sci Rep 7, 45704 (2017). [DOI] [PMC free article] [PubMed] [Google Scholar]
- 42.Borowicz S et al. The soft agar colony formation assay. J Vis Exp e51998 (2014). doi: 10.3791/51998 [DOI] [PMC free article] [PubMed] [Google Scholar]
- 43.Chen X et al. CONSERTING: integrating copy-number analysis with structural-variation detection. Nat. Methods 12, 527–530 (2015). [DOI] [PMC free article] [PubMed] [Google Scholar]
- 44.Dinkel H et al. ELM 2016--data update and new functionality of the eukaryotic linear motif resource. Nucleic Acids Res. 44, D294–300 (2016). [DOI] [PMC free article] [PubMed] [Google Scholar]
- 45.Sharrocks AD, Yang SH & Galanis A Docking domains and substrate-specificity determination for MAP kinases. Trends Biochem. Sci. 25, 448–453 (2000). [DOI] [PubMed] [Google Scholar]
Associated Data
This section collects any data citations, data availability statements, or supplementary materials included in this article.
Supplementary Materials
Data Availability Statement
The raw WGS, exome and RNA-Seq dataset generated for the index patient are available in St. Jude Cloud, https://platform.stjude.cloud/requests/publications?publication_accession=SJC-PB-1018 and have also been deposited in EGA under accession number EGAS00001003430. RNA-Seq data from archival samples are available from the authors upon reasonable request and with permission from the St. Jude Children’s Research Hospital IRB.