Abstract
Background
Pancreatic cancer (PC) is highly malignant. Chemotherapy is the main treatment strategy, especially for patients with advanced PC. However, chemoresistance has always been a frequently encountered bottleneck. Hence, there is an urgent need to enhance the sensitivity of PC to gemcitabine (GEM).
Results
We demonstrated that SH3BP5-AS1 was significantly upregulated in GEM-resistant PC and predicted a poorer prognosis. SH3BP5-AS1 stability was regulated by ALKBH5/IGF2BP1-mediated m6A modification. Loss of SH3BP5-AS1 reduced PC cell migration and invasion and enhanced the sensitivity of PC to GEM, as confirmed by gain- and loss-of-function assays in vitro and in vivo. Bioinformatics analysis revealed that SH3BP5-AS1 acted as a ceRNA against miR-139-5p and directly targeted CTBP1, affecting the biological behavior of PC cells. The mechanistic studies revealed that the upregulation of SH3BP5-AS1 increased CTBP1 expression by directly activating the Wnt signaling pathway, promoting GEM resistance.
Conclusions
This study revealed that SH3BP5-AS1 activated Wnt signaling pathway by sponging miR-139-5p, upregulating CTBP1 expression, and contributing to the sensitivity of PC cells to GEM. SH3BP5-AS1 might be a potential target for PC therapy.
Supplementary Information
The online version contains supplementary material available at 10.1186/s13062-022-00347-5.
Keywords: SH3BP5-AS1, N6-methyladenosine, Pancreatic cancer, Chemoresistance, Wnt signaling pathway
Background
Pancreatic cancer (PC) is highly malignant and is characterized by high recurrence rates and low resection rates. Its 5-year survival rate is only 9% [1]. The incidence rate of PC is increasing yearly. In 2018, the number of newly diagnosed cases of PC worldwide was similar to the number of deaths in the same year [2]. Currently, surgical resection combined with adjuvant chemotherapy is the standard treatment. Chemotherapy is the main treatment, especially for patients with advanced PC. Gemcitabine (GEM) is a first-line chemotherapy drug approved for the treatment of advanced PC, either alone or in combination with other chemotherapeutic agents [3]. Although in recent clinical trial combinations of GEM with other drugs resulted in relative improvements in median survival time, PC cells are less sensitive to GEM, resulting in unsatisfactory chemotherapy effects, owing to natural and/or acquired resistance to GEM [4]. Hence, there is an urgent need to enhance the sensitivity of PC to GEM. Therefore, it is important to explore the mechanisms underlying chemoresistance in PC and to optimize GEM formulations and medication regimens.
Long non-coding RNA (lncRNA) has been found to be involved in tumor chemoresistance in different pathways. LncRNAs PVT1, GSTM3TV2, and LINC00346 have been confirmed to promote GEM resistance in PC by competitively binding downstream genes [5–7]. All these studies indicated that lncRNAs were closely related to the chemoresistance of tumors. In this study, a patient-derived xenograft (PDX) model was used and genome sequencing was conducted. We found that the expression of SH3BP5-AS1 was positively correlated to the GEM resistance of PC, indicating an important role of SH3BP5-AS1 in the resistance of PC to GEM. Lina et al. found that the expression of SH3BP5-AS1 was upregulated in recurrent neuroblastoma and head and neck cancer [8, 9]. At present, few reports on SH3BP5-AS1 are available, and the role of LncRNA SH3BP5-AS1 in PC, including the causes for its abnormal expression in PC and the mechanism by which it affects the sensitivity to GEM, remains to be elucidated. In this study, We found that SH3BP5-AS1 could regulate CTBP1 in pancreatic cancer. CTBP1 was one member of the C-terminal binding proteins (CTBP) family which are identified to perform diverse functions in both developmental and oncogenic processes [10]. The abnormal function of CTBP were proved to be closely related to epithelial-mesenchymal transition (EMT), and cell apoptosis [11, 12]. However, CTBP has been little studied in pancreatic cancer, and the mechanism of its regulation is still unclear.
The N6-methyladenosine (m6A) modification has been confirmed to affect RNA stability, thereby affecting gene expression. In recent years, a large number of studies on m6A modifications of lncRNAs regulating tumor activity have been published. The m6A modification mainly occurs on the adenine residue in the RRACH sequence. Its functions are mainly characterized as “writer,” “eraser,” and “reader.” First, lncRNA is modified by a methylase “writer” (METTL3/14, WTAP, etc.) or a demethylase “eraser” (ALKBH5/FTO). Then it is recognized by a “reader” (YTHDF1/2/3, IGF2BP1, etc.) for stabilization or degradation [13]. In this study, we found that the expression level of lncRNA SH3BP5-AS1 is regulated by m6A modification, and its abnormal expression affects the sensitivity of PC to GEM. We further explored the potential effects of SH3BP5-AS1 on GEM resistance of PC and attempted to reduce GEM resistance of PC cells by regulating SH3BP5-AS1. We provide an experimental basis for the development of targeted drugs that enhance GEM sensitivity.
Results
SH3BP5-AS1 was upregulated in GEM-treated PDX pancreatic cancer
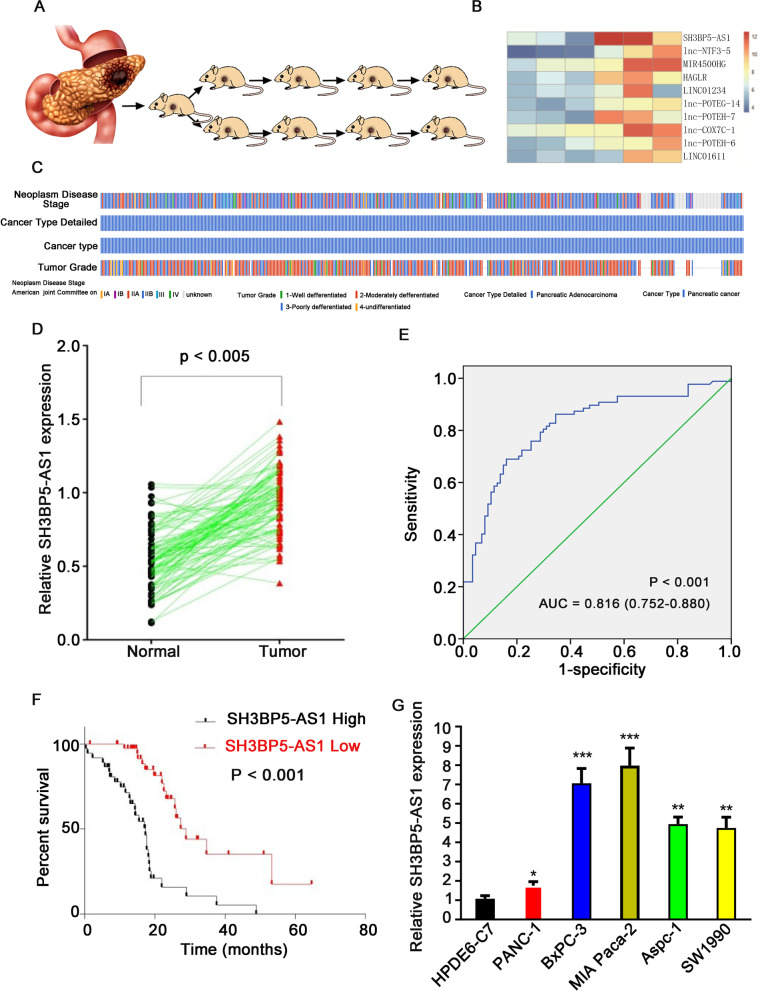
To explore the mechanism of GEM resistance in PC, we first established a PDX model, which was treated with either saline or GEM (Fig. 1A). We performed genomic sequencing of p4-pdx treated with GEM or the negative control to screen for hub genes. The top 10 differentially expressed lncRNAs are shown in Fig. 1B. The role of SH3BP5-AS1, one of the most strongly upregulated lncRNAs, in PC tumorigenesis and chemosensitivity was further investigated. The TCGA database suggested that SH3BP5-AS1 is closely related to the tumor grade of PC (Fig. 1C). Analysis of the correlation between SH3BP5 expression and clinicopathological data revealed that high SH3BP5-AS1 expression was closely related to tumor TNM stage, tumor size, and degree of differentiation in our center (Table 1). SH3BP5-AS1 expression was measured in 87 pair-matched PC tumor and adjacent normal tissues by RT-qPCR, and the results suggested that SH3BP5-AS1 was significantly upregulated in tumor tissue compared to normal tissue (Fig. 1D). ROC curve analysis revealed that it was an independent risk factor for the prognosis of PC (Fig. 1E). The survival of patients with low SH3BP5-AS1 expression was significantly better than that of patients with high SH3BP5-AS1 expression (Fig. 1F). At the same time, the expression levels of SH3BP5-AS1 in five PC cell lines and normal pancreatic cells were detected in vitro. SH3BP5-AS1 expression was significantly higher in PC cells than in normal pancreatic cells (Fig. 1G). Collectively, the above results demonstrated that SH3BP5-AS1 plays a key role in PC tumorigenicity and might serve as a key regulator of GEM resistance.
Fig. 1.
SH3BP5-AS1 was upregulated in GEM-treated PDX pancreatic cancer and its upregulation was negatively correlated with overall survival. A Establishment of the PDX pancreatic cancer model and experimental workflow of GEM treatment. B Heatmap displaying the top 10 upregulated lncRNAs in GEM-treated and control PDX mice. C Correlation analysis of SH3BP5-AS1 and clinicopathological features based on the TCGA database. D SH3BP5-AS1 was upregulated in pancreatic cancer tumor tissues compared with the paired adjacent tissues, as revealed by RT-qPCR. E SH3BP5-AS1 is an independent risk factor for the prognosis of pancreatic cancer, as revealed by ROC curve analysis. F Upregulation of SH3BP5-AS1 was correlated with poor overall survival. G SH3BP5-AS1 expression was significantly higher in pancreatic cancer cells compared with HPDE6-C7 cells. Data are shown as the mean ± SD. *P < 0.05; **P < 0.01
Table 1.
Relationship between SH3BP5-AS1 expression and clinicopathological parameters in 87 PC patients
| Variables | All cases | SH3BP5-AS1 expression | P | |
|---|---|---|---|---|
| Low (n = 31) | High (n = 56) | |||
| Age (years) | ||||
| < 50 | 40 | 14 | 26 | 0.910 |
| ≥ 50 | 47 | 17 | 30 | |
| Gender | ||||
| Male | 59 | 22 | 37 | 0.640 |
| Female | 28 | 9 | 19 | |
| Alcohol history | ||||
| No | 41 | 14 | 27 | 0.785 |
| Yes | 46 | 17 | 29 | |
| Smoking | ||||
| No | 37 | 12 | 25 | 0.592 |
| Yes | 50 | 19 | 31 | |
| CEA | ||||
| Normal | 17 | 9 | 8 | 0.097 |
| High | 70 | 22 | 48 | |
| CA199 | ||||
| Normal | 26 | 12 | 14 | 0.181 |
| High | 61 | 19 | 42 | |
| Tumor size (cm) | ||||
| < 4 | 52 | 23 | 29 | 0.041* |
| ≥ 4 | 35 | 8 | 27 | |
| TNM stage | ||||
| I-II | 31 | 16 | 15 | 0.02* |
| III-IV | 56 | 15 | 41 | |
| Lymph node invasion | ||||
| Absent | 61 | 26 | 35 | 0.035* |
| Present | 26 | 5 | 21 | |
| Metastasis | ||||
| No | 40 | 19 | 21 | 0.034* |
| Yes | 47 | 12 | 35 | |
*P < 0.05
Abnormal expression of SH3BP5-AS1 was involved in the invasion, migration, and stemness of pancreatic cancer cells
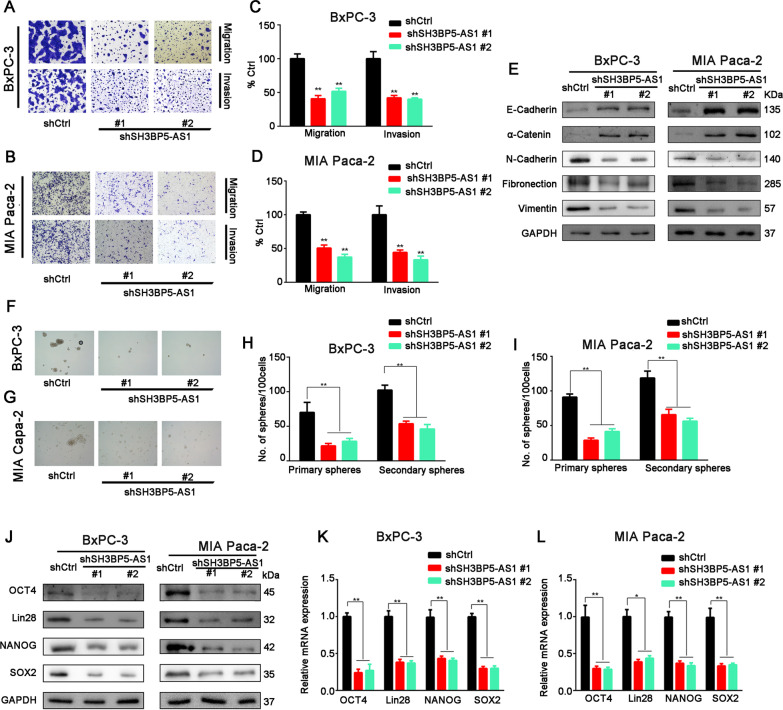
To further explore the effects of SH3BP5-AS1 on the biological behavior of PC cells, PC cells (BxPC3, MIA Paca-2, and PANC-1) were transfected with lentiviral vectors encoding SH3BP5-AS1 inserts or short hairpin RNA (shRNA) and Transwell and sphere formation assays were conducted. The transfection efficiency of shSH3BP5-AS1#1, shSH3BP5-AS1#2 and SH3BP5-AS1 overexpression plasmid was shown in Additional file 1: Fig. S1. After silencing SH3BP5-AS1, the invasion, migration, and sphere formation abilities of PC cells (BxPC3, MIA Paca-2) were significantly reduced (Fig. 2A–D and F–I). On the contrary, overexpression of SH3BP5-AS1 enhanced the above cellular behaviors (Additional file 1: Fig. S2A–E).
Fig. 2.
Silencing of SH3BP5-AS1 expression inhibited the invasion, migration, and stemness of pancreatic cancer cells in vitro. vivo. A, B Transwell assay revealed the migration and invasion abilities of BxPC-3 and MIA Paca-2 cells transfected with shCtrl or shSH3BP5-AS1. C, D Histogram displaying the statistical results of the Transwell assay. E EMT-related markers were detected by western blot. F–I Sphere formation analysis. J–L Stem cell-like cell markers Lin28, OCT4, NANOG, and SOX-2 were detected by western blot and RT-qPCR. Data are shown as the mean ± SD of three replicates. *P < 0.05; **P < 0.01
Epithelial-to-mesenchymal transition (EMT) has been proved to be closely related to cell invasion and migration [14]. Therefore, we also detected EMT-related proteins. The results showed that the epithelial markers E-cadherin and α-catenin were upregulated, whereas the levels of the mesenchymal markers N-cadherin, fibronectin, and vimentin were decreased when SH3BP5-AS1 was silenced (Fig. 2E). The opposite results were obtained when SH3BP5-AS1 was overexpressed in PC cells (Additional file 1: Fig. S2C). Stem cell-like cell markers Lin28, OCT4, NANOG, and SOX-2 have been found to be related to cell stemness [15], and these proteins and mRNA were significantly downregulated when SH3BP5-AS1 was silenced and upregulated when SH3BP5-AS1 was overexpressed (Fig. 2J-L, Additional file 1: Fig. S2F and G). These findings suggested that SH3BP5-AS1 stimulates PC cell migration, invasion, and stemness.
SH3BP5-AS1 promotes pancreatic cancer cell resistance to gemcitabine in vitro and in vivo
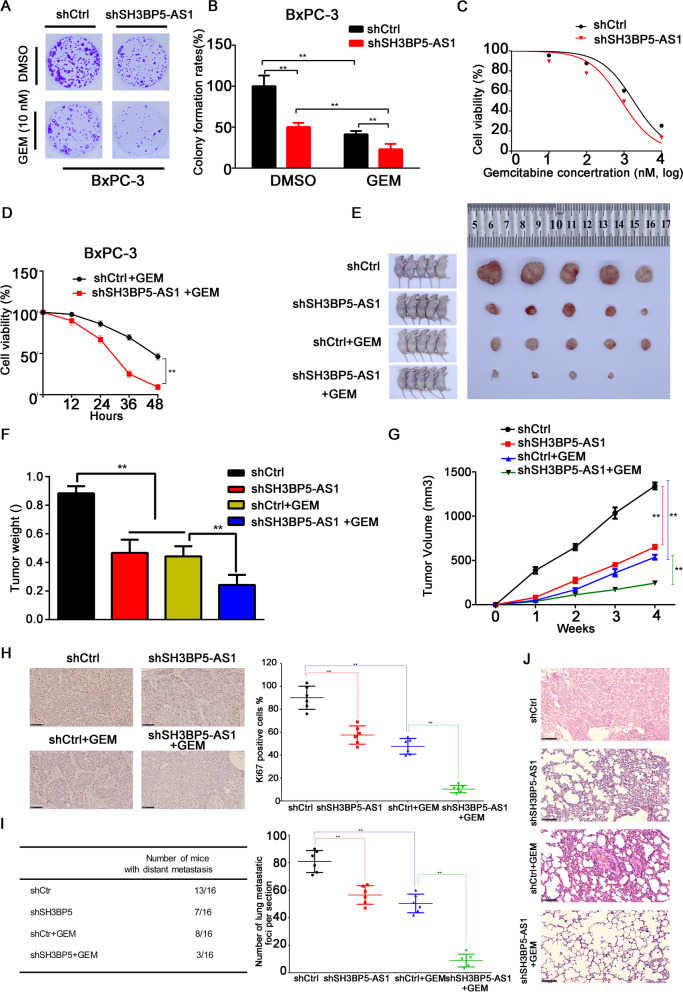
These above results strongly supported the notion that SH3BP5-AS1 is involved in PC carcinogenicity; however, whether SH3BP5-AS1 affects GEM chemoresistance in PC still remained to be elucidated. First, lentiviral vectors encoding SH3BP5-AS1 inserts or shRNA were transfected into BxPC3 and MIA Paca-2 cells. Then the cells were treated with GEM or DMSO for 72 h. We found that the PC cell proliferation ability was significantly reduced when SH3BP5-AS1 was silenced compared to the negative control group (Fig. 3A and B, Additional file 1: Fig. S3A and B). Moreover, SH3BP5-AS1 silencing enhanced the inhibitory effect of GEM on PC cells (Additional file 1: Fig. S3E and F). To corroborate the above results, cell viability was tested after exposing the cells to different GEM concentrations for 48 h. The results showed that silencing of SH3BP5-AS1 enhanced the sensitivity of PC cells to GEM. Compared with the control group, the IC50 value of GEM was significantly decreased in the SH3BP5-AS1 silencing group (Fig. 3C, Additional file 1: Fig. S3C). On the contrary, after overexpression of SH3BP5-AS1, the sensitivity of the PC cell line PANC-1 to GEM was significantly reduced (Additional file 1: Fig. S3E–H). Furthermore, we found that silencing of SH3BP5-AS1 reduced the viability of GEM-treated PC cells in a time-dependent manner (Fig. 3D, Additional file 1: Fig. S3D).
Fig. 3.
Upregulation of SH3BP5-AS1 promotes pancreatic cancer cell resistance to gemcitabine in vitro and in vivo. A, B Colony formation in BxPC-3 cells transfected with shCtrl or shSH3BP5-AS1 and treated with DMSO or GEM. C BxPC-3 cells with stable silencing of SH3BP5-AS1 were treated with GEM at different concentrations for 48 h. Cell viability was measured by MTT assay. D Stable SH3BP5-AS1-silenced BxPC-3 cells were treated with GEM (1 μM) for 48 h. Cell viability was measured by MTT assay at different timepoints. E Representative images of the xenograft tumors of BxPC-3 cells with stable SH3BP5-AS1 silencing in nude mice following GEM or saline treatment. F, G Histograms displaying the tumor weight and volume. H Ki67 expression in BxPC-3 cells with stable SH3BP5-AS1 silencing in nude mice after GEM or saline treatment. I Table summarizing the results of lung metastasis. J Representative images of H&E staining of the xenograft tumors. Data are shown as the mean ± SD. *P < 0.05; **P < 0.01
We further explored the effects of SH3BP5-AS1 on the sensitivity of PC to GEM through in vivo experiments. Stably silenced SH3BP5-AS1 PC cell lines and control cell lines were injected subcutaneously and via the tail vein, and the mice received 50 mg/kg GEM or saline. After 4 weeks, a significantly lower tumor volume and weight were observed in the SH3BP5-AS1 silencing group, after treatment with either GEM or saline, especially in the GEM treatment group (Fig. 3E–G). The Ki67 immunostaining results suggested that silencing of SH3BP5-AS1 inhibits proliferation and enhances GEM sensitivity of PC cells (Fig. 3H). In the lung metastasis model, we found that silencing of SH3BP5-AS1 significantly reduced the distant metastasis of the tumor (7/16) compared with the control group (13/16). Interestingly, compared with the GEM treatment group, silencing of SH3BP5-AS1 can significantly improve the efficacy of GEM, which reduced the lung metastasis rate and the number of lung metastases (Fig. 3I and J). The above results suggested that SH3BP5-AS1 silencing enhanced the sensitivity of PC cells to GEM both in vitro and in vivo.
ALKBH5/IGF2BP1-mediated m6A modification contributed to SH3BP5-AS1 overexpression
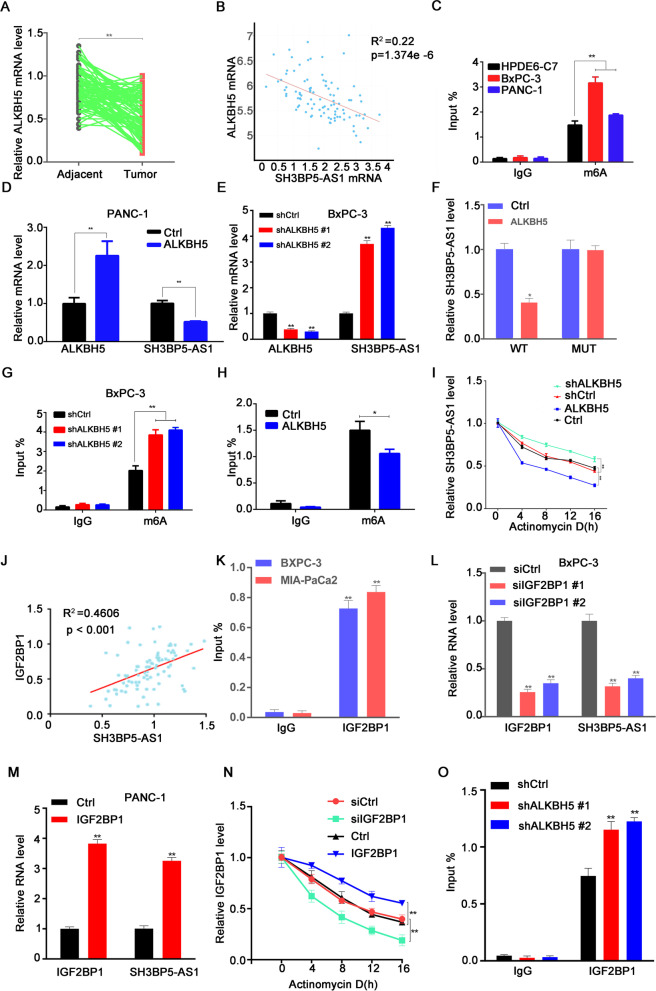
m6A modification has been confirmed to be involved in the regulation of RNA expression [16]. m6A modifications are placed and removed by methylases and demethylases, respectively. ALKBH5, a demethylase, is well known to be involved in the occurrence and development of various cancers [17–19]. In this study, we found that ALKBH5 was significantly downregulated in tumor tissues compared to the adjacent tissues (Fig. 4A), and its expression was negatively correlated with SH3BP5-AS1 levels in tumor tissues (Fig. 4B). m6A RIP results showed that m6A levels in PC cell lines (BxPC-3 and PANC-1) were significantly higher than in normal pancreatic cells (HPDE6-C7) (Fig. 4C). The in vitro results also revealed that SH3BP5-AS1 was significantly downregulated while ALKBH5 was overexpressed; on the contrary, SH3BP5-AS1 upregulation was observed after ALKBH5 was silenced (Fig. 4D and E). The dual luciferase report assay indicated that ALKBH5 could attenuate luciferase activity in the wild-type SH3BP5-AS1 group; however, luciferase activity was not affected in the mutant SH3BP5-AS1 group (Fig. 4F). MeRIP assays showed that ALKBH5 silencing increased the m6A modification level of SH3BP5-AS1 (Fig. 4G), whereas overexpression of ALKBH5 decreased the m6A modification level of SH3BP5-AS1 in PC cells (Fig. 4H). The actinomycin D assay (a drug that blocks de novo RNA synthesis) showed that ALKBH5 promoted SH3BPH5-AS1 degradation, while silencing of ALKBH5 contributed to the stability of SH3BP5-AS1 (Fig. 4I). Collectively, ALKBH5 acted as an important “eraser” in regulating SH3BP5-AS1. However, an “eraser” cannot regulate SH3BP5-AS1 expression alone; it also requires a “reader.” Studies have found that ALKBH5-mediated m6A demethylation inhibited mRNA transcription by the m6A effector IGF2BP1 [18, 20]. Our correlation analysis revealed that IGF2BP1 expression was positively correlated with SH3BP5-AS1 levels (Fig. 4J). We hypothesized that IGF2BP1 acted as a “reader” for the regulation of SH3BP5-AS1. To confirm the above hypothesis, the RIP assay was performed to affirm the direct binding between IGF2BP1 and SH3BP5-AS1 (Fig. 4K). SH3BP5-AS1 expression was significantly decreased after IGF2BP1 silencing and increased after IGF2BP1 overexpression (Fig. 4L and M). The results of our actinomycin D assay confirmed the above conclusion (Fig. 4N). Then an RIP assay was conducted to explore the correlation between the “eraser” ALKBH5 and the “reader” IGF2BP1. The results suggested that IGF2BP1 expression was negatively correlated with ALKBH5 levels (Fig. 4O). In conclusion, low expression of the “eraser” ALKBH5 maintains a high m6A modification level of SH3BP5-AS1, which further promotes the recognition of m6A-SH3BP5-AS1 by the “reader” IGF2BP1.
Fig. 4.
ALKBH5/IGF2BP1-mediated m6A modification contributed to SH3BP5-AS1 overexpression. A ALKBH5 was downregulated in pancreatic cancer tumor tissues compared with the paired adjacent tissues, as revealed by RT-qPCR. B The negative correlation between the levels of ALKBH5 and SH3BP5-AS1 was confirmed using the TCGA database. C The RIP RT-qPCR assay revealed that m6A modification of SH3BP5-AS1 was mainly enriched in pancreatic cancer cells (BxPC-3, PANC-1) compared with HPDE6-C7. D, E The expression level of SH3BP5-AS1when ALKBH5 was overexpressed or silenced. F The relationship between ALKBH5 and SH3BP5-AS1 was confirmed by the luciferase reporter assay. G, H RIP RT-qPCR results showing the m6A modification level of SH3BP5-AS1 when ALKBH5 was overexpressed or silenced. I SH3BP5-AS1 stability analysis in BxPC-3 cells with ALKBH5 overexpression or knockdown in the presence of actinomycin D. J The negative correlation between the levels of IGF2BP1 and SH3BP5-AS1 in pancreatic cancer cells. K The enrichment of IGF2BP1 on SH3BP5-AS1 in pancreatic cancer cells was analyzed by RIP RT-qPCR assay. L, M The expression level of SH3BP5-AS1 when IGF2BP1 was overexpressed or knocked down. N Actinomycin D assays showing the effects of ALKBH5 overexpression or knockdown on IGF2BP1 stability. O RIP RT-qPCR assay results showing the enrichment of IGF2BP1 on SH3BP5-AS1 upon ALKBH5 silencing. Data are shown as the mean ± SD. *P < 0.05; **P < 0.01
miR-139-5p is involved in the oncogenic roles of SH3BP5-AS1 in PC
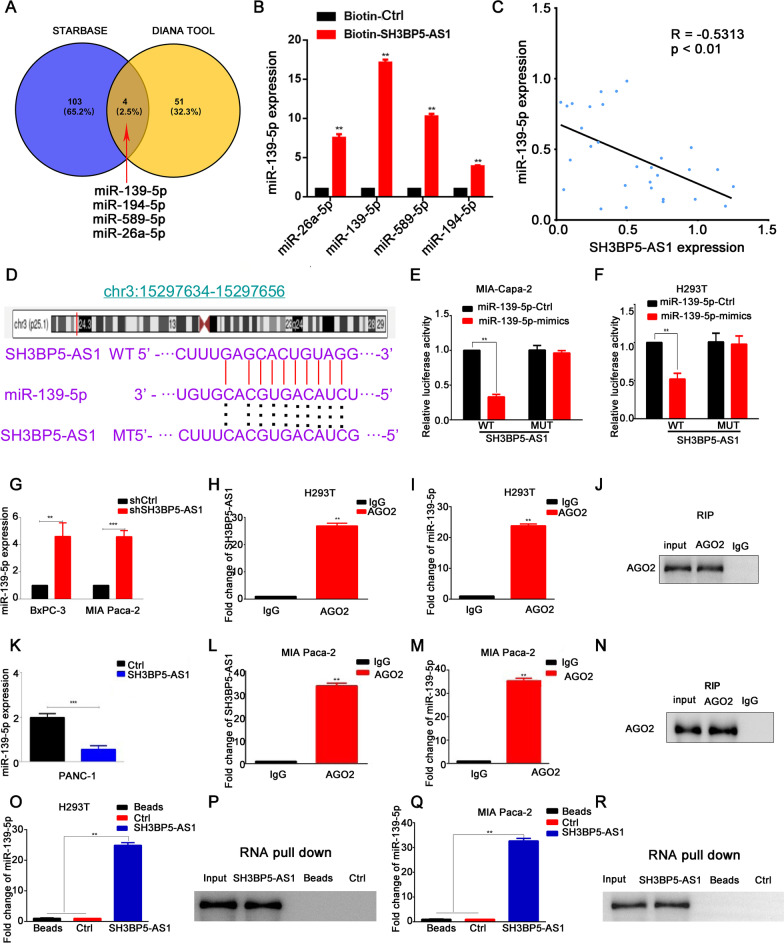
It has been reported that lncRNAs exert carcinogenic effects through acting as ceRNAs [21–23]. Here, we explored whether this is also the case for SH3BP5-AS1. First, Combined with the public database ENCORI, previously known as starBase v2.0, and the DIANA Tool, miRNA-194-5p, miRNA-589-5p, miRNA-26a-5p and miRNA-139-5p were predicted to be a target miRNA of SH3BP5-AS1 (Fig. 5A). Furthermore, RNA pulldown assay was performed to prove miRNA-139-5p was the most enriched in the precipitate of SH3BP5-AS1 than other miRNA candidates (Fig. 5B). Therefore, miRNA-139-5p was selected for follow-up study. RT-qPCR was performed to further prove the interaction between miRNA-139-5p and SH3BP5-AS1. The results suggested that SH3BP5-AS1 expression is negatively correlated with miRNA-139-5p levels (Fig. 5C). The results of our luciferase assays confirmed that in both H293T and PC cells, miR139-5p significantly decreased the luciferase activity of wild-type SH3BP5-AS1 but did not affect that of mutant SH3BP5-AS1 (Fig. 5D–F). Furthermore, silencing of SH3BP5-AS1 can significantly upregulate the expression of miR139-5p, whereas the opposite results were obtained after SH3BP5-AS1 overexpression (Fig. 5G and K). The above results indicated that SH3BP5-AS1 might sponge miR139-5p, thereby affecting downstream target genes. The relationship was verified by RIP assay. We found that both SH3BP5-AS1 and miR139-5p were enriched in AGO2 precipitate (Fig. 5H–J, L–N). The results of our RNA pull-down assays confirmed the above results. miR-139-5p and AGO2 were more strongly enriched in the biotin-labeled SH3BP5-AS1 group than in the control group (Fig. 5O–R). These results indicated that SH3BP5-AS1/miR-139-5P participate in the carcinogenic mechanism of PC.
Fig. 5.
miR-139-5p is involved in the oncogenic roles of SH3BP5-AS1 in pancreatic cancer. A Venn diagram showing the potential target miRNAs of SH3BP5-AS1 based on the public database ENCORI and the DIANA Tool. B RNA pulldown assay was performed to prove miRNA-139-5p was the most enriched in the precipitate of SH3BP5-AS1 than other miRNA candidates. C Correlation analysis of SH3BP5-AS1 and miRNA-139-5p. D Schematic diagram of the binding sites between SH3BP5-AS1 and miRNA-139-5p. E, F A dual luciferase reporter assay was conducted to determine the relative luciferase activities in pancreatic cancer cells following transfection with the indicated constructs. G miRNA-139-5p was overexpressed following silencing of SH3BP5-AS1 in BxPC-3 and MIA Paca-2 cells. H–J An RIP assay was conducted to evaluate the relative enrichment of SH3BP5-AS1 and miRNA-139-5p in anti-IgG- or anti-AGO2-specific immunoprecipitates in H293T cells. K miRNA-139-5p was downregulated following SH3BP5-AS1 overexpression in PANC-1 cells. L–N An RIP assay was conducted to evaluate the relative enrichment of SH3BP5-AS1 and miRNA-139-5p in anti-IgG- or anti-AGO2-specific immunoprecipitates in MIA Paca-2 cells. O–R An RNA pull-down assay was conducted to detect the interaction among LNCAROD, miR-145-5p, and AGO2 in H293T and MIA Paca-2 cells. Data are shown as the mean ± SD. *P < 0.05; **P < 0.01
To further explore the effect of SH3BP5-AS1/miRNA-139-5p on the biological behavior of PC and GEM resistance, first of all, Transwell and sphere formation assays proved that silencing of SH3BP5-AS1 could reduce the invasion, migration, and spheroidizing abilities of PC cells, while miRNA-139-5p inhibition could reverse the effect of shSH3BP5-AS1 on PC cells. On the contrary, overexpression of miRNA-139-5p could reverse the carcinogenic effects of SH3BP5-AS1 (Additional file 1: Fig. S4A–I). In the drug resistance intervention experiment, we found that miRNA-139-5p inhibition could reverse the effect of shSH3BP5-AS1 on GEM sensitivity of PC cells. Overexpression of miRNA-139-5p increased the sensitivity of PC cells to GEM. This further illustrates that SH3BP5-AS1 can affect the biological behavior and GEM resistance of PC cells through miRNA-139-5p (Additional file 1: Fig. S4J–O).
miR-139-5p sponging activity decreases CTBP1 levels, affecting the biological behavior of PC cells
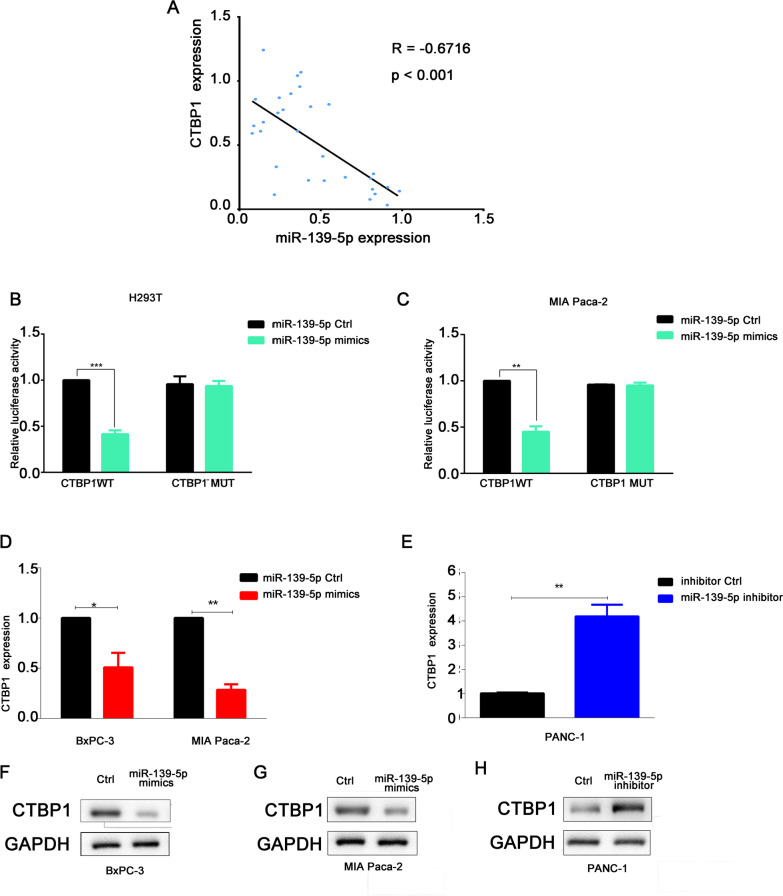
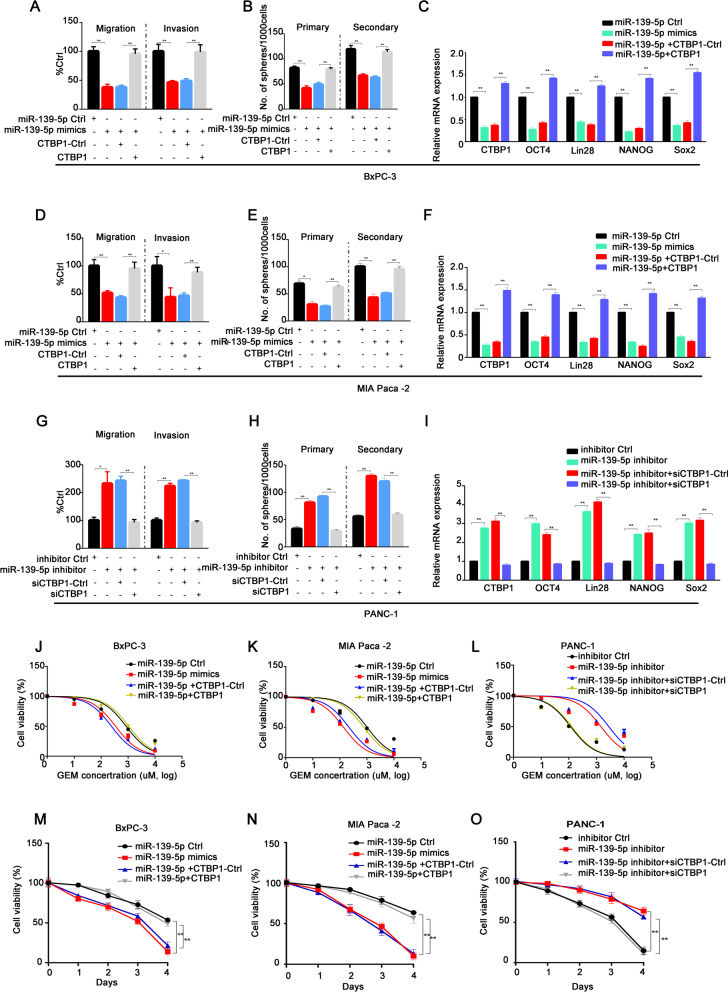
As shown above, miR-139-5p could inhibit the expression of downstream target genes by forming a RISC complex with AGO2. Transcriptome sequencing was used to further screen downstream target genes. As shown in Additional file 1: Fig. S5A and B, we found that CTBP1 was significantly downregulated when miR-139-5P was overexpressed. We conducted functional enrichment and signal pathway analyses of differentially expressed genes and found that genes, includi ng CTBP1, are mainly enriched in Wnt signaling (Additional file 1: Fig. S5C and D). Based on the miR-TARGET database to predict miRNA target genes, it was found that there were a total of 218 genes that could be regulated by miR-139-5p. Among the overlapping genes, the difference in CTBP1 expression is particularly obvious (Additional file 1: Fig. S5E), indicating that CTBP1 might be a hub gene downstream of miR-139-5p. To prove this hypothesis, first, correlation analysis was conducted, and it was found that the expression of miR-139-5p was negatively correlated with CTBP1 levels (Fig. 6A). Then a luciferase assay confirmed that miRNA-139-5p could inhibit the fluorescence activity of wild-type CTBP1 without affecting the fluorescence activity of mutant CTBP1, confirming the regulatory relationship between miRNA-139-5p and CTBP1 (Fig. 6B and C). Overexpression of miR-139-5p downregulated CTBP1 mRNA and protein expression levels, while silencing of miR-139-5p upregulated CTBP1 mRNA and protein expression levels (Fig. 6D–H). All these results indicated that miR-139-5p has a targeted regulatory relationship with CTBP1. In the drug resistance study, we co-transfected miR-139-5p mimics and CTBP1 overexpression plasmid into PC cells, which were subsequently treated with GEM. We found that CTBP1 could reverse the effects of miR-139-5p on PC cell invasion, migration, and GEM resistance (Fig. 7A–I). On the contrary, when miR-139-5p and CTBP1 were silenced at the same time, si-CTBP1 could significantly inhibit PC cell invasion and migration, stemness, and GEM resistance (Fig. 7J–O). Therefore, CTBP1 is an important molecule downstream of miR-139-5p, and miR-139-5p exerts tumorigenic effects by regulating CTBP1.
Fig. 6.
miR-139-5p negatively regulated the expression of the target gene CTBP1. A Correlation analysis of CTBP1 and miRNA-139-5p. B, C A dual luciferase reporter assay was conducted to determine the relative luciferase activities following the indicated transfections in H293T and MIA Paca-2 cells. D, E CTBP1 was downregulated following miRNA-139-5p overexpression in BxPC-3 and MIA Paca-2 cells and overexpressed following silencing of miRNA-139-5p in PANC-1 cells. F–H CTBP1 protein expression was detected following the indicated transfections in BxPC-3, MIA Paca-2, and PANC-1 cells. Data are shown as the mean ± SD. *P < 0.05; **P < 0.01
Fig. 7.
miR-139-5p sponging activity decreases CTBP1 levels, affecting the biological behavior of pancreatic cancer. A, B Transwell and Sphere formation assays were performed in BxPC-3 cells after co-transfection with miRNA-139-5p mimics and/or CTBP1 overexpression plasmid. C Stem cell-like cell markers Lin28, OCT4, NANOG, and SOX-2 were detected by western blot following the indicated transfections in BxPC-3 cells. D–E Transwell and Sphere formation assays were performed in MIA Paca-2 cells following the indicated transfections. F Stem cell-like cell markers Lin28, OCT4, NANOG, and SOX-2 were detected by western blot following the indicated transfections in MIA Paca-2 cells. G, H Transwell and Sphere formation assays were performed in PANC-1 cells after co-transfection with miRNA-139-5p-shRNA and CTBP1-shRNA. I Stem cell-like cell markers Lin28, OCT4, NANOG, and SOX-2 were detected by western blot following the indicated transfections in PANC-1 cells. J–L Pancreatic cancer cells with indicated transfections were treated with GEM at different concentrations for 48 h. Cell viability was measured by MTT assay. M–O Pancreatic cancer cells with indicated transfections were treated with GEM (1 μM) for 48 h. Cell viability was measured by MTT assay at different timepoints. Data are shown as the mean ± SD. *P < 0.05; **P < 0.01
SH3BP5-AS1 contributes to the effects of CTBP1 and increases tumor malignancy via the Wnt/β-catenin pathway
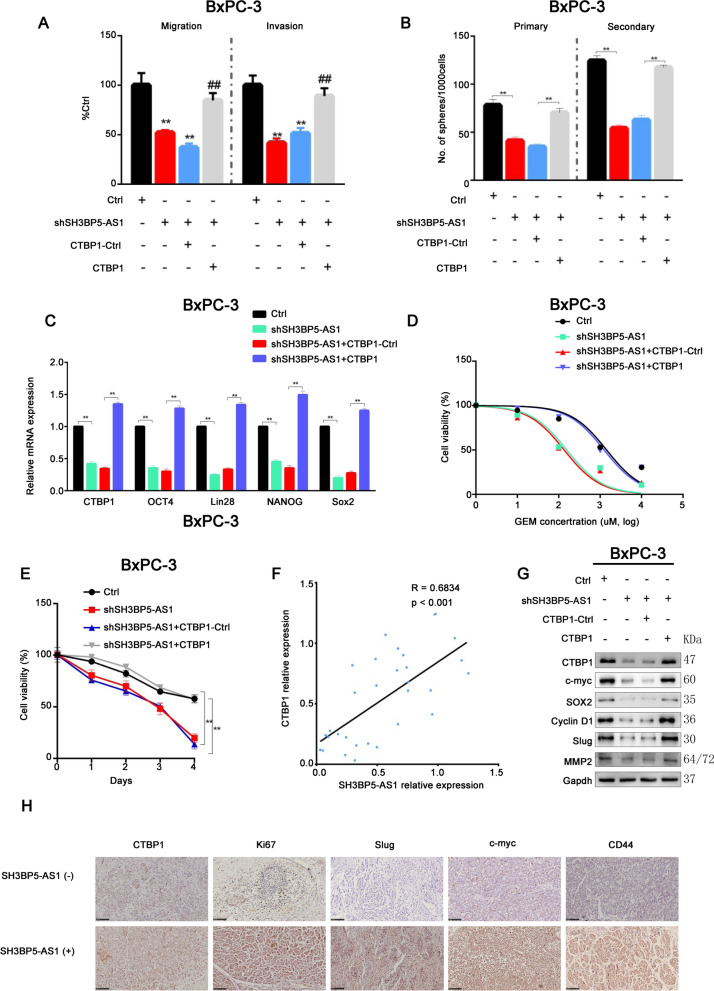
SH3BP5-AS1 participates in the GEM resistance of PC cells through a ceRNA mechanism, as confirmed in the above described experiments. When we further analyzed the regulatory relationship between SH3BP5-AS1 and CTBP1, we found that SH3BP5-AS1 silencing reduced cell invasion, migration, and stemness and enhanced GEM sensitivity in PC cells, whereas CTBP1 could reverse the abovementioned effects of sh-SH3BP5-AS1 (Fig. 8A–C, Additional file 1: Fig. S6A, C and E). Conversely, silencing of CTBP1 could significantly inhibit the biological effects of SH3BP5-AS1 overexpression on PC cells (Additional file 1: Fig. S6B, D and H). Similarly, CTBP1 restored the effects of sh-SH3BP5-AS1 on GEM sensitivity in PC cells, as observed in the drug sensitivity assay (Fig. 8D and E, Additional file 1: Fig. S6F and G). Further correlation analysis revealed that the expression of SH3BP5-AS1 was positive correlated with CTBP1 levels (Fig. 8F).
Fig. 8.
SH3BP5-AS1 contributes to CTBP1 expression and increases tumor malignancy via the Wnt/β-catenin pathway. A–B Transwell and Sphere formation assays were performed in BxPC-3 cells after co-transfection with SH3BP5-AS1-shRNA and/or CTBP1 overexpression plasmid. C Stem cell-like cell markers Lin28, OCT4, NANOG, and SOX-2 were detected by western blot following the indicated transfections in BxPC-3 cells. D BxPC-3 cells with indicated transfections were treated with GEM at different concentrations for 48 h. Cell viability was measured by MTT assay. E BxPC-3 cells with indicated transfections were treated with GEM (1 μM) for 48 h. Cell viability was measured by MTT assay at different timepoints. F Correlation analysis of CTBP1 and miRNA-139-5p. G The proteins of Wnt/β-catenin pathway were detected by western blot following the indicated transfections in BxPC-3 cells. H Proteins of the Wnt/β-catenin pathway were detected by IHC following the indicated transfections in BxPC-3 cells. Data are shown as the mean ± SD. *P < 0.05; **P < 0.01
According to our transcriptome sequencing results, the Wnt pathway might be an important signaling pathway for SH3BP5-AS1/miRNA-139-5p/CTBP1 to exert its effect. We further detected Wnt signaling pathway-related proteins through western blot and IHC and found that after silencing SH3BP5-AS1, the proteins of Wnt pathway were significantly down-regulated. When CTBP1 was overexpressed at the same time, the Wnt signaling pathway was activated (Fig. 8G and H, Additional file 1: Fig. S6K). Conversely, silencing of CTBP1 could significantly inhibit the effects of SH3BP5-AS1 on Wnt signaling pathway (Additional file 1: Fig. S6L). These results indicated that SH3BP5-AS1/miRNA-139-5p/CTBP1 might exert their biological functions via the Wnt signaling pathway.
Discussion
Chemoresistance has always been a frequently encountered bottleneck in the treatment of PC. Many studies on the effects of lncRNA on tumor chemoresistance and the underlying mechanisms have been conducted, aiming to find a marker with good specificity and sensitivity [6, 24, 25]. In this study, a PDX model combined with high-throughput sequencing was used to screen the key lncRNAs in PC chemoresistance. SH3BP5-AS1 is closely related to PC drug resistance. Only two studies have reported that SH3BP5-AS1 might be related to inflammation and the prognosis of head and neck tumors [9, 26]; however, the role of SH3BP5-AS1 has not been studied in PC. It is important to fully elucidate the mechanism of SH3BP5-AS1 in the drug resistance of PC. In this study, we found that high SH3BP5-AS1 expression promoted the invasion, migration, and stemness of PC cells and increased the resistance of PC cells to GEM. Furthermore, this study also revealed that SH3BP5-AS1 activates the Wnt signaling pathway through a ceRNA mechanism, which affects carcinogenesis and chemoresistance in PC (Fig. 9).
Fig. 9.
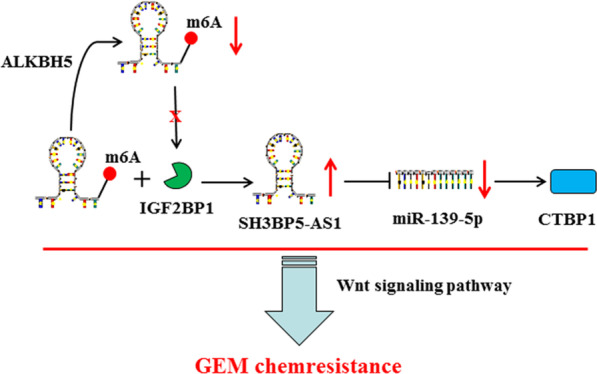
The schematic diagram of the carcinogenesis role of SH3BP5-AS1 in PC and its mechanism
More and more studies have shown that lncRNAs play important roles in the occurrence and development of malignant tumors including PC [6, 24, 27], This study found that the expression of SH3BP5-AS1 in PC (i) is significantly higher than that in normal pancreatic tissue and (ii) plays a role in promoting tumorigenesis. The results were also consistent with previous reports. For example, it has been reported that SH3BP5-AS1 (i) promotes the occurrence and development of head and neck cancer and (ii) is an independent risk factor for its prognosis [9]. In this study, correlation analysis of the clinicopathological characteristics and SH3BP5-AS1 expression suggested that high SH3BP5-AS1 expression is closely related to the TNM stage and poor prognosis of PC. This evidence proves the important role of SH3BP5-AS1 in PC. Moreover, we also found that SH3BP5-AS1 overexpression might be regulated by m6A modification. m6A modification has been confirmed to be involved in the regulation of gene stability. It participates in the occurrence of a variety of tumors by regulating RNA transcription, splicing, processing, translation, and degradation [28]. m6A modifications are established and removed by m6A methyltransferases (writers) or demethylases (erasers), respectively, and recognized by m6A-binding proteins (readers), which ultimately affects the expression levels of RNAs. There are many studies on the roles of m6A modification in PC. The results of this study suggested that the “eraser” ALKBH5 and the “reader” IGF2BP1 are involved in the regulation of SH3BP5-AS1 expression. ALKBH5 has been confirmed to be downregulated in PC, and low ALKBH5 expression promotes the occurrence and development of tumors [19, 29]. The clinical analyses of our center are consistent with previous reports. ALKBH5 expression was negatively correlated with SH3BP5-AS1 levels. Subsequent results confirmed that low ALKBH5 expression increased the level of SH3BP5-AS1 m6A modification, which is further recognized by the m6A recognition protein IGF2BP1, thereby promoting the expression of SH3BP5-AS1. This result also explains why SH3BP5-AS1 was highly expressed in PC. This is the first report of the regulatory mechanism of m6A modification of SH3BP5-AS1 in PC.
In this study, a new lncRNA, SH3BP5-AS1, affects GEM resistance in PC was discovered. A lack of SH3BP5-AS1 expression could enhance the sensitivity of PC cells to GEM. In vivo and in vitro experiments confirmed that SH3BP5-AS1 was involved in GEM resistance of PC. We hypothesized that it might exert different functions in different subcellular compartments. Our previous study confirmed that lncRNAs might exert their effects via both nuclear and cytoplasmic pathways [30]. Our experiments have proved that SH3BP5-AS1 is modified by m6A in the nucleus, leading to its high expression, and then part of SH3BP5-AS1 is transferred to the cytoplasm, further regulating miR-139-5p expression by the sponge effect. Our previous studies have confirmed that low expression of miR-139-5p promotes the occurrence and development of PC, and miR-139-5p has also been confirmed to participate in the drug resistance of tumors including non-small cell lung cancer, ovarian cancer, and colon cancer [24]. CTBP1, a downstream target gene of miR-139-5p, was screened by transcriptome sequencing in this study. CTBP1 has been reported to be involved in tumor chemoresistance [31]; its high expression led to the occurrence of EMT and promoted the invasion and migration of tumor cells [32]. The results of this study are consistent with the conclusions of the above studies. Our study revealed that high SH3BP5-AS1 expression further upregulated the expression of CTBP1 through downregulation of miR-139-5p, which ultimately led to GEM resistance in PC. However, whether SH3BP5-AS1 participates in other regulatory mechanisms in the nucleus has not been explored. Moreover, it remains to be elucidated whether SH3BP5-AS1 can directly regulate the expression of the downstream target gene CTBP1 and how SH3BP5-AS1 exerts its regulatory effects.
To explore the mechanisms by which the SH3BP5-AS1/miR-139-5p/CTBP1 axis affects GEM resistance in PC cells, high-throughput sequencing and signal pathway enrichment analysis were conducted. We found that when SH3BP5-AS1 competitively bound miR-139-5p via ceRNA to regulate the downstream gene CTBP1, it further regulated the Wnt signaling pathway. The Wnt signaling pathway has been confirmed to be involved in the tumorigenesis and drug resistance of a variety of tumors, including PC [24]. Studies have found that activation of the Wnt signaling pathway promotes the resistance of PC to GEM and the aggressiveness of tumors.
CTBP1 is an essential molecule in the Wnt signaling pathway, which could affect cell proliferation and cell survival [33, 34]. The above results partially explain how abnormal SH3BP5-AS1 expression affects GEM resistance in PC cells and reveal its downstream regulatory mechanism. SH3BP5-AS1 may serve as a treatment target to enhance the sensitivity of PC to GEM.
This study revealed that SH3BP5-AS1 activated Wnt signaling pathway by sponging miR-139-5p, upregulating CTBP1 expression, and contributing to the sensitivity of PC cells to GEM. SH3BP5-AS1 is expected to a potential target for PC therapy.
Conclusions
In summary, this study revealed that SH3BP5-AS1 activated Wnt signaling pathway by sponging miR-139-5p, upregulating CTBP1 expression, and contributing to the sensitivity of PC cells to GEM. SH3BP5-AS1 might be a potential target for PC therapy.
Methods
Clinical specimens
In total, 87 PC samples were collected from the First Affiliated Hospital of Fujian Medical University between 2008 and 2018. The clinicopathological characteristics including age, sex, alcohol history, smoking history, CEA, CA199, tumor size, tumor stage, lymph node invasion, and metastasis were recorded. We have obtained informed consent from all patients and this study was approved by the Ethics Committee of the First Affiliated Hospital of Fujian Medical University (Fujian, China).
Establishment of patient derived xenograft (PDX) model
The fresh tumor fragments were subcutaneously transplanted into the left flank of anaesthetized NOD scid gamma mice. Mice were observed for maximum 120 d and keep feeding under sterile and controlled conditions (22 °C, 50% relative humidity, 12 h light–dark cycle, autoclaved food and bedding, acidified drinking water). Subcutaneous tumor growth was measured in 2 dimensions using a caliper. Tumor volumes (TV) were determined by the formula: TV = (length x width2)/2. Tumors were routinely passaged when the TV approximately grow in 1 cm3. Xenograft material was snap frozen and stored at -80 °C or processed to formalin fixed, paraffin embedded (FFPE) blocks.
Cell culture
The human PC cell lines AsPC-1, CFPAC-1, Capan-1, SW1990, PANC-1, SW1990, BxPC-3, and MIA-PaCa-2 and the non-cancerous HPDE6C7 cell line were purchased from the American Type Culture Collection (ATCC; Manassas, VA, USA). Cells were cultured in Dulbecco’s modified Eagle’s medium (DMEM) supplemented with 10% fetal bovine serum (FBS) and 1% antibiotic/antifungal solution (Biowest, Nuaillé, France) in 5% CO2 at 37 °C in a humidified atmosphere.
Immunohistochemistry
Tissues were fixed with 10% formalin for about 48 h and paraffin-embedded for immunohistochemistry (IHC) assays. The protocol was previously described [10]. All antibodies and related reagents are shown in Additional file 1: Table S1.
Western blot
Proteins were extracted from homogenized tissues or cultured cells and quantified by using the BCA method, sample buffer was added, samples were heated, and proteins were separated by SDS-PAGE and transferred to a polyvinylidene fluoride membrane (Bio-Rad Laboratories, Hercules, CA, USA). The membrane was blocked in 5% skim milk for about 1 h and incubated with primary antibody (Additional file 1: Table S1) at 4 °C overnight. Then the membrane was washed and incubated with secondary antibody for 2 h, and after washing, protein bands were visualized using enhanced chemiluminescence (ECL) substrate and photographed. Relative expression levels of proteins were quantified by ImageJ software version 1.8.0 (National Institutes of Health, Bethesda, MD, USA).
Quantitative reverse-transcriptase PCR
Total RNA was isolated using TRIzol reagent (Invitrogen, Carlsbad, CA, USA) following the manufacturer’s instructions, and cDNA was synthesized with random primers (Additional file 1: Table S2) using a reverse transcription kit (TOYOBO, Japan) following the manufacturer’s instructions. qRT-PCR was performed using Fast Start Universal SYBR Green Master Mix (Roche Diagnostics GmbH, Mannheim, Germany). The RNA level was quantifified by using the 2−ΔΔCt method. All the primers that used in this study was showed in Additional file 1: Table S2.
Colony formation assay
Cells were cultured in 6-well plates (500 cells/well) for 14 days. Then, the colonies were fixed by methanol/acetic acid (3:1, v/v) and stained with 0.5% crystal violet (Sigma-Aldrich, St. Louis, MO, USA). The colonies were counted using a microscope (Olympus IX81).
Sphere formation assay
The Cells were inoculated in ultralow attachment six well plates (Corning) at a density of 1000 cells/well, and allow to culture for 1 week (Primary spheres) in DMEM/F12 medium (Invitrogen, Shanghai, China) supplemented with 20 ng/ml EGF (Sigma, Shanghai, China), B27 (1:50, GIBCO, Shanghai, China), and 20 ng/ml bFGF (Sigma, Shanghai, China). Subsequently, the primary spheres were collected, separated with trypsin and then seeded again to form secondary spheres. Finally, the number of the spheres was counted by using a microscope.
RNA immunoprecipitation assay
The RNA immunoprecipitation (RIP) assay was performed using a Magna RIP™ RNA-Binding Protein Immunoprecipitation Kit (Millipore, USA). Briefly, cell lysates were immunoprecipitated with beads conjugated with anti-AGO2 or anti-IgG at 4 °C for 6 h. Then, the immunoprecipitates were treated with 0.1% SDS/Proteinase K (0.5 mg/mL, 30 min at 55 °C), and immunoprecipitated RNAs were detected by qRT-PCR.
Methylated RNA immunoprecipitation qPCR
An miRNeasy kit (#217004, QIAGEN) was used for isolating the total RNA fraction. The GenElute mRNA Miniprep kit (MRN10, Sigma-Aldrich) was used for extracting mRNA from the total RNA fraction. Then, a Magna MeRIP m6A kit (#17–10,499, Millipore) was used according to the manufacturer’s instructions, and m6A enrichment was analyzed by qPCR.
RNA pull-down assay
A Pierce Magnetic RNA–Protein Pull-Down Kit (Thermo Fisher Scientific, 20,164) was used for the RNA pull-down assay. Briefly, cell extracts were treated with RNase-free DNase I and incubated with biotinylated SH3BP5-AS1 in the presence of streptavidin magnetic beads, which can capture the proteins/miRNAs potentially interacting with SH3BP5-AS1. A Pierce™ RNA 3' End Desthiobiotinylation Kit (Thermo, 20,163) was used for SH3BP5-AS1 biotinylation labeling. Proteins and RNAs in the captured protein–RNA complex were analyzed using western blot and RT-qPCR, respectively.
Drug sensitivity assay
To assess the chemosensitivity of PC cells to GEM, cells were treated with different concentrations of GEM (0.1, 1, 10, and 100 μM) for 72 h in 96-well plates as previously described [7]. An MTT kit was used to detect the number of viable cells, and the half maximal inhibitory concentration (IC50) was calculated to assess drug sensitivity.
Overexpression plasmid and siRNA transfection
The overexpression plasmid and small interfering RNA (siRNA) were purchased from GenePharma (Shanghai, China). Cells at a concentration of 5 × 10⁵ cells/ml per well were cultured in 6-well plates for 2 days. PC cells were transfected with overexpression plasmid or negative controls using Lipofectamine 3000 (Invitrogen) at a final concentration of 50 nM. Cells were transfected with siRNAs or si-NCs using Lipofectamine 3000 (Invitrogen) at a final concentration of 100 nM.
Cell migration and invasion assay
The Transwell assay was used to analyze cell migration and invasion. Chambers coated with Matrigel (Corning Labware Products Inc., Corning, NY, USA) were used for invasion assays, and uncoated chambers with Matrigel were used for cell migration assays. First, 500 μl basal medium (without serum) was added into the chambers. After incubation for 2 h, the chambers were placed in a 24-well plate containing cell culture medium with 10% FBS. Then, 100 μl cell suspension (2 × 10⁵ cells/ml) was added into the chamber. After 24 h, the chambers were fixed with paraformaldehyde and then stained with crystal violet to allow visualization. Cells were photographed under an Olympus IX73 microscope (Olympus).
In vivo assay
Six-week-old male BALB/c nude mice were purchased from the Shanghai Laboratory Animal Center for in vivo experiments. Cells stably transfected with the sh-SH3BP5-AS1 lentivirus or empty vectors were injected subcutaneously or into the tail vein of the selected mice. After 4 weeks, the tumors were harvested and their weight and volume were measured. The experimental protocols were approved by the Fujian Medical University Ethics Review Committee.
Statistical analysis
GraphPad software v.6 and SPSS software version 21.0 (IBM Corp., Armonk, NY, USA) were used for statistical analysis. Measured data are reported as the mean ± standard deviation (SD). Student’s t-test or one-way ANOVA was used to evaluate means between groups. Pearson correlation analysis was performed to determine correlations. Survival was analyzed by Kaplan–Meier curves. The correlations between expression levels and clinicopathological features were analyzed using either the χ2 test or Fisher’s exact test. Data are reported from at least three independent experiments. P < 0.05 was considered to be statistically significant.
Supplementary Information
Additional file 1. Supplementary figures and materials.
Acknowledgements
We thank Dr. Ting Li (Fujian Provincial Hospital, Provincial Clinical College of Fujian Medical University) for the guidance of the experiments throughout the study.
Abbreviations
- m6A
N6-methyladenosine
- lncRNA
Long non-coding RNA
- PC
Pancreatic cancer
- PDX
Patient-derived xenograft
- shRNA
Short hairpin RNA
- DMEM
Dulbecco’s modified eagle’s medium
- CTBP1
C-terminal binding protein 1
- FBS
Fetal bovine serum
- IHC
Immunohistochemistry
- RIP
Immunoprecipitation
- MeRIP
Methylated RNA immunoprecipitation qPCR
Author contributions
CL, YW, YD and carried out experiments and drafted the manuscript. LW collected the clinical samples. SL analyzed the data. SW provided critical intellectual revision. XZ designed and directed the study. All the authors read and approved the final manuscript.
Funding
This study was supported in part by the grants from the Natural Science Foundation of Fujian Province (2020J5248), Startup Fund for Scientific Reseach of Fujian Medical University (2019QH1064), Youth Scientific Reseach Project of Fujian Province Health Commission (2020QNA052).
Availability of data and materials
All the data obtained in current study were available from the corresponding authors on reasonable request.
Declarations
Ethics approval and consent to participate
The current study design and protocols were approved by the Ethics Committee of the First Affiliated Hospital of Fujian Medical University, China.
Consent for publication
All authors have agreed to publish this manuscript in Biology Direct.
Competing interests
The authors declare no competing interests.
Footnotes
Publisher's Note
Springer Nature remains neutral with regard to jurisdictional claims in published maps and institutional affiliations.
Chengjie Lin, Yan Wang and Yihong Dong authors have contributed equally to this work and share first authorhip.
Contributor Information
Shangeng Weng, Email: shangeng@sina.com.
Xiang Zhang, Email: seva1101@163.com.
References
- 1.Siegel RL, Miller KD, Fuchs HE, et al. Cancer statistics, 2021. CA Cancer J Clin. 2021;71(1):7–33. doi: 10.3322/caac.21654. [DOI] [PubMed] [Google Scholar]
- 2.Rawla P, Sunkara T, Gaduputi V. Epidemiology of pancreatic cancer: global trends, etiology and risk factors. World J Oncol. 2019;10(1):10–27. doi: 10.14740/wjon1166. [DOI] [PMC free article] [PubMed] [Google Scholar]
- 3.Tempero M, Oh DY, Tabernero J, et al. Ibrutinib in combination with nab-paclitaxel and gemcitabine for first-line treatment of patients with metastatic pancreatic adenocarcinoma: phase III RESOLVE study. Ann Oncol Off J Eur Soc Med Oncol. 2021;32(5):600–608. doi: 10.1016/j.annonc.2021.01.070. [DOI] [PubMed] [Google Scholar]
- 4.Yang G, Guan W, Cao Z, et al. Integrative genomic analysis of gemcitabine resistance in pancreatic cancer by patient-derived xenograft models. Clin Cancer Res Off J Am Assoc Cancer Res. 2021;27(12):3383–3396. doi: 10.1158/1078-0432.CCR-19-3975. [DOI] [PubMed] [Google Scholar]
- 5.Zhou C, Yi C, Yi Y, et al. LncRNA PVT1 promotes gemcitabine resistance of pancreatic cancer via activating Wnt/β-catenin and autophagy pathway through modulating the miR-619-5p/Pygo2 and miR-619-5p/ATG14 axes. Mol Cancer. 2020;19(1):118. doi: 10.1186/s12943-020-01237-y. [DOI] [PMC free article] [PubMed] [Google Scholar]
- 6.Xiong G, Liu C, Yang G, et al. Long noncoding RNA GSTM3TV2 upregulates LAT2 and OLR1 by competitively sponging let-7 to promote gemcitabine resistance in pancreatic cancer. J Hematol Oncol. 2019;12(1):97. doi: 10.1186/s13045-019-0777-7. [DOI] [PMC free article] [PubMed] [Google Scholar]
- 7.Shi W, Zhang C, Ning Z, et al. Long non-coding RNA LINC00346 promotes pancreatic cancer growth and gemcitabine resistance by sponging miR-188-3p to derepress BRD4 expression. J Exp Clin Cancer Res CR. 2019;38(1):60. doi: 10.1186/s13046-019-1055-9. [DOI] [PMC free article] [PubMed] [Google Scholar]
- 8.Utnes P, Løkke C, Flægstad T, et al. Clinically relevant biomarker discovery in high-risk recurrent neuroblastoma. Cancer Inform. 2019;18:1176935119832910. doi: 10.1177/1176935119832910. [DOI] [PMC free article] [PubMed] [Google Scholar]
- 9.Lina S. Identification of hub lncRNAs in head and neck cancer based on weighted gene co-expression network analysis and experiments. FEBS Open Bio. 2021;11(7):2060–2073. doi: 10.1002/2211-5463.13134. [DOI] [PMC free article] [PubMed] [Google Scholar]
- 10.Blevins MA, Huang M, Zhao R. The role of CtBP1 in oncogenic processes and its potential as a therapeutic target. Mol Cancer Ther. 2017;16(6):981–990. doi: 10.1158/1535-7163.MCT-16-0592. [DOI] [PMC free article] [PubMed] [Google Scholar]
- 11.Chinnadurai G. CtBP, an unconventional transcriptional corepressor in development and oncogenesis. Mol Cell. 2002;9(2):213–224. doi: 10.1016/S1097-2765(02)00443-4. [DOI] [PubMed] [Google Scholar]
- 12.Grooteclaes M, Deveraux Q, Hildebrand J, et al. C-terminal-binding protein corepresses epithelial and proapoptotic gene expression programs. Proc Natl Acad Sci USA. 2003;100(8):4568–4573. doi: 10.1073/pnas.0830998100. [DOI] [PMC free article] [PubMed] [Google Scholar]
- 13.Wang T, Kong S, Tao M, et al. The potential role of RNA N6-methyladenosine in cancer progression. Mol Cancer. 2020;19(1):88. doi: 10.1186/s12943-020-01204-7. [DOI] [PMC free article] [PubMed] [Google Scholar]
- 14.Song H, Liu D, Dong S, et al. Epitranscriptomics and epiproteomics in cancer drug resistance: therapeutic implications. Signal Transduct Target Ther. 2020;5(1):193. doi: 10.1038/s41392-020-00300-w. [DOI] [PMC free article] [PubMed] [Google Scholar]
- 15.Heo JS, Choi Y, Kim HS, et al. Comparison of molecular profiles of human mesenchymal stem cells derived from bone marrow, umbilical cord blood, placenta and adipose tissue. Int J Mol Med. 2016;37(1):115–125. doi: 10.3892/ijmm.2015.2413. [DOI] [PMC free article] [PubMed] [Google Scholar]
- 16.Zhang T, Zhang SW, Zhang SY, et al. m6A-express: uncovering complex and condition-specific m6A regulation of gene expression. Nucleic Acids Res. 2021 doi: 10.1093/nar/gkab714. [DOI] [PMC free article] [PubMed] [Google Scholar]
- 17.Jiang X, Liu B, Nie Z, et al. The role of m6A modification in the biological functions and diseases. Signal Transduct Target Ther. 2021;6(1):74. doi: 10.1038/s41392-020-00450-x. [DOI] [PMC free article] [PubMed] [Google Scholar]
- 18.Chen Y, Zhao Y, Chen J, et al. ALKBH5 suppresses malignancy of hepatocellular carcinoma via mA-guided epigenetic inhibition of LYPD1. Mol Cancer. 2020;19(1):123. doi: 10.1186/s12943-020-01239-w. [DOI] [PMC free article] [PubMed] [Google Scholar]
- 19.Guo X, Li K, Jiang W, et al. RNA demethylase ALKBH5 prevents pancreatic cancer progression by posttranscriptional activation of PER1 in an m6A-YTHDF2-dependent manner. Mol Cancer. 2020;19(1):91. doi: 10.1186/s12943-020-01158-w. [DOI] [PMC free article] [PubMed] [Google Scholar]
- 20.Zhang X, Zhong L, Zou Z, et al. Clinical and prognostic pan-cancer analysis of N6-methyladenosine regulators in two types of hematological malignancies: a retrospective study based on TCGA and GTEx Databases. Front Oncol. 2021;11:623170. doi: 10.3389/fonc.2021.623170. [DOI] [PMC free article] [PubMed] [Google Scholar]
- 21.Li SY, Zhu Y, Li RN, et al. αLncRNA Lnc-APUE is repressed by HNF4 and promotes G1/S phase transition and tumor growth by regulating MiR-20b/E2F1 axis. Adv Sci. 2021;8(7):2003094. doi: 10.1002/advs.202003094. [DOI] [PMC free article] [PubMed] [Google Scholar]
- 22.Sun CC, Zhu W, Li SJ, et al. FOXC1-mediated LINC00301 facilitates tumor progression and triggers an immune-suppressing microenvironment in non-small cell lung cancer by regulating the HIF1α pathway. Genome Med. 2020;12(1):77. doi: 10.1186/s13073-020-00773-y. [DOI] [PMC free article] [PubMed] [Google Scholar]
- 23.Wang W, Hu W, Wang Y, et al. Long non-coding RNA UCA1 promotes malignant phenotypes of renal cancer cells by modulating the miR-182-5p/DLL4 axis as a ceRNA. Mol Cancer. 2020;19(1):18. doi: 10.1186/s12943-020-1132-x. [DOI] [PMC free article] [PubMed] [Google Scholar]
- 24.Huang N, Guo W, Ren K, et al. LncRNA AFAP1-AS1 supresses miR-139-5p and promotes cell proliferation and chemotherapy resistance of non-small cell lung cancer by competitively upregulating RRM2. Front Oncol. 2019;9:1103. doi: 10.3389/fonc.2019.01103. [DOI] [PMC free article] [PubMed] [Google Scholar]
- 25.Yang Q, Li K, Huang X, et al. lncRNA SLC7A11-AS1 promotes chemoresistance by blocking SCF-mediated degradation of NRF2 in pancreatic cancer. Mol ther Nucleic Acids. 2020;19:974–985. doi: 10.1016/j.omtn.2019.11.035. [DOI] [PMC free article] [PubMed] [Google Scholar]
- 26.Lu JW, Rouzigu A, Teng LH, et al. the construction and comprehensive analysis of inflammation-related ceRNA networks and tissue-infiltrating immune cells in ulcerative progression. Biomed Res Int. 2021;2021:6633442. doi: 10.1155/2021/6633442. [DOI] [PMC free article] [PubMed] [Google Scholar]
- 27.Su SC, Yeh CM, Lin CW, et al. A novel melatonin-regulated lncRNA suppresses TPA-induced oral cancer cell motility through replenishing PRUNE2 expression. J Pineal Res. 2021;71:e12760. doi: 10.1111/jpi.12760. [DOI] [PubMed] [Google Scholar]
- 28.Zheng J, Zhao Z, Wan J, et al. N-6 methylation-related lncRNA is potential signature in lung adenocarcinoma and influences tumor microenvironment. J Clin Lab Anal. 2021;35:e23951. doi: 10.1002/jcla.23951. [DOI] [PMC free article] [PubMed] [Google Scholar]
- 29.Tang B, Yang Y, Kang M, et al. mA demethylase ALKBH5 inhibits pancreatic cancer tumorigenesis by decreasing WIF-1 RNA methylation and mediating Wnt signaling. Mol Cancer. 2020;19(1):3. doi: 10.1186/s12943-019-1128-6. [DOI] [PMC free article] [PubMed] [Google Scholar] [Retracted]
- 30.Jia G, Wang Y, Lin C, et al. LNCAROD enhances hepatocellular carcinoma malignancy by activating glycolysis through induction of pyruvate kinase isoform PKM2. J Exp Clin Cancer Res CR. 2021;40(1):299. doi: 10.1186/s13046-021-02090-7. [DOI] [PMC free article] [PubMed] [Google Scholar] [Retracted]
- 31.Paredes R, Schneider M, Stevens A, et al. EVI1 carboxy-terminal phosphorylation is ATM-mediated and sustains transcriptional modulation and self-renewal via enhanced CtBP1 association. Nucleic Acids Res. 2018;46(15):7662–7674. doi: 10.1093/nar/gky536. [DOI] [PMC free article] [PubMed] [Google Scholar]
- 32.Sahu SK, Tiwari N, Pataskar A, et al. FBXO32 promotes microenvironment underlying epithelial-mesenchymal transition via CtBP1 during tumour metastasis and brain development. Nat Commun. 2017;8(1):1523. doi: 10.1038/s41467-017-01366-x. [DOI] [PMC free article] [PubMed] [Google Scholar]
- 33.Huard CC, Tremblay CS, Helsper K, et al. Fanconi anemia proteins interact with CtBP1 and modulate the expression of the Wnt antagonist Dickkopf-1. Blood. 2013;121(10):1729–1739. doi: 10.1182/blood-2012-02-408997. [DOI] [PubMed] [Google Scholar]
- 34.Valenta T, Lukas J, Korinek V. HMG box transcription factor TCF-4's interaction with CtBP1 controls the expression of the Wnt target Axin2/Conductin in human embryonic kidney cells. Nucleic Acids Res. 2003;31(9):2369–2380. doi: 10.1093/nar/gkg346. [DOI] [PMC free article] [PubMed] [Google Scholar]
Associated Data
This section collects any data citations, data availability statements, or supplementary materials included in this article.
Supplementary Materials
Additional file 1. Supplementary figures and materials.
Data Availability Statement
All the data obtained in current study were available from the corresponding authors on reasonable request.


