

Abstract
Background
Previous studies of worsening chronic kidney disease (CKD) based on declining estimated glomerular filtration rate (eGFR) or increasing urine albumin‐creatinine ratio (UACR) are limited to later middle‐age and older adults. We examined associations of CKD progression and incident cardiovascular disease (CVD) and mortality in younger adults.
Methods and Results
We studied 4382 adults in CARDIA (Coronary Artery Risk Development in Young Adults) initially aged 27 to 41 years and prospectively over 20 years. Five‐year transition probabilities across CKD risk categories were based on eGFR and UACR measured at each exam. Proportional hazards models predicted incident CVD and all‐cause mortality by time‐varying CKD risk category, adjusting for demographics and CVD risk factors. Progression of CKD risk categories over 20 years occurred in 28.7% (1256/4382) of participants, driven by increases in UACR, but including 5.8% (n=255) with eGFR<60 mL/min per 1.73 m2 or UACR ≥300 mg/g. Compared with eGFR ≥60 and UACR <10, demographic and smoking‐adjusted hazard ratios for CVD were 1.62 (95% CI, 1.21–2.18) for low CKD risk (eGFR ≥60 with UACR 10–29) and 13.65 (95% CI, 7.52–24.79) for very high CKD risk (eGFR <30 or eGFR 30–44 with UACR 30–299; or eGFR 30–59 with UACR ≥300). Corresponding hazard ratios for all‐cause mortality were 1.42 (95% CI, 1.08–1.88) and 14.75 (95% CI, 9.97–21.82). Although CVD associations were attenuated after adjustment for mediating CVD risk factors, all‐cause mortality associations remained statistically significant.
Conclusions
Among young to middle‐aged adults, progression to higher CKD risk category was common. Routine monitoring eGFR and UACR holds promise for prevention of CVD and total mortality.
Keywords: all‐cause mortality, cardiovascular disease, CKD risk categories, KDIGO, progression, transition, young adults
Subject Categories: Cardiovascular Disease, Epidemiology, Primary Prevention
Nonstandard Abbreviations and Acronyms
- CARDIA
Coronary Artery Risk Development in Young Adults
- KDIGO
Kidney Disease: Improving Global Outcomes
Clinical Perspective
What Is New?
Progression to a higher chronic kidney disease risk category is common in middle‐aged Black and White participants.
Even in this age range, decline in estimated glomerular filtration rate below 60 mL/min per 1.73 m2 (5%) strongly predicts incident cardiovascular disease and total mortality.
A small increase in urine albumin‐creatinine ratio is also predictive.
What Are the Clinical Implications?
Monitoring estimated glomerular filtration rate and urine albumin‐creatinine ratio in routine medical checkups through early middle age can identify the rare person with actionable loss of kidney function.
More commonly, those who excrete small amounts of albumin would benefit from aggressive risk factor reduction.
The American Heart Association and the American College of Cardiology 2018 Cholesterol Guidelines 1 , 2 recognize estimated glomerular filtration rate (eGFR) <60 mL/min per 1.73 m2 but not increased urine albumin‐creatinine ratio (UACR) as a risk “enhancer” for cardiovascular disease (CVD). However, the Kidney Disease: Improving Global Outcomes (KDIGO) group suggests that when defining chronic kidney disease (CKD) and its progression, both eGFR decline and increasing UACR should be considered. 3 , 4 CKD, which affects 15% of the US adult population, is associated with increased risk for kidney failure, CVD, and mortality; 5 as eGFR declines and UACR increases, risk for CKD progression, CVD, and mortality increase. 6
Previous studies have examined changes in either eGFR or UACR, but limited data 7 have prospectively examined advancement in CKD risk categories based on the combination of eGFR and UACR. 8 Increased UACR defined as ≥30 mg/g is more prevalent than decreased eGFR (eGFR <60 mL/min per 1.73 m2) in the US population (according to the National Health and Nutrition Examination Surveys 9 and Centers for Disease Control Surveillance), and studies suggest that a level of UACR as low as 10 mg/g indicate increased CVD risk. 10 , 11 , 12 , 13 Only a few prospective cohort studies have examined CKD risk categories defined by both eGFR and UACR, and they started with middle‐aged or older adults who were generally at higher risk at the study baseline. 8 , 14 The Kaiser Permanente cohort, a routine care setting–based study that used electronic health records showed that higher KDIGO risk categories were associated with greater risk of end‐stage kidney disease and total mortality, and the associations were stronger in patients with diabetes than those without diabetes. 8 However, the mean age of that cohort, which started with people identified with diabetes and then matched 1:1 to those without diabetes, was 60.7 years. Another study is PREVEND (Prevention of Renal and Vascular End‐Stage Disease), a prospective community‐based cohort study, which demonstrated that lower CKD stages (defined by eGFR according to earlier CKD staging criteria and modulated by UACR) 15 were also importantly associated with higher risk of CVD and accelerated kidney function decline compared with those without CKD. 14
We prospectively examined the probability of progressing to a higher CKD risk category based on both eGFR and UACR in a generally healthy sample of younger adults. We further assessed the association of time‐varying CKD risk category with risk of fatal or nonfatal CVD and all‐cause mortality over a 20‐year period using data from the CARDIA (Coronary Artery Risk Development in Young Adults) cohort.
Methods
The data that support the findings of this study are available from the CARDIA Coordinating Center (https://www.cardia.dopm.uab.edu) upon reasonable request.
Study Population and Design
The CARDIA cohort is a prospective, community‐based study conducted in four US metropolitan areas (Birmingham, AL; Chicago, IL; Minneapolis, MN; and Oakland, CA). 16 The study began in 1985 to 1986 (exam year 0) with 5115 Black and White men and women aged 18 to 30 years. At each site, the CARDIA sample was designed to comprise nearly equal numbers of participants by sex, self‐defined race (Black or White participants), age (18–24 years or 25–30 years), and education (less than high school or high school or greater). The study protocol at each examination and annual follow‐up for address and health status were approved by the institutional review boards at each institution. All participants provided written informed consent at each study visit.
We excluded participants who had a history of CVD or died before kidney study baseline evaluation at exam year 10 (n=90), had no CKD measurements (n=722), or had missing hypertension, diabetes, dyslipidemia, or obese status through exam year 10 (n=9). After these exclusions, 4382 were included in the current analyses.
CKD Measurements and Risk Categories
Serum creatinine and urine albumin and creatinine were assayed 5 times: at exam years 10 (age 27–41 years), 15, 20, 25, and 30, a 20‐year period. Serum creatinine concentration was assayed with the Jaffe method every 5 years, starting in exam year 10 and continuing through exam year 20, and using the Roche enzymatic method at exam years 25 and 30. Both assays were calibrated to National Institute of Standards and Technology samples. The eGFR (mL/min per 1.73 m2) was calculated using the serum creatinine–based Chronic Kidney Disease Epidemiology Collaboration 2021 equation, which does not include race in its estimation. 17 Urine albumin and creatinine were measured from single untimed urine specimens collected at the same exam. At exam years 10 to 20, urine albumin was measured using nephelometry with a specific antialbumin monoclonal antibody and urine creatinine using the Jaffe method. 18 Urine albumin and urine creatinine were assayed using the Roche enzymatic method at exam years 25 and 30. 18 Before each examination, serum and urine samples stored since the previous examination were reassayed to establish laboratory comparability across examinations. UACR was calculated in mg/g. Hospitalization or fatal kidney failure was ascertained in annual surveys through exam year 33 (August 31, 2019).
CKD risk categories were based on the KDIGO 2012 CKD heat map, 4 , 7 modified in 2 ways. First, we separated category A1 (UACR <30 mg/g) into 2 categories, A1a (<10) and A1b (10–29), to distinguish those with UACR <10 since CVD risk increases with UACR values >10 mg/g 11 , 12 and is especially relevant in younger adults. Second, we moved G3a/A1 at any exam from moderate risk to high risk, given the small number of people in CARDIA with eGFR <60 mL/min/1.73 m2. The 5 CKD risk categories were classified on the basis of combinations of eGFR and UACR and kidney failure, as specified in Figure 1.
Figure 1. Definition of 5 CKD modified KDIGO risk categories employed in this study*.

*KDIGO 2012 risk matrix (reference [4]), modified to capture mild severity. Given relatively few people in G3aA1, those people were included with others who had eGFR <60 (orange category), whereas in the KDIGO 2012 risk matrix they were in the yellow category. Each block is formed based on combination categories of eGFR and UACR. CKD risk category numbering is such that a higher number reflects presumed greater risk. CKD indicates chronic kidney disease; eGFR, estimated glomerular filtration rate; KDIGO, Kidney Disease: Improving Global Outcomes; and UACR, urine albumin‐creatinine ratio.
Ascertainment of CVD Incidence and All‐Cause Death
CVD cases were identified through annual follow‐up contacts (91% of CARDIA participants were successfully contacted within the last 5 calendar years of the study) and medical record review through August 31, 2019. All diagnoses of nonfatal CVD, including heart failure, were based on hospital records. Deaths were identified from annual contact with family members and linkage to the National Death Index. When appropriate, the death certificate, autopsy, and hospital records were requested with next‐of‐kin consent. The adjudicated events and underlying cause of death were assigned by 2 physicians or committee consensus after reviewing all collected information. CVD was defined as a composite of first occurrence of myocardial infarction, non–myocardial infarction acute coronary syndrome, heart failure, carotid or peripheral artery disease, atherosclerotic coronary heart disease, other atherosclerotic disease, nonatherosclerotic cardiac disease, nonfatal cardiac revascularization, stroke, any nonfatal transient ischemic attack. In epidemiological studies, composite CVD events that broadly capture clinically relevant cardiovascular events are frequently used because distal risk factors such as early changes in kidney function affect the heart, brain, and large and small arteries. 19 Kidney failure was ascertained, defined by treating physician diagnosis, initiation of dialysis, or need for/actual kidney transplantation.
Other Risk Factor Measurements
Age, race, and sex were ascertained at exam year 0. Years of education completed, smoking status and pack‐years of smoking, and medication use (for diabetes, hypertension, dyslipidemia) were obtained at every examination by self‐reported history or review of medication bottles. Body mass index (kg/m2) and blood pressure were assessed by trained staff at every examination. Participants were asked to fast for 12 hours before each clinical visit. Blood was drawn from the antecubital vein, and serum and plasma aliquots were stored at −70°C until testing. Detailed description of blood specimen collection and methodologies to assay concentrations of total cholesterol, triglycerides, high‐density lipoprotein cholesterol, low‐density lipoprotein cholesterol, glucose, and insulin are reported elsewhere. 20 , 21 , 22 Dyslipidemia was defined as serum triglycerides ≥150 mg/dL or high‐density lipoprotein cholesterol <40 for men and <50 mg/dL for women. Diabetes was defined as fasting glucose concentration ≥126 mg/dL; 2‐hour postchallenge glucose concentration ≥200 mg/dL (measured at exam years 10, 20, and 25); glycated hemoglobin ≥6.5% (measured at exam years 20 and 25); or use of antidiabetic medication. 23 Other laboratory data derived from blood samples included urate. Lung volume was estimated at exam years 0, 2, 5, 10, 20, and 30 by spirometry as forced vital capacity. 24
Statistical Analysis
We estimated the prevalence of each CKD risk category at each exam. Kidney function markers were measured or severe kidney disease found on annual follow‐up in 3461, 3311, 3369, 3403, and 3010 participants at exam years 10, 15, 20, 25, and 30, respectively. Cumulative worst CKD risk category for each exam was the primary CKD measure used in the present analysis and included people whose first exam in this series was after exam year 10. It was formed from the worst CKD risk category so far observed or by carrying forward the most recent nonmissing value. Sample sizes were therefore 3461, 4032, 4261, 4376, and 4382 participants from the exam year 10 to exam year 30. Number of new entries at exam years 15, 20, 25, and 30 were 571, 229, 115, and 6, respectively (Figure 2). Characteristics were compared across the modified KDIGO CKD risk categories at exam year 10 using the chi‐squared test for categorical variables and ANOVA for continuous variables.
Figure 2. Shift in multinomial CKD risk category prevalence between exam years 10 and 30.
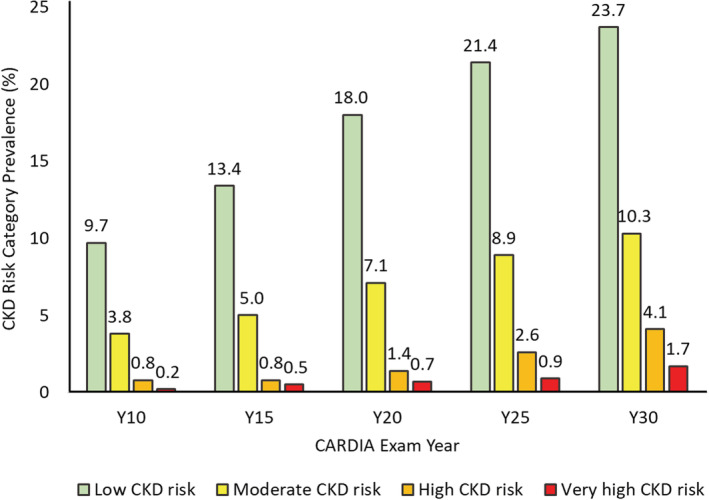
Sample size with kidney function markers obtained or found with severe kidney disease on annual followup varied across exams, namely, 3461, 3311, 3369, 3403, and 3010 at exam years 10, 15, 20, 25, and 30, respectively. Cumulative worst CKD risk category for each exam, carrying forward the most recent nonmissing value in the case of missing information, was therefore obtained in 3461, 4032, 4261, 4376, and 4382 participants from exam years 10 to 30 exam. Number of new entries at exam years 15, 20, 25, and 30 were 571, 229, 115, and 6, respectively. Numbers in the very low CKD risk category at exam years 15, 20, 25, and 30 were 2966 (85.7%), 3240 (80.4%), 3113 (73.1%), 2907 (66.4%), and 2651(60.5%), respectively. CKD risk category classification was cumulative over time. Participants were classified in a CKD category at their first attended examination and that classification was updated at the next examination or carried forward if the next examination was missed. CARDIA indicates Coronary Artery Risk Development in Young Adults; and CKD, chronic kidney disease.
To estimate probability of advancing to a higher CKD risk category, we compared consecutive exams (based only on nonmissing data in paired consecutive exams; decedents and those missing exams contribute only to consecutive attended exam pairs). We estimated 5‐year transition probabilities from each starting risk category to each possible next risk category; 15 transitions are possible in each 5‐year period. This procedure gave 4 transition matrices, which were averaged to get the final estimate for each of the 15 possible transitions. The SE of each estimate was the SD of the 4 exam pair–specific estimates. To estimate the 20‐year probability of advancing to a higher CKD risk category, we raised the 5‐year transition probability matrix to the fourth power.
We then examined the association of incident CVD events and total mortality following time‐varying entry into a given CKD risk category. Cox proportional hazard models were fitted to estimate hazard ratios (HRs) (95% CIs) of CVD and all‐cause mortality across the CKD risk category, with adjustment for age, sex, race (Black or White participants), and maximal educational attainment in model 1. Model 2 added time‐varying pack‐years of smoking to model 1. We assumed that hypertension, diabetes, dyslipidemia, obesity, high urate, and lower forced vital capacity occurring before an event are in the causal pathway between the CKD risk category and the event. We examined reduction in the proportional hazards regression coefficients as a measure of whether the associations of CKD risk category with incident CVD and all‐cause mortality were mediated by these clinical conditions. Thus, model 3 additionally adjusted for time‐varying hypertension, diabetes, and dyslipidemia, and model 4 further included time‐varying obesity, high urate, and forced vital capacity. Follow‐up person‐years were calculated from the date of the first CKD measurements to the date of initial diagnosis of CVD, death, loss to follow‐up, or the end of follow‐up (August 31, 2019), whichever came first.
The time‐varying CKD risk category was the maximum attained throughout earlier examinations. We performed sensitivity analyses to examine the extent to which reversion to a less severe category at a later examination indicated that use of the maximum CKD risk category ever attained resulted in overdiagnosis. All analyses were performed with SAS version 9.4 (SAS Institute Inc., Cary, NC), and P < 0.05 was considered statistically significant (2‐sided).
Results
Participant Characteristics
In the final sample, 49.6% of participants were Black participants and 55.1% were women; the mean exam year 10 age was 35±3.7 years. Individuals in the highest CKD risk categories at exam year 10 were more likely to be Black participants and less educated compared with individuals in the low CKD risk category, whereas women were overrepresented in the low CKD risk category (eGFR ≥60 mL/min per 1.73 m2 and UACR 10–29 mg/g) (Table 1). The prevalences of hypertension, diabetes, dyslipidemia, obesity, and high urate were considerably higher with higher CKD risk categories. In addition, forced vital capacity was inversely associated with CKD risk category.
Table 1.
Participant Characteristics at Exam Year 10 According to CKD Risk Category at CARDIA Year 10* (n=3461)
| Characteristics | Very low CKD risk, n=2965 | Low CKD risk, n=336 | Moderate CKD risk, n=131 | High CKD risk, n=21 | Very high CKD risk, n=8 | P value† |
|---|---|---|---|---|---|---|
| Exam year 10 age, y | 35.0±3.66 | 35.2±3.49 | 35.0±3.49 | 35.1±4.57 | 34.8±4.4 | 0.82 |
| Female participants, n (%) | 1537 (51.8) | 214 (63.7) | 60 (45.8) | 13 (61.9) | 5 (62.5) | <0.001 |
| Black participants, n (%) | 1372 (46.3) | 174 (51.8) | 89 (67.9) | 15 (71.4) | 8 (100) | <0.001 |
| Maximal educational attainment, y | 15.7±2.62 | 15.3±2.68 | 14.9±2.58 | 13.9±2.28 | 13.5±1.51 | <0.001 |
| Current smokers, n (%) | 731 (24.7) | 90 (26.9) | 41 (31.8) | 10 (47.6) | 2 (25.0) | 0.10 |
| Pack‐year of smoking | 3.94±7.26 | 4.13±7.61 | 4.18±7.02 | 5.74±7.2 | 2.98±4.13 | 0.79 |
| Hypertension through exam year 10, n (%)‡ | 300 (10.1) | 67 (19.9) | 45 (34.4) | 11 (52.4) | 8 (100) | <0.001 |
| Antihypertensive medication use through exam year 10, n (%) | 230 (7.8) | 48 (14.3) | 39 (29.8) | 11 (52.4) | 8 (100) | <0.001 |
| Diabetes through exam year 10, n (%)§ | 51 (1.7) | 21 (6.3) | 25 (19.1) | 6 (28.6) | 3 (37.5) | <0.001 |
| Dyslipidemia through exam year 10, n (%)|| | 1663 (56.1) | 212 (63.1) | 88 (67.2) | 15 (71.4) | 7 (87.5) | 0.003 |
| Obesity through exam year 10, n (%)# | 802 (27.1) | 128 (38.1) | 60 (45.8) | 13 (61.9) | 4 (50) | <0.001 |
| High urate at exam year 10, n (%)** | 425 (14.3) | 68 (20.2) | 39 (29.8) | 11 (52.4) | 5 (62.5) | <0.001 |
| FVC (liter) | 4.35±1.03 | 4.04±0.97 | 4.01±1.0 | 3.91±0.72 | 3.65±1.42 | <0.001 |
| eGFR (mL/min per 1.73 m2) | 105.5±14.02 | 108.8±28.16 | 106±17.1 | 95.4±25.8 | 34.8±18.36 | <0.001 |
| UACR (mg/g) | 4.06±1.95 | 15.9±5.03 | 70.1±47.6 | 1280±1585 | 2167±1407 | <0.001 |
Values are reported as the mean±SD, median (interquartile range), or number (percent). Figure 1 describes CKD risk categories in terms of eGFR and UACR. CARDIA indicates Coronary Artery Risk Development in Young Adults; CKD, chronic kidney disease; eGFR, estimated glomerular filtration rate; FVC, forced vital capacity; ln, natural logarithm; and UACR, urine albumin‐creatinine ratio.
Baseline for the CKD study (first assessment of eGFR and UACR) was at CARDIA exam year 10 in 1995 to 1996.
Evaluated with chi‐square tests for categorical variables and ANOVA for continuous variables.
Systolic or diastolic blood pressure ≥140/90 mm Hg or taking antihypertensive medications.
Defined as fasting glucose ≥126 mg/dL, 2‐hour glucose ≥200 mg/dL, or glycated hemoglobin level ≥6.5%, or taking antidiabetic medications.
Defined as high‐density lipoprotein cholesterol <40 mg/dL for men and <50 mg/dL for women.
Defined as body mass index ≥30 kg/m2.
Defined as >6 mg/dL for women and >7.2 mg/dL for men.
CKD Risk Category Prevalences Over Time
At baseline, 85.7% of participants were in the very low CKD risk category at year 10 (age 35). The prevalences of CKD risk categories at year 30 suggest clinically important changes (Figure 2), such that only 60.5% remained in the very low CKD risk category at year 30 (mean age, 55 years). During 20‐year follow‐up, the prevalence of low risk (eGFR ≥60 and UACR 10–29) increased from 9.7% to 23.7%, the prevalence of moderate risk (eGFR ≥60 and UACR 30–299) increased from 3.8% to 10.3%, prevalence of high risk (eGFR 30–59 and UACR <30; or eGFR 45–59 and UACR 30–299; or eGFR ≥60 and UACR ≥300) increased from 0.6% to 4.1%, and very high risk (eGFR <30 or eGFR 30–44 and UACR 30–299; or eGFR 30–59 and UACR ≥300) increased from 0.2% to 1.7%.Thus, the majority of CKD progression occurred because of increases in UACR but including 5.8% of the sample who ever had eGFR <60 or UACR ≥300.
Transition Probabilities for CKD Risk Category Progression
Over the 20‐year follow‐up, 28.7% (1256/4382) showed any progression to a worse CKD risk; of these, 1027 had increasing UACR with eGFR remaining at ≥60. Five‐year transition probabilities, expressed as percentage (SE), are estimated within‐person risks of progressing to a worse CKD risk category (Table 2). Transition to the next worse risk category occurred in 6.8% of those starting in the very low CKD risk category, 7.9% of those starting in the low CKD risk category, 6.4% of those starting in the moderate CKD risk category, and 16.9% of those starting in the high CKD risk category. Transition by ≥2 CKD risk categories, starting in the very low, low, or moderate CKD risk categories, occurred less frequently, yet those transition probabilities were higher, the higher the starting CKD risk category. For example, progression rates into the very high CKD risk category were 0.1% from the very low CKD risk category, 0.3% from the low CKD risk category, 1.3% from the moderate CKD risk category, and 16.9% from the high CKD risk category. Cumulatively over 20 years, these 5‐year changes indicate that ≈30% of participants showed progression of CKD risk categories (Table 3). The 5‐year transition probabilities and sample sizes for each pair of sequential exams are presented in Table S1.
Table 2.
Average 5‐Year Transition Probability, Expressed as Percentage (SE), Between Cumulative Serial CKD Risk Categories Over 20 Years of Follow‐Up
| Destination CKD risk category | ||||||
|---|---|---|---|---|---|---|
| Very low CKD risk | Low CKD risk | Moderate CKD risk | High CKD risk | Very high CKD risk | ||
| Starting CKD risk category | Very low CKD risk | 91.2 (1.16) | 6.8 (0.93) | 1.3 (0.15) | 0.7 (0.46) | 0.1 (0.04) |
| Low CKD risk | 90.6 (0.79) | 7.9 (1.47) | 1.2 (0.98) | 0.3 (0.28) | ||
| Moderate CKD risk | 92.4 (1.71) | 6.4 (1.13) | 1.3 (0.67) | |||
| High CKD risk | 83.1 (10) | 16.9 (10) | ||||
| Very high CKD risk | 100 (0) | |||||
Figure 1 describes CKD risk categories in terms of eGFR and UACR. Exam pairs were cross‐tabulated. Conditioning on previous risk category, row % were averaged and their empirical SEs were computed. The generally low standard error suggests homogeneity across exams. Sample sizes in each exam pair are presented in Table S1. CKD indicates chronic kidney disease; eGFR, estimated glomerular filtration rate; and UACR, urine albumin‐creatinine ratio.
Table 3.
20–year transition probabilities estimated from the model in Table 2
| Destination CKD risk category | ||||||
|---|---|---|---|---|---|---|
| Very low CKD risk | Low CKD risk | Moderate CKD risk | High CKD risk | Very high CKD risk | ||
| Starting CKD risk category | Very low CKD risk | 69.1 | 20.3 | 6.7 | 2.8 | 1.2 |
| Low CKD risk | 67.5 | 24.3 | 5.5 | 2.8 | ||
| Moderate CKD risk | 72.8 | 17.2 | 10.0 | |||
| High CKD risk | 47.6 | 52.4 | ||||
| Very high CKD risk | 100 | |||||
Figure 1 describes CKD risk categories in terms of eGFR and UACR. This table was computed as the fourth power of the transition matrix in Table 2. It is a synthetic estimate based on the assumption that the 5‐year transition matrix in Table 2 applies over the 20 years of follow‐up, rather than a direct observation of people who were observed at all exams from exam year 10 to exam years 30. CKD indicates chronic kidney disease; eGFR, estimated glomerular filtration rate; and UACR, urine albumin‐creatinine ratio.
Association of Time‐Varying CKD Risk Category With Risk of Incident CVD and All‐Cause Mortality
During 20 years of follow‐up, 313 participants had incident CVD, and 358 all‐cause deaths occurred. There was a significant, graded association between time‐varying CKD risk category and risk of CVD (Table 4). The adjusted HRs for incident CVD (model 1) compared with the very low CKD risk category were 1.70, 2.23, 4.78, and 12.99 for low, moderate, high, and very high CKD risk categories, respectively. Adding time‐varying smoking (model 2) did not attenuate associations. We found that the associations for low and moderate CKD risk categories were substantially attenuated toward the null after further adjustment for the mediators time‐varying hypertension, diabetes, and dyslipidemia (model 3), whereas the associations remain significant for high and very high CKD risk categories. The HR for CVD was reduced slightly after additional adjustment for other mediating time‐varying covariates, namely, obesity, high urate, and forced vital capacity (model 4). The corresponding HRs of all‐cause mortality in models 1 and 2 were similar to those for incident CVD. Additional adjustment for time‐varying comorbidities (models 3 and 4) did not appreciably alter the HRs of all‐cause mortality for all levels of CKD categories. A sensitivity analysis among those with UACR <30 mg/g showed no difference in risk for eGFR 60 to 89 versus ≥90 mL/min per 1.73 m2 (data not shown).
Table 4.
HRs (95% CIs) for Onset of CVD and Total Mortality According to Time‐Varying CKD Risk Category (n=4382)
| CKD risk category at year 30 | |||||
|---|---|---|---|---|---|
| Very low CKD risk, n=2637 | Low CKD risk, n=1038 | Moderate CKD risk, n=452 | High CKD risk, n=181 | Very high CKD risk, n=74 | |
| Incident CVD | |||||
| Unadjusted cumulative incidence n (%) | 132 (5.0) | 68 (6.6) | 48 (10.6) | 34 (18.8) | 31 (41.9) |
| Model 1 (Minimal adjustment): HR (95% CI)* | 1 (ref) | 1.70 (1.27–2.28) | 2.23 (1.57–3.17) | 4.78 (3.05–7.50) | 12.99 (7.16–23.57) |
| Model 2 (Full adjustment): HR (95% CI)† | 1 (ref) | 1.62 (1.21–2.18) | 2.11 (1.48–3.00) | 4.82 (3.07–7.56) | 13.65 (7.52–24.79) |
| Model 3 (Mediation 1): HR (95% CI)‡ | 1 (ref) | 1.25 (0.93–1.68) | 1.31 (0.91–1.88) | 3.03 (1.92–4.78) | 6.07 (3.30–11.18) |
| Model 4 (Mediation 2): HR (95% CI)§ | 1 (ref) | 1.20 (0.86–1.67) | 1.12 (0.74–1.71) | 2.62 (1.57–4.38) | 4.78 (2.41–9.48) |
| Total mortality | |||||
| Unadjusted cumulative incidence, n (%) | 176 (6.7) | 73 (7.0) | 49 (10.8) | 23 (12.7) | 37 (50.0) |
| Model 1 (Minimal adjustment): HR (95% CI)* | 1 (ref) | 1.48 (1.12–1.96) | 2.22 (1.62–3.05) | 3.27 (2.10–5.07) | 14.16 (9.58–20.92) |
| Model 2 (Full adjustment): HR (95% CI)† | 1 (ref) | 1.42 (1.08–1.88) | 2.12 (1.54–2.91) | 3.29 (2.12–5.11) | 14.75 (9.97–21.82) |
| Model 3 (Mediation 1): HR (95% CI)‡ | 1 (ref) | 1.35 (1.02–1.79) | 1.89 (1.35–2.62) | 2.98 (1.91–4.66) | 12.35 (8.13–18.77) |
| Model 4 (Mediation 2): HR (95% CI)§ | 1 (ref) | 1.56 (1.11–2.20) | 1.56 (1.00–2.44) | 3.49 (2.07–5.89) | 9.43 (5.46–16.29) |
Figure 1 describes CKD risk categories in terms of eGFR and UACR. Time‐varying CKD risk category was used in the proportional hazards regression. Columns are labeled according to the cumulative CKD risk category at exam year 30. CKD indicates chronic kidney disease; CVD, cardiovascular disease; eGFR, estimated glomerular filtration rate; HR, hazard ratio; and UACR, urine albumin‐creatinine ratio.
Model 1: Exam year 0 age, sex, race (Black or White participants), maximal educational attainment.
Model 2: Model 1 + time‐varying pack‐year of smoking.
Model 3: Model 2 + time‐varying hypertension, diabetes, and dyslipidemia.
Model 4: Model 3 + time‐varying obesity, high urate, and forced vital capacity.
Return to a Less Severe CKD Risk Category
Only about 20% of people classified according to the most severe CKD risk category through the current exam later reverted to a nonprogressive status when considering their complete history between year 10 and year 30 (see Data S1 and Table S2).
Discussion
There are several key findings in our study. First, progression to a higher CKD risk category was common in a young to middle‐aged population (aged 27–41 years at baseline), although progression to the higher CKD risk categories was not common. Second, the probabilities of transition to the high or very high CKD risk categories were higher, the higher the starting CKD risk category. Third, time‐varying higher CKD risk category at a given exam was significantly associated with higher risk for incident CVD and all‐cause mortality. However, even the low CKD risk category (eGFR ≥60 mL/min per 1.73 m2 and UACR 10–29 mg/g) was associated with 62% higher CVD risk and 42% higher all‐cause mortality risk compared with the very low CKD risk category, before adjustment for mediators. Fourth, although the magnitude of the association of worsening CKD for incident CVD and all‐cause mortality was similar, after full risk adjustment for mediating variables, association with total mortality was much greater than with CVD. The attenuation of risk for incident CVD by adjustment for mediators does suggest possible avenues for intervention that might reduce risk for CVD. Given that non‐CVD death is common in kidney disease, the competing risk of mortality from non‐CVD causes must be factored into assessment of CVD outcomes.
We observed clinically important progression of CKD risk category in our sample throughout middle age (27–61 years). Most of this progression was by 1 category. CKD progression occurred in 28.7% of participants over 20 years. Progression probabilities were higher in people whose time‐varying eGFR was <60 mL/min per 1.73 m2 than in those with higher eGFR. The majority of CKD progression was attributable to increases in UACR; nevertheless, nearly 6% ever had high or very high CKD risk with eGFR <60 or UACR ≥300.
Prospective studies have shown that eGFR, UACR, or both in combination predicted CVD risk and mortality. 25 , 26 However, they are limited to older, high‐risk groups, mostly in a more advanced CKD risk category, and the KDIGO staging system tends to focus on nuances at the severe end of the spectrum for CKD, which likely do not represent early CKD progression in younger adults. In addition, these studies typically rely on a single baseline measurement of serum creatinine or UACR, assigning a disease status to people who were then followed for several years until an adverse event occurs. The research design with only a single baseline measurement does not account for changes in kidney function between the initial and subsequent measurements. In contrast, time‐varying CKD risk category and time‐varying covariates are more informative because they incorporate major risk changes over time. In that regard, our study is novel and supplements the existing literature.
One or 2 creatinine and UACR measurements often do not adequately reflect the complexities of the clinical course, nor do they acknowledge the abundance of clinical information that is routinely available to health care providers. As we gain access to more data on each person, it is vital to understand how the breadth of available clinical information at any given time point relates to future risk. In the CRIC (Chronic Renal Insufficiency Cohort) study, based on 2438 older participants with established CKD and repeated values of eGFR and UACR, it was shown that using data over time improved the understanding of how changes in kidney function were associated with the risk of developing heart disease. 27 Specifically, worsening 1‐year average and slope of eGFR and UACR, captured repeatedly over time, were each associated with an increased 3‐year risk of heart disease. Our study adds to this finding by identifying changes in CKD status, mostly in UACR, through regular 5‐year screenings. Existing guidelines on CVD prevention do not recommend routine testing of UACR in otherwise healthy younger adult groups. 1 , 2 Serial monitoring of kidney function is mostly performed in those with identified CKD in routine clinical practice. Given the high prevalence and importance for risk of modest increases in UACR during young adulthood to middle age, our study would suggest that strategies to recognize and mitigate progression of UACR might yield benefit; we suggest that future studies evaluate this important question.
Screening for CKD has been suggested to be cost‐effective in populations with higher incidences of CKD, as it detects CKD in its early stages, allowing treatment that delays or prevents disease progression, and its cost‐effectiveness may be especially higher in people with diabetes and hypertension. 28 Our data provide evidence to support that routine screening for eGFR and UACR in people at average age 35 years with very low or low risk is generally helpful, as it can offer effective early support to young adults who are at risk of future poor clinical outcomes. As noted above, in addition to risk of progression to severe CKD, the excess risk of incident CVD and total mortality among participants in the low and moderate CKD risk groups compared with the very low CKD risk category are reasons that knowing eGFR and UACR at intervals throughout middle age, for example, repeated at least once over 5 years at a relatively young age, could be a useful tool for prevention. The fact that the mediation analyses attenuate the incident CVD risk offers hope that aggressive risk factor reduction would be successful in preventing future CVD, in part by altering the course of CKD progression. Hence, strategic health programs considering integrative aspects of socioeconomic factors and multiple disease conditions should be developed and implemented to promote and expand access to kidney screening and clinical care, ultimately reducing the burden of severe kidney disease, CVD, and mortality. 29
Strengths of our study include the longitudinal cohort design with high retention rate among survivors and a wide range of repeated clinical measurements. In addition, the combination of eGFR and UACR was used to identify CKD and its progression in response to the KDIGO group's recent suggestion 7 and thus would increase case ascertainment accuracy. While CKD risk category based on both eGFR and UACR at a given time point is valuable, observation of progression with serial measurements performed in the CARDIA cohort adds information. Another novelty of this study is the age of the population and ability to characterize the full spectrum of CKD progression, including subclinical risk. Our findings add to the existing evidence by suggesting a gradual increase in risk of CVD and all‐cause mortality associated with progressive CKD risk categories before becoming clinically evident in an otherwise healthy younger population.
Our study has several limitations. First, the observational nature of this study precludes causal inference. Second, although UACR is a direct measure of kidney injury, serum creatinine being in a normal range may underestimate kidney function in those with high skeletal muscle mass; 30 , 31 therefore, caution is needed when interpreting serum creatinine–based eGFR alone as a marker of kidney function. Third, cystatin C–based eGFR was not available in this study. Fourth, the present study had low power for understanding progression and risk prediction in high and very high CKD risk categories. It may happen that focus on the maximum CKD risk category attained through the current visit leads to unjustifiable clinical concern, improvement was not possible within this classification scheme. Bidirectional shifts in UACR were observed in CARDIA and would downgrade clinical risk in about 20% of the participants in the low, moderate, or high CKD risk categories. However, the cumulative classification serves to potentiate clinical action. Finally, our data included only Black and White participants, and thus our results may not be generalizable to other races and ethnicities.
In conclusion, our results demonstrate that CKD is common among younger adults and progression to more advanced CKD risk categories is higher with more severe time‐varying CKD risk category. Although most insidious subclinical progression in CKD is generally not regarded as clinically worrisome, our findings showed a graded higher risk of CVD and all‐cause mortality across increasing CKD risk category, even within the low CKD risk category (eGFR ≥60 mL/min per 1.73 m2 and UACR 10–29 mg/g). The findings of our study suggest that recognition of the presence of CKD and its progression over time could offer an opportunity for aggressive risk factor reduction to reduce CVD risk and premature death if addressed at an earlier point in the course of the disease process. This study also underscores the importance of early detection of subclinical changes in UACR; future research should explore whether initiation of more aggressive implementation of low‐risk treatment options in those with albuminuria in young adulthood would reduce downstream clinical events.
Sources of Funding
The CARDIA study is conducted and supported by the National Heart, Lung, and Blood Institute in collaboration with the University of Alabama at Birmingham (HHSN268201800005I and HHSN268201800007I), Northwestern University (HHSN268201800003I), University of Minnesota (HHSN268201800006I), and Kaiser Foundation Research Institute (HHSN268201800004I). This manuscript was reviewed by CARDIA for scientific content. The sponsor, National Heart, Lung, and Blood Institute, has a representative on the Steering Committee of CARDIA and participated in study design, data collection, and scientific review of this article. The sponsor had no role in data analysis, data interpretation, or writing of this report.
Disclosures
Dr Kramer is a consultant for Bayer pharmaceuticals. Dr Chang has served as a consultant for Novartis, Reata, and Amgen. The remaining authors have no disclosures to report.
Supporting information
Data S1
Tables S1–S2
Acknowledgments
Author contributions: study design: Drs Choi, Jacobs, and Duprez; data acquisition: Drs Choi and Jacobs; data analysis: Drs Choi and Jacobs. Each author contributed important intellectual content during manuscript drafting or revision and accepts accountability for the overall work by ensuring that questions pertaining to the accuracy or integrity of any portion of the work are appropriately investigated and resolved.
Supplemental Material is available at https://www.ahajournals.org/doi/suppl/10.1161/JAHA.122.026685
For Sources of Funding and Disclosures, see page 10.
See Editorial by Tobe
References
- 1. Grundy SM, Stone NJ, Bailey AL, Beam C, Birtcher KK, Blumenthal RS, Braun LT, de Ferranti S, Faiella‐Tommasino J, Forman DE, et al. 2018 AHA/ACC/AACVPR/AAPA/ABC/ACPM/ADA/AGS/APhA/ASPC/NLA/PCNA guideline on the Management of Blood Cholesterol: a report of the American College of Cardiology/American Heart Association task force on clinical practice guidelines. Circulation. 2019;139:e1082–e1143. doi: 10.1161/CIR.0000000000000625 [DOI] [PMC free article] [PubMed] [Google Scholar]
- 2. Arnett DK, Blumenthal RS, Albert MA, Buroker AB, Goldberger ZD, Hahn EJ, Himmelfarb CD, Khera A, Lloyd‐Jones D, McEvoy JW, et al. 2019 ACC/AHA guideline on the primary prevention of cardiovascular disease: Executive summary: a report of the American College of Cardiology/American Heart Association task force on clinical practice guidelines. Circulation. 2019;140:e563–e595. doi: 10.1161/CIR.0000000000000677 [DOI] [PMC free article] [PubMed] [Google Scholar]
- 3. GBD 2017 Risk Factor Collaborators . Global, regional, and national comparative risk assessment of 84 behavioural, environmental and occupational, and metabolic risks or clusters of risks for 195 countries and territories, 1990–2017: a systematic analysis for the global burden of disease study 2017. Lancet. 2018;392:1923–1994. doi: 10.1016/S0140-6736(18)32225-6 [DOI] [PMC free article] [PubMed] [Google Scholar]
- 4. Kidney Disease: Improving Global Outcomes (KDIGO) CKD Work Group . KDIGO 2012 clinical practice guideline for the evaluation and management of chronic kidney disease. Kidney Int Suppl. 2013;3:1–150. [Google Scholar]
- 5. Centers for Disease Control and Prevention . Chronic Kidney Disease in the United States, 2021. Atlanta, GA: US Department of Health and Human Services, Centers for Disease Control and Prevention; 2021. https://www.cdc.gov/kidneydisease/publications‐resources/CKD‐national‐facts.html. [Google Scholar]
- 6. Webster AC, Nagler EV, Morton RL, Masson P. Chronic kidney disease. Lancet. 2017;389:1238–1252. doi: 10.1016/S0140-6736(16)32064-5 [DOI] [PubMed] [Google Scholar]
- 7. Levey AS, Eckardt K‐U, Dorman NM, Christiansen SL, Cheung M, Jadoul M, Winkelmayer WC. Nomenclature for kidney function and disease: Executive summary and glossary from a kidney disease: improving global outcomes (KDIGO) consensus conference. Am J Kidney Dis. 2020;76:157–160. doi: 10.1053/j.ajkd.2020.05.005 [DOI] [PubMed] [Google Scholar]
- 8. Nichols GA, Déruaz‐Luyet A, Brodovicz KG, Kimes TM, Rosales AG, Hauske SJ. Kidney disease progression and all‐cause mortality across estimated glomerular filtration rate and albuminuria categories among patients with vs. without type 2 diabetes. BMC Nephrol. 2020;21:167. doi: 10.1186/s12882-020-01792-y [DOI] [PMC free article] [PubMed] [Google Scholar]
- 9. Saydah SH, Xie H, Imperatore G, Burrows NR, Pavkov ME. Trends in albuminuria and GFR among adolescents in the United States, 1988‐2014. Am J Kidney Dis. 2018;72:644–652. doi: 10.1053/j.ajkd.2018.04.021 [DOI] [PubMed] [Google Scholar]
- 10. Gerstein HC, Mann JF, Yi Q, Zinman B, Dinneen SF, Hoogwerf B, Hallé JP, Young J, Rashkow A, Joyce C, et al. Albuminuria and risk of cardiovascular events, death, and heart failure in diabetic and nondiabetic individuals. JAMA. 2001;286:421–426. doi: 10.1001/jama.286.4.421 [DOI] [PubMed] [Google Scholar]
- 11. Chronic Kidney Disease Prognosis Consortium . Association of estimated glomerular filtration rate and albuminuria with all‐cause and cardiovascular mortality in general population cohorts: A collaborative meta‐analysis. Lancet. 2010;375:2073–2081. doi: 10.1016/S0140-6736(10)60674-5 [DOI] [PMC free article] [PubMed] [Google Scholar]
- 12. Matsushita K, Coresh J, Sang Y, Chalmers J, Fox C, Guallar E, Jafar T, Jassal SK, Landman GWD, Muntner P, et al. Estimated glomerular filtration rate and albuminuria for prediction of cardiovascular outcomes: A collaborative meta‐analysis of individual participant data. Lancet Diabetes Endocrinol. 2015;3:514–525. doi: 10.1016/S2213-8587(15)00040-6 [DOI] [PMC free article] [PubMed] [Google Scholar]
- 13. Chang A, Kramer H. Should eGFR and albuminuria be added to the Framingham risk score? Chronic kidney disease and cardiovascular disease risk prediction. Nephron Clin Pract 2011;119:c171‐177; discussion c177‐178, DOI: 10.1159/000325669. [DOI] [PubMed] [Google Scholar]
- 14. Brantsma AH, Bakker SJL, Hillege HL, de Zeeuw D, de Jong PE, Gansevoort RT, PREVEND Study Group . Cardiovascular and renal outcome in subjects with K/DOQI stage 1‐3 chronic kidney disease: the importance of urinary albumin excretion. Nephrol Dial Transplant. 2008;23:3851–3858. doi: 10.1093/ndt/gfn356 [DOI] [PubMed] [Google Scholar]
- 15. National Kidney Foundation . K/DOQI clinical practice guidelines for chronic kidney disease: evaluation, classification, and stratification. Am J Kidney Dis. 2002;39:S1–S266. [PubMed] [Google Scholar]
- 16. Friedman GD, Cutter GR, Donahue RP, Hughes GH, Hulley SB, Jacobs DR, Liu K, Savage PJ. CARDIA: Study design, recruitment, and some characteristics of the examined subjects. J Clin Epidemiol. 1988;41:1105–1116. doi: 10.1016/0895-4356(88)90080-7 [DOI] [PubMed] [Google Scholar]
- 17. Delgado C, Baweja M, Crews DC, Eneanya ND, Gadegbeku CA, Inker LA, Mendu ML, Miller WG, Moxey‐Mims MM, Roberts GV, et al. A unifying approach for GFR estimation: Recommendations of the NKF‐ASN task force on reassessing the inclusion of race in diagnosing kidney disease. JASN. 2021;32:2994–3015. doi: 10.1681/ASN.2021070988 [DOI] [PMC free article] [PubMed] [Google Scholar]
- 18. Murtaugh MA, Jacobs DR, Yu X, Gross MD, Steffes M. Coronary artery risk development in Young adults study. Correlates of urinary albumin excretion in young adult blacks and whites: The coronary artery risk development in Young adults study. Am J Epidemiol. 2003;158:676–686. doi: 10.1093/aje/kwg208 [DOI] [PubMed] [Google Scholar]
- 19. Breitling LP, Mons U, Hahmann H, Koenig W, Rothenbacher D, Brenner H. Composite end points: implications of changing compositions with longer follow‐up. Circ Cardiovasc Qual Outcomes. 2017;10:e003458. doi: 10.1161/CIRCOUTCOMES.116.003458 [DOI] [PubMed] [Google Scholar]
- 20. Friedewald WT, Levy RI, Fredrickson DS. Estimation of the concentration of low‐density lipoprotein cholesterol in plasma, without use of the preparative ultracentrifuge. Clin Chem. 1972;18:499–502. doi: 10.1093/clinchem/18.6.499 [DOI] [PubMed] [Google Scholar]
- 21. Bancks MP, Carnethon MR, Chow LS, Gidding SS, Jacobs DR, Kishi S, Lima J, Lloyd‐Jones D, Reis JP, Schreiner PJ, et al. Fasting glucose and insulin resistance trajectories during young adulthood and mid‐life cardiac structure and function. J Diabetes Complications. 2019;33:356–362. doi: 10.1016/j.jdiacomp.2019.01.005 [DOI] [PMC free article] [PubMed] [Google Scholar]
- 22. Warnick GR, Benderson J, Albers JJ. Dextran sulfate‐Mg2+ precipitation procedure for quantitation of high‐density‐lipoprotein cholesterol. Clin Chem. 1982;28:1379–1388. doi: 10.1093/clinchem/28.6.1379 [DOI] [PubMed] [Google Scholar]
- 23. American Diabetes Association . Diagnosis and classification of diabetes mellitus. Diabetes Care. 2014;37(Suppl 1):S81–S90. doi: 10.2337/dc14-S081 [DOI] [PubMed] [Google Scholar]
- 24. Thyagarajan B, Jacobs DR, Apostol GG, Smith LJ, Jensen RL, Crapo RO, Barr RG, Lewis CE, Williams OD. Longitudinal association of body mass index with lung function: The CARDIA study. Respir Res. 2008;9:31. doi: 10.1186/1465-9921-9-31 [DOI] [PMC free article] [PubMed] [Google Scholar]
- 25. Matsushita K, Jassal SK, Sang Y, Ballew SH, Grams ME, Surapaneni A, Arnlov J, Bansal N, Bozic M, Brenner H, et al. Incorporating kidney disease measures into cardiovascular risk prediction: Development and validation in 9 million adults from 72 datasets. EClinicalMedicine. 2020;27:100552. doi: 10.1016/j.eclinm.2020.100552 [DOI] [PMC free article] [PubMed] [Google Scholar]
- 26. Nitsch D, Grams M, Sang Y, Black C, Cirillo M, Djurdjev O, Iseki K, Jassal SK, Kimm H, Kronenberg F, et al. Associations of estimated glomerular filtration rate and albuminuria with mortality and renal failure by sex: A meta‐analysis. BMJ. 2013;346:f324. doi: 10.1136/bmj.f324 [DOI] [PMC free article] [PubMed] [Google Scholar]
- 27. Cohen JB, Yang W, Li L, Zhang X, Zheng Z, Orlandi P, Bansal N, Deo R, Lash JP, Rahman M, et al. Time‐updated changes in estimated GFR and proteinuria and Major adverse cardiac events: Findings from the chronic renal insufficiency cohort (CRIC) study. Am J Kidney Dis. 2022;79:36–44.e1. doi: 10.1053/j.ajkd.2021.03.021 [DOI] [PMC free article] [PubMed] [Google Scholar]
- 28. Komenda P, Ferguson TW, Macdonald K, Rigatto C, Koolage C, Sood MM, Tangri N. Cost‐effectiveness of primary screening for CKD: A systematic review. Am J Kidney Dis. 2014;63:789–797. doi: 10.1053/j.ajkd.2013.12.012 [DOI] [PubMed] [Google Scholar]
- 29. Boehmer KR, Abu Dabrh AM, Gionfriddo MR, Erwin P, Montori VM. Does the chronic care model meet the emerging needs of people living with multimorbidity? A systematic review and thematic synthesis. PLoS One. 2018;13:e0190852. doi: 10.1371/journal.pone.0190852 [DOI] [PMC free article] [PubMed] [Google Scholar]
- 30. Patel SS, Molnar MZ, Tayek JA, Ix JH, Noori N, Benner D, Heymsfield S, Kopple JD, Kovesdy CP, Kalantar‐Zadeh K. Serum creatinine as a marker of muscle mass in chronic kidney disease: Results of a cross‐sectional study and review of literature. J Cachexia Sarcopenia Muscle. 2013;4:19–29. doi: 10.1007/s13539-012-0079-1 [DOI] [PMC free article] [PubMed] [Google Scholar]
- 31. Narva AS, Bilous RW. Laboratory assessment of diabetic kidney disease. Diabetes Spectr. 2015;28:162–166. doi: 10.2337/diaspect.28.3.162 [DOI] [PMC free article] [PubMed] [Google Scholar]
Associated Data
This section collects any data citations, data availability statements, or supplementary materials included in this article.
Supplementary Materials
Data S1
Tables S1–S2