

Abstract
Background
Coronary physiology measurement in serial coronary lesions with multiple stenoses is challenging. Therefore, we evaluated the feasibility of Murray fractal law‐based quantitative flow ratio (μQFR) virtual stenting for guidance of serial coronary lesions intervention.
Methods and Results
Patients who underwent elective coronary angiography and had 2 serial de novo coronary lesions of 30% to 90% diameter stenosis by visual estimation were prospectively enrolled. μQFR and fractional flow reserve (FFR) were assessed after coronary angiography. In vessels with an FFR ≤0.80, the lesion with the larger pressure gradient was considered to be the primary lesion and treated firstly, followed by FFR measurement. The second lesion was stented when FFR ≤0.80. All μQFR and predicted μQFR after stenting were calculated from diagnostic coronary angiography before interventions, with the analysts masked to the FFR data. A total of 54 patients with 61 target vessels were interrogated. Percutaneous coronary intervention was performed in 44 vessels with FFR ≤0.80. After stenting the primary lesions, 14 nonprimary lesions had FFR ≤0.80 and a second drug‐eluting stent was implanted. There was excellent correlation (r=0.97, P<0.001) and good agreement (mean difference: 0.00±0.03) between baseline μQFR and FFR in identifying flow‐limiting lesions. Per‐vessel diagnostic accuracy of μQFR on de novo lesions was 96.7% (95% CI, 88.7%–99.6%). μQFR and FFR are highly consistent (93.2%) in identifying the primary lesion requiring revascularization. After stenting the primary lesions, per‐vessel diagnostic accuracy of predicted μQFR for identifying the significance of the nonprimary lesion was 90.9%. Predicted residual μQFR with virtual stenting was higher than final FFR (mean difference: 0.05±0.06).
Conclusions
In vessels with serial coronary lesions, virtual stenting by μQFR can identify the primary flow‐limiting lesion for revascularization.
Keywords: quantitative flow ratio, serial coronary lesions, virtual stenting
Subject Categories: Diagnostic Testing, Imaging, Percutaneous Coronary Intervention
Nonstandard Abbreviations and Acronyms
- FFR
fractional flow reserve
- μQFR
Murray fractal law‐based quantitative flow ratio
Clinical Perspective.
What Is New?
Computation of Murray fractal law‐based quantitative flow ratio based on a single angiographic view can provide an easy and accurate result especially in patients with diffuse lesions.
Our study focuses on the feasibility of virtual stenting by Murray fractal law‐based quantitative flow ratio for guidance of serial coronary lesions intervention.
What Are the Clinical Implications?
Virtual stenting by Murray fractal law‐based quantitative flow ratio will be a simple noninvasive evaluation method for the guidance of serial coronary lesions intervention without administration of hyperemic drugs and easily applied before intervention.
The clinical utility of coronary physiology measurement to guide percutaneous coronary intervention (PCI) is now widely recognized. Fractional flow reserve (FFR) is the most commonly used method by measuring intracoronary pressure during maximal hyperemia induced by vasodilating agents. 1 FFR‐based management strategy has been established as physiological standard to guide PCI in most of the catheterization laboratories. 2 , 3
While in serial coronary lesions with multiple stenoses, FFR measurement is still challenging. 4 , 5 The occurrence of crosstalk phenomenon between multiple stenoses may influence clinical decision making. Currently, the recommended proposal for serial coronary lesions requires a step by‐step approach: treating the primary lesion with the greatest pressure gradient, followed by repeated FFR remeasurement and treating the next lesion as indicated. 6 These repeated procedures might increase the procedure time and the incidence of side effect due to vasodilators. Quantitative flow ratio (QFR) is an angiographically derived FFR based on angiographic reconstruction and fluid dynamics algorithms. 7 , 8 QFR assessment does not need pressure‐wire and hyperemia induction. The recently upgraded QFR analysis software supports automatic detection of side branches for the integration of μQFR, which could improve the reconstruction of reference vessel size by using step‐down reference diameter function and hence, improved its diagnostic accuracy. 9
Virtual stenting technique simulate the effect of stent implantation in selected segments using predicted value of residual QFR. The predicted residual QFR corresponds to the QFR value as if the selected segment had been completely revascularized. This technique could be applied to serial lesions with multiple stenoses in 1 coronary vessel.
Thus, the aim of the present study was to test the diagnostic performances of the virtual stenting technique derived from μQFR in guiding the intervention of serial coronary lesions with FFR as the reference standard.
METHODS
The data that support the findings of this study are available from the corresponding author upon reasonable request.
Study Population
Between March 2019 and September 2020, patients who underwent elective coronary angiography and had 2 serial stenoses of 30% to 90% diameter stenosis by visual assessment in the same epicardial coronary artery (vessel size >2 mm in diameter) were prospectively enrolled in a single center (Huadong Hospital, Affiliated to Fudan University, China). Each lesion should be separated by an angiographically normal‐looking segment of at least 10 mm. Exclusion criteria included the following: left main disease, presence of coronary artery bypass grafts, presence of contraindications to the use of adenosine, severe comorbidities, severe renal insufficiency, severe coagulation disorders, accompanied by other diseases with life expectancy <6 months. The study protocol was approved by the Ethics Committee of Huadong Hospital, Affiliated to Fudan University, China, and all participants provided written informed consent. The study was registered on Chinese Clinical Trial Registry under the identifier ChiCTR‐INR‐17011360.
Coronary Angiography
Angiographic images were recorded at 15 frames/s by monoplane radiographic systems (AXIOM Artis, Siemens Healthcare, Erlangen, Germany). Two projection views at different angles with >25 degrees were required for angiographic image acquisition. The contrast medium was injected manually with a stable and forceful injection, as previously described. 8
FFR Measurement and PCI Decision
After coronary angiography, FFR measurement was performed when the operator considered the lesion met the inclusion criteria. FFR was measured using a pressure wire (St. Jude Medical, Saint Paul, MN) initially distal to the most distal lesion in the distal part of the culprit lesion. FFR was calculated as the ratio between the average distal pressure and the average aortic pressure recorded during maximal hyperemia induced by injection of ATP via the antecubital vein at 160 μg/L per minute. Pressure data were recorded for at least 3 seconds of stable value before ATP administration and at least 10 seconds of stable value during hyperemia. The pressure wire was returned to the initial part of the guiding catheter to exclude pressure drift during hyperemia. Drift range <0.03 was accepted, otherwise FFR measurement needed to be performed again. Functional significance was defined with the threshold of FFR value ≤0.80; in vessels with an FFR value ≤0.80, the lesion that caused the larger pressure step‐up (ΔFFR) was stented firstly. After stenting to the primary lesion, FFR was measured again and the second lesion was stented with the FFR value ≤0.80. FFR was measured finally after all of the stents were implanted. All PCI procedures were performed using drug‐eluting stents (DES). All pressure tracings were recorded on the RadiAnalyzer Xpress (St. Jude Medical) for offline analysis.
Quantitative Coronary Analysis and QFR Analysis and Virtual Stenting
All angiographic data were analyzed at an academic core laboratory (CardHemo, Shanghai Jiao Tong University, Shanghai) using the QFR system (AngioPlus Galley 2.0, Pulse Medical, Shanghai, China) by certified analysts, with intra‐ and inter‐observer variability of 0.00±0.03 and 0.00±0.03 for μQFR analysis as previously reported. 10 Quantitative coronary analysis and μQFR were performed on pre‐PCI angiograms during the same procedure with the following steps: (1) the analyst selected an angiographic image run with minimal overlap and foreshortening and the software automatically detected the path of contrast dye filling, from which the contrast flow velocity was determined; (2) the lumen contours of the interrogated vessel and its side branches were automatically delineated and manually corrected if the contours did not follow the true lumen edge; (3) a second angiographic view was selected and the interrogated vessel was automatically delineated; (4) the software reconstructed the interrogated vessel in 3‐dimensional as well as the reference vessel using step‐down reference diameter function; (5) the software computed the μQFR based on the reconstructed vessel and the contrast flow velocity at every location along the interrogated vessel. 10 At the same step, quantitative coronary analysis parameters including minimal lumen diameter, percent diameter stenosis, lesion length, and reference vessel diameter were reported by the software, as well as the virtual μQFR pullback. The distal landmark of μQFR analysis was placed at the sensor position of the pressure wire on the angiographic images. All analyses were performed at core laboratory by 2 independent certified operators masked to the FFR values. Predicted μQFR with virtual stenting was calculated using pre‐PCI angiograms. ΔμQFR of all of the lesions with “virtually implant the stent” was obtained. “Virtually implant the stent” was marked with using the stent length at the exact location of the implantation site marked with a proximal and distal marker. The original vessel μQFR plus ΔμQFR of all treated lesions was the residual μQFR with virtual stenting (Figure 1).
Figure 1. Virtual stenting by μQFR calculation method.
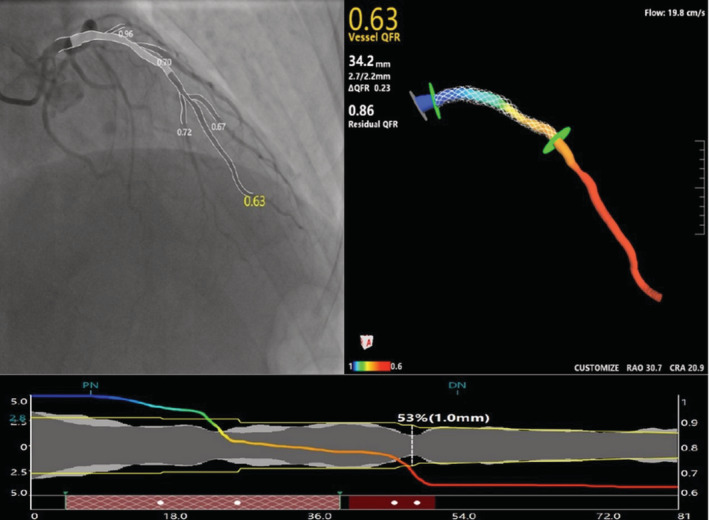
First, a μQFR analysis was performed from before the percutaneous coronary intervention (PCI) with a 3‐dimensional vessel reconstruction (upper parts of the panel). Second, virtually treated zone was selected on the μQFR diagram (red gridlines) (lower parts of the panel). Third, predicted residual μQFR after virtually implanted a stent was obtained (upper right parts of the panel).
Subject Flowchart and Case Examples
Figure 2 presented the study subject flowchart. First FFR and QFR measurement were performed to all lesions meeting the inclusion criteria. Predicted residual μQFR with virtual stenting was analyzed and recorded for further comparison. PCI was not indicated if the FFR was >0.80. PCI was performed if FFR value was ≤0.80. Lesion with the higher ΔFFR was regarded as the primary lesion and treated firstly. After stenting to the primary lesion, a second FFR was measured. If the second FFR value was ≤0.80, PCI to the nonprimary lesion was indicated and then a third FFR was measured after PCI to the second lesion. All the μQFR analyses were masked to the FFR results. Figure 3 presented a typical case of FFR and virtual stenting by μQFR guidance of serial coronary lesions intervention.
Figure 2. Study flowchart.
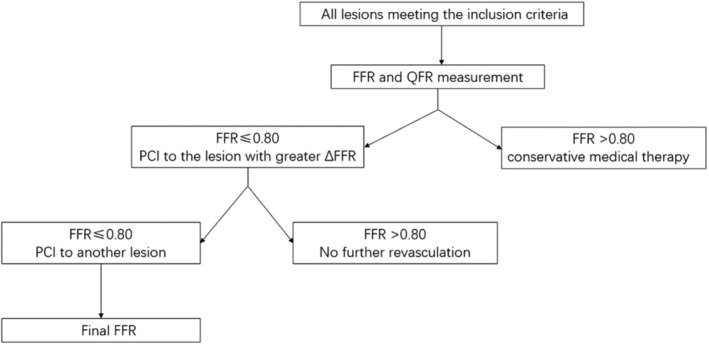
FFR indicates fractional flow reserve; PCI; percutaneous coronary intervention; and QFR, quantitative flow ratio.
Figure 3. Representative case of FFR (fractional flow reserve) and virtual stenting by μQFR for guidance of serial coronary lesions intervention.
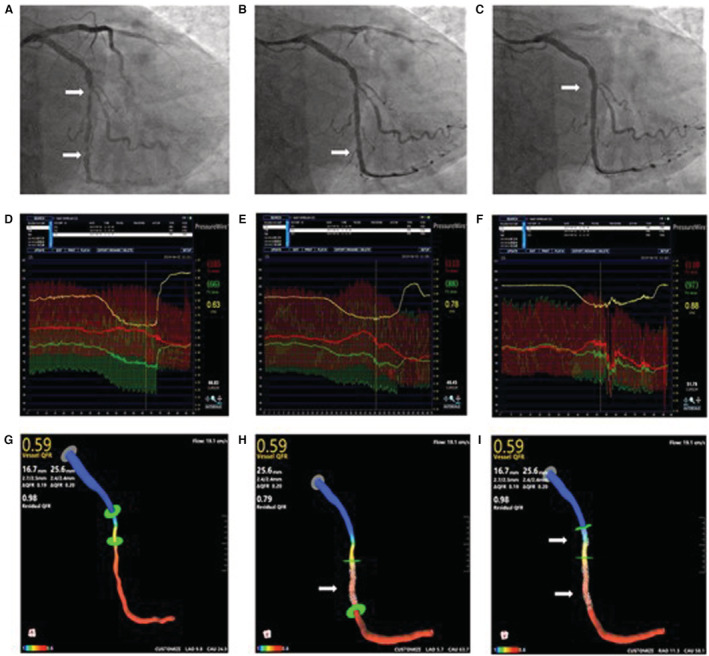
A, Angiography showed a serial lesion (white arrow) in the left circumflex artery. B, A drug‐eluting stent was implanted in the distal lesion (white arrow). C, The other drug‐eluting stent was implanted in the proximal lesion (white arrow). D, The first FFR value was 0.63, ΔFFR of proximal lesion was 0.07, ΔFFR of distal lesion was 0.21. E, A second FFR value was measured after implantation of the first stent, FFR value was 0.78. F, The final FFR was 0.88. G, μQFR at the distal left circumflex position was 0.59. H, Predicted residual μQFR after virtually implanted a stent (white arrow) to the primary lesion was 0.79. I, Predicted μQFR after virtually implanted another stent (white arrow) to the nonprimary lesion was 0.98.
Statistical Analysis
Data were expressed as mean±SD for continuous variables and percentages for categorical variables. Correlation between μQFR and FFR was determined by Pearson correlation coefficient (r) and Bland–Altman analyses were performed for consistency analysis. The receiver‐operating curves of μQFR as analyzed with the observed FFR as gold standard in the vessel level. The value of P<0.05 was considered as significant. All statistical analyses and graphs were performed using MedCalc (Version 19.4, Ostend, Belgium).
RESULTS
Baseline Patient and Lesion Characteristics
Between March 2019 and September 2020, a total of 54 patients were successfully screened and enrolled, 7 patients were 2‐vessel disease, a total of 61 interrogated vessels were finally enrolled for analysis. According to the results of the first FFR measurement, FFR value were ≤0.80 in 44 vessels and DES was implanted in the primary lesion with greater ΔFFR (25 in proximal lesion,19 in distal lesion). Seventeen lesions with FFR value >0.8 remained untreated. A second DES was implanted in 14 lesions when the second FFR value was ≤0.80 after the first DES was deployed. All patients completed postoperative FFR measurement.
Table 1 summarizes the baseline and vessel clinical characteristics of the enrolled patients. Mean age of the patients was 72.3±7.2 years, 41 (75.9%) were women, 10 (18.5%) had diabetes, and 4 (7.4%) had a previous myocardial infarction; 41 (61.2%) interrogated vessels were left anterior descending arteries.
Table 1.
Baseline Clinical and Vessel Characteristics of the Enrolled Patients
| Patients | (n=54) |
|---|---|
| Age, y | 72.3±7.2 |
| Men | 41 (75.9) |
| Risk factors (%) | |
| Hypertension | 40 (74.0) |
| Hyperlipidemia | 29 (53.7) |
| Diabetes | 10 (18.5) |
| Current smoker | 9 (16.7) |
| Medical history (%) | |
| Prior MI | 4 (7.4) |
| Prior PCI | 5 (9.3) |
| CKD | 6 (11.1) |
| Clinical presentation (%) | |
| Stable ischemic heart disease non‐ST segment elevation | 49 (90.7) |
| Acute coronary syndrome | 5 (9.3) |
| Vessels | (n=61) |
|---|---|
| Location | |
| Left anterior descending | 41 (67.2) |
| Left circumflex | 9 (14.8) |
| Right coronary | 11 (18.0) |
| Proximal reference vessel diameter, mm | 3.0±0.5 |
| Proximal lesion length | 21.0±0.4 |
| Proximal lesion diameter stenosis, % | 47.7±10.4 |
| Distal reference vessel diameter, mm | 2.5±0.4 |
| Distal lesion length | 18.7±0.7 |
| Distal lesion diameter stenosis, % | 47.2±11.2 |
| FFR | 0.74±0.13 |
| QFR | 0.74±0.20 |
Data presented as n (%) or mean±SD. CKD indicates chronic kidney disease; FFR, fractional flow reserve; MI, myocardial infarction; PCI, percutaneous coronary intervention; and QFR, quantitative flow ratio.
Correlation and Agreement Between Baseline μQFR and FFR for Evaluation of the Hemodynamic Significance of the Target Vessel
There was excellent correlation between baseline μQFR and FFR for evaluation of the significance of the target vessel (correlation coefficient r=0.97, P<0.001, Figure 4A). The Bland–Altman plot showed a good agreement between baseline μQFR and FFR was also observed between baseline μQFR and FFR (mean difference: 0.00±0.03, Figure 4B).
Figure 4. Correlation and agreement between the gradient through the baseline vessel and the proximal distal lesion measured by using Murray fractal law‐based quantitative flow ratio (μQFR) and FFR (fractional flow reserve).
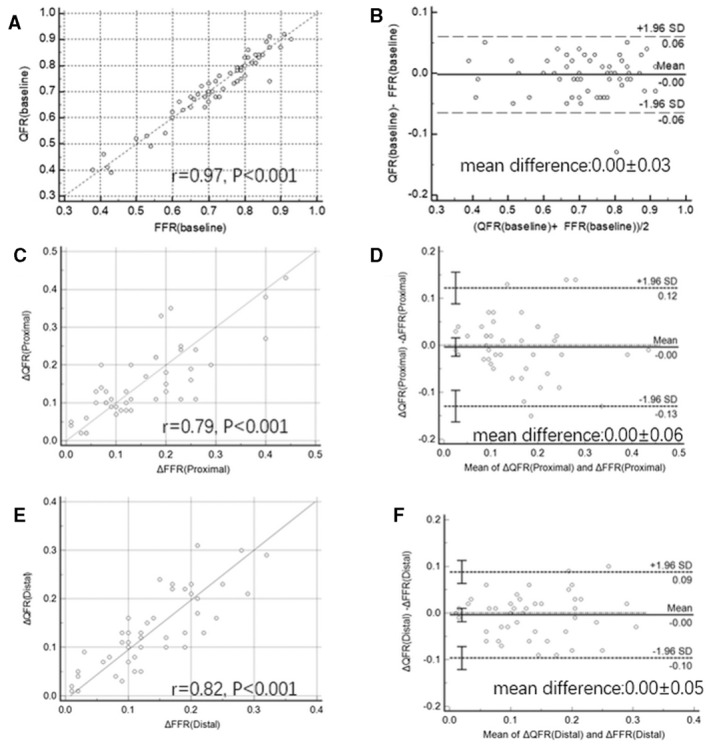
A, Correlation between baseline μQFR and FFR; (B) Agreement between baseline μQFR and FFR; (C) Correlation between ΔμQFR and ΔFFR of the proximal lesion; (D) Agreement between baseline ΔμQFR and ΔFFR of the proximal lesion. E, Correlation between ΔμQFR and ΔFFR of the distal lesion; (F) Agreement between baseline ΔμQFR and ΔFFR of the primary lesion. FFR indicates fractional flow reserve; and QFR, quantitative flow ratio.
Diagnostic Performance of μQFR for Identifying the Hemodynamic Significance of Serial Lesions at Baseline
Based on baseline images and using baseline FFR as gold standard, the area under the receiver operating characteristic curve for μQFR of proximal lesion was 0.99 and 0.99 of distal lesion. Per‐vessel diagnostic accuracy of μQFR at baseline was 96.7% (95% CI, 88.7%–99.6%), sensitivity and specificity of μQFR at baseline was 100% (95% CI, 92.0%–100.0%) and 88.2% (95% CI, 63.6%–98.5%) (Table 2). Discordance of μQFR with FFR occurred in 2 (3.3%) vessels and all of the discordance was FFR >0.80 but μQFR ≤0.80.
Table 2.
Diagnostic Performance of μQFR ≤0.8 for Identifying the Significance of Serial Lesions at Baseline and QFR (Predicted) ≤0.8 for Identifying the Significance of the Nonprimary Lesion
| μQFR at baseline | QFR (Predicted) for the nonprimary lesion | |
|---|---|---|
| Accuracy | 96.7 (88.7–99.6) | 90.9 (78.3–97.4) |
| Sensitivity | 100.0 (92.0–100.0) | 71.4 (41.9–91.6) |
| Specificity | 88.2 (63.6–98.5) | 100.0 (88.4–100.0) |
| PPV | 95.7 (85.7–98.8) | 100.0 |
| NPV | 100.0 (100–100.0) | 88.2 (76.6–94.5) |
NPV indicates negative predicted value; and PPV, positive predicted value.
Comparison in Judging the Primary Lesion by Using μQFR and FFR
μQFR and FFR are highly consistent (93.2%) in judging the primary lesion by comparing the gradient through the proximal and distal lesion. One proximal lesion (4.0%) and 2 distal lesions (10.5%) were inconsistent by using μQFR and FFR.
Correlation and Agreement Between the Gradient Through the Proximal and Distal Lesion Measured by Using μQFR and FFR
ΔμQFR and ΔFFR of the proximal lesion were 0.15±0.10 and 0.15±0.10, respectively (P=0.71). There was good correlation between ΔμQFR and ΔFFR of the proximal lesion (correlation coefficient r=0.79, P<0.001) (Figure 4C). The Bland–Altman plot showed a mean difference of 0.00±0.06 between ΔQFR and ΔFFR of the proximal lesion (Figure 4D).
ΔμQFR and ΔFFR of the distal lesion were 0.13±0.08 and 0.14±0.08, respectively (P=0.56). There was good correlation between ΔμQFR and ΔFFR of the distal lesion (correlation coefficient r=0.82, P<0.001) (Figure 4E). The Bland–Altman plot showed a mean difference of 0.00±0.05 between ΔμQFR and ΔFFR of the distal lesion (Figure 4F).
Correlation and Agreement Between the Predicted μQFR and the Observed FFR After Stenting of the Primary Lesion
After the implantation of the first stent, the second FFR was considered to be FFR (Observed) (observed FFR of the non‐primary lesion), while baseline μQFR plus ΔμQFR of the primary lesion was considered to be QFR (Predicted) (predicted μQFR of the non‐primary lesion).
The QFR (Predicted) value was higher than the FFR (Observed) (0.87±0.06 versus 0.83±0.07, P<0.001).
There was good correlation between QFR (Predicted) and FFR (Observed) (correlation coefficient r=0.62, P<0.001) (Figure 5A). The Bland–Altman plot showed a mean difference of 0.03±0.09 between QFR (predicted) and FFR (Observed) (Figure 5B).
Figure 5. Correlation and agreement between the predicted μQFR and the observed fractional flow reserve (FFR) after stenting of the primary lesion and predicted μQFR with virtual stenting and final FFR.
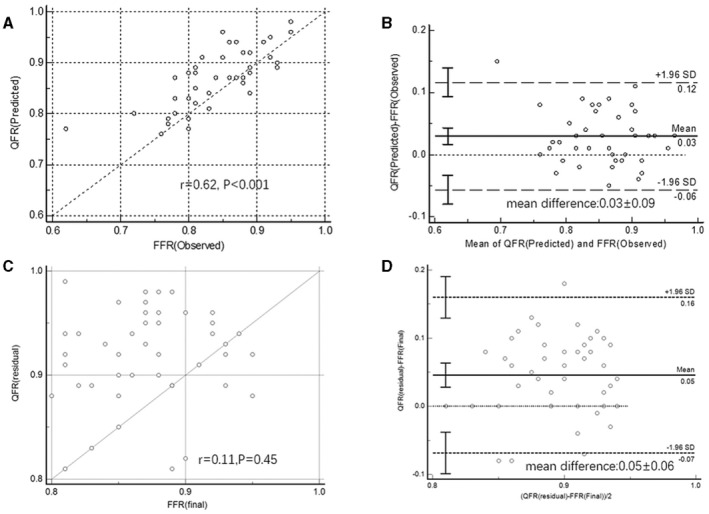
A, Correlation between QFR (Predicted) (predicted μQFR) and FFR (Observed) (the observed FFR) of the nonprimary lesion; (B) Agreement between QFR (Predicted) and FFR (Observed) of the nonprimary lesion; (C) Correlation between QFR (residual) (predicted residual μQFR) and FFR (final) (final FFR); (D) Agreement between QFR (residual) and FFR (final). FFR indicates fractional flow reserve; and QFR, quantitative flow ratio.
Diagnostic Performance of Predicted QFR for Identifying the Hemodynamic Significance of the Nonprimary Lesion After Stenting of the Primary Lesion
Using FFR (Observed) as the gold standard, AUC area under receiver operating characteristic for QFR (Predicted) to identify the hemodynamic significance of the nonprimary lesion after stenting of the primary lesion was 0.94. With the threshold value ≤0.80, per‐vessel diagnostic accuracy of QFR (Predicted) for identifying the hemodynamic significance of the nonprimary lesion after stenting of the primary lesion was 90.9% (95% CI, 78.3%–97.4%), sensitivity and specificity of QFR (Predicted) for the nonprimary lesion was 71.4% (95% CI, 41.9%–91.6%) and 100.0% (95% CI, 88.4%–100.0%). Discordance of the QFR (Predicted) and FFR (Observed) occurred in 4 vessels and 10 vessels, respectively, and all of the discordance was observed FFR ≤0.80 but QFR (Predicted) or FFR >0.80 (Table 2).
Correlation and Agreement Between Predicted Residual QFR With Virtual Stenting and Final FFR
Correlation between QFR (residual) (predicted residual μQFR with virtual stenting) and FFR (final) (value of the last FFR) was not good (correlation coefficient r=0.11, P=0.45) (Figure 5C). QFR (residual) was higher than FFR (final) (mean difference: 0.05±0.06) (Figure 5D).
DISCUSSION
The main findings of the current study were: (1) μQFR showed a high per‐vessel diagnostic accuracy at baseline. (2) μQFR and FFR are highly consistent in judging the primary lesion by comparing the gradient through the proximal and distal lesion. (3) Predicted μQFR showed a good diagnostic accuracy for identifying the hemodynamic significance of the nonprimary lesion after stenting of the primary lesion.
Serial coronary lesions were not uncommon, especially in aging patients or patients with diabetes, the prevalence may be up to 25%. 11 FFR is a well‐established physiologic assessment method to determine hemodynamic significance of coronary stenosis, but clinical application of FFR in vessels with serial coronary lesions is not easy. 12 In cases of serial lesions, one stenosis can influence FFR value of another lesion, the functional significance of each stenosis may be underestimated by simply using delta FFR value in single pullback curve. 13 Therefore, the FFR value of a nonprimary lesion should be reassessed after the treatment of a primary lesion. A repeated measurement of FFR after stenting the primary target lesion is necessary. These procedures make the whole intervention process more complex and time‐consuming. Additionally, the administration of ATP to obtain maximal hyperemia may cause nausea and bradycardia. The application of FFR in serial lesions is limited because of the mentioned disadvantages. The instantaneous wave‐free ratio is an alternative pressure‐based coronary physiological index that does not require adenosine to obtain hyperemia. 14 An instantaneous wave‐free ratio pullback curve provides a physiological significance of lesion severity in serial lesions and can be used to predict the physiological outcome postvirtual PCI with a high degree of accuracy. 15 , 16 However, instantaneous wave‐free ratio–based virtual PCI prediction model was performed in a mechanized manner using pullback device and the relationship between post‐PCI instantaneous wave‐free ratio values and patient outcomes is not yet well established.
QFR is a novel approach to estimate coronary physiology easily and quickly by using resting invasive coronary angiography without using maximal epicardial vasodilation or additional pressure wire. QFR has the potential to simplify the functional evaluation of coronary stenoses. 7 , 8 QFR‐guided strategy of lesion selection could improve 1‐year clinical outcomes compared with standard angiography among patients undergoing PCI guidance. 17 As previously mentioned, virtual stenting by μQFR could be helpful in decision for stent size and the appropriate position to obtain an optimal functional result. Computation of μQFR based on a single angiographic view can provide an easy and accurate result especially in patients with diffuse lesions where it was not always possible to obtain 2 angiographic views both with good exposure of all lesions in the interrogated vessels. 10 Our study focuses on the feasibility of virtual stenting by μQFR for guidance of serial coronary lesions intervention. The following 3 clinical issues need to be clarified before or during the intervention of serial coronary lesions: first, whether or not the target vessel is functional significant; second, which lesion is the primary lesion in the serial lesion; third, whether or not further intervention to nonprimary is necessary after intervention of the primary lesion. Virtual stenting by μQFR could provide solutions to these questions. The feasibility and accuracy of QFR in identifying hemodynamically significant vessels was already verified in several trials, while our study showed similar conclusions. We also demonstrated that virtual stenting by μQFR could determine the proper target primary lesions for revascularization by comparing the pressure gradient through the proximal and distal lesion. μQFR and FFR are highly consistent in judging the primary lesion. Delta μQFR and delta FFR of the proximal and the distal lesion correlated well. Unlike hyperemic flow velocity, resting flow velocity remains stable after successful dilatation of an epicardial lesion and trans‐stenotic pressure gradient in the remaining lesion is largely unchanged. 18 QFR is also derived from resting images, no correction for the interaction of serial lesions is reasonable. The mean difference between predicted μQFR of the primary lesion and the real observed FFR value after stenting the primary lesion was only 0.03 in our study. The accuracy of predicted μQFR for identifying the hemodynamic significance of the nonprimary lesion after stenting of the primary lesion was 90.9%. A second QFR examination may not be required after stenting of primary lesion especially when predicted μQFR is ≤0.80 as specificity of predicted μQFR was 100% in our study. Therefore, Virtual stenting by μQFR can be applied in serial coronary lesions as an alternative for FFR. In addition to the benefits of avoiding vasodilates or pressure wire, Virtual stenting by μQFR can also provide μQFR pullback curve matching the anatomy of the coronary artery, it is convenient for the interventional cardiologist to decide which lesion to treat and show the length of the specific lesion segment.
Rubimbura et al retrospectively analyzed residual QFR originated from virtual stenting using the images in the DOCTORS (Does Optical Coherence Tomography Optimize Result of Stenting) multicentric study. The results showed a good correlation between predicted residual μQFR originated from virtual stenting and poststenting FFR, the mean differences of which was only about 0.01. 19 However, our study indicated the predicted residual μQFR originated from virtual stenting was higher than final real FFR, with the mean differences as 0.05. Predicted residual μQFR originated from virtual stenting was calculated on the assumption that the stent diameter was adapted to the vessel size and deployed optimally and all of the diseased lesions were contained in the virtually treated zone. In the real world, occurrence of significant residual focal lesions, underexpansion, and malapposition may made the FFR value not perfect especially in the serial lesions. 20 Recently, Ding et al showed that on average the predicted OCT (optical coherence tomography)‐based FFR was 0.04 lower than the actual post‐PCI FFR and there was significant correlation between minimum stent expansion index and intra‐stent pressure drop. 21 Candreva et al characterized hemodynamics of serial coronary stenoses using FFR pullback pressure gradients, only 40% serial lesions presented typical 2 pressure drops, 22 diffuse lesions commonly occurred between the primary and nonprimary lesion. In addition, the differences caused by the effects of interaction of serial lesions cannot be completely excluded. Virtual stenting by μQFR could be applied for guidance of serial coronary lesions, but the predicted residual μQFR originated from virtual stenting should be interpreted with caution. Further investigation will further optimize the algorithm of residual μQFR originated from virtual stenting to minimize interaction of serial lesions.
Our study had several limitations. First, our study was conducted in only 1 site, the numbers of enrolled patients were relatively small, only 14 patients received a second stent implantation, the conclusions might be underpowered. Second, diffuse lesions were not included in our study, serial coronary lesions separated by absolutely normal segment is rare in the real world. Third, there were no follow‐up results in our study, a prospective study of serial coronary lesion guided by virtual stenting by μQFR was needed for further examination.
Sources of Funding
This work was supported by the Clinical Research Plan of Shanghai Health and Family Planning Commission (No 201840278 and 202040298), Shanghai Shenkang Clinical Research Plan (16CR3035A and SHDC2020CR3024B), Shanghai Municipal Key Clinical Specialty (shslczdzk02801).
Disclosures
Tu is a consultant of Pulse Medical and received research grants from Pulse Medical. The remaining authors have no disclosures to report.
Acknowledgments
All those acknowledged have seen and approved mention of their names in this article.
For Sources of Funding and Disclosures, see page 9.
See Editorial by Sumaya et al.
Contributor Information
Shengxian Tu, Email: sxtu@sjtu.edu.cn.
Xinkai Qu, Email: qxkchest@126.com.
REFERENCES
- 1. Corcoran D, Hennigan B, Berry C. Fractional flow reserve: a clinical perspective. Int J Cardiovasc Imaging. 2017;33:961–974. doi: 10.1007/s10554-017-1159-2 [DOI] [PMC free article] [PubMed] [Google Scholar]
- 2. Park SJ, Ahn JM, Park GM, Cho YR, Lee JY, Kim WJ, Han S, Kang SJ, Park DW, Lee SW, et al. Trends in the outcomes of percutaneous coronary intervention with the routine incorporation of fractional flow reserve in real practice. Eur Heart J. 2013;34:3353–3361. doi: 10.1093/eurheartj/eht404 [DOI] [PubMed] [Google Scholar]
- 3. Pijls NH, De Bruyne B, Peels K, Van Der Voort PH, Bonnier HJ, Bartunek JKJJ, Koolen JJ. Measurement of fractional flow reserve to assess the functional severity of coronary‐artery stenoses. N Engl J Med. 1996;334:1703–1708. doi: 10.1056/NEJM199606273342604 [DOI] [PubMed] [Google Scholar]
- 4. Pijls NH, De Bruyne B, Bech GJ, Liistro F, Heyndrickx GR, Bonnier HJ, Koolen JJ. Coronary pressure measurement to assess the hemodynamic significance of serial stenoses within one coronary artery: validation in humans. Circulation. 2000;102:2371–2377. doi: 10.1161/01.CIR.102.19.2371 [DOI] [PubMed] [Google Scholar]
- 5. Modi BN, De Silva K, Rajani R, Curzen N, Perera D. Physiology‐guided management of serial coronary artery disease: a review. JAMA Cardiol. 2018;3:432–438. doi: 10.1001/jamacardio.2018.0236 [DOI] [PubMed] [Google Scholar]
- 6. Kim HL, Koo BK, Nam CW, Doh JH, Kim JH, Yang HM, Park KW, Lee HY, Kang HJ, Cho YS, et al. Clinical and physiological outcomes of fractional flow reserve‐guided percutaneous coronary intervention in patients with serial stenoses within one coronary artery. JACC Cardiovasc Interv. 2012;5:1013–1018. doi: 10.1016/j.jcin.2012.06.017 [DOI] [PubMed] [Google Scholar]
- 7. Tu S, Westra J, Yang J, von Birgelen C, Ferrara A, Pellicano M, Nef H, Tebaldi M, Murasato Y, Lansky A, et al. Diagnostic accuracy of fast computational approaches to derive fractional flow reserve from diagnostic coronary angiography: the international multicenter FAVOR pilot study. JACC Cardiovasc Interv. 2016;9:2024–2035. doi: 10.1016/j.jcin.2016.07.013 [DOI] [PubMed] [Google Scholar]
- 8. Xu B, Tu S, Qiao S, Qu X, Chen Y, Yang J, Guo L, Sun Z, Li Z, Tian F, et al. Diagnostic accuracy of angiography‐based quantitative flow ratio measurements for online assessment of coronary stenosis. J Am Coll Cardiol. 2017;70:3077–3087. doi: 10.1016/j.jacc.2017.10.035 [DOI] [PubMed] [Google Scholar]
- 9. Tu S, Echavarria‐Pinto M, von Birgelen C, Holm NR, Pyxaras SA, Kumsars I, Lam MK, Valkenburg I, Toth GG, Li Y, et al. Fractional flow reserve and coronary bifurcation anatomy: a novel quantitative model to assess and report the stenosis severity of bifurcation lesions. JACC Cardiovasc Interv. 2015;8:564–574. doi: 10.1016/j.jcin.2014.12.232 [DOI] [PubMed] [Google Scholar]
- 10. Tu S, Ding D, Chang Y, Li C, Wijns W, Xu B. Diagnostic accuracy of quantitative flow ratio for assessment of coronary stenosis significance from a single angiographic view: a novel method based on bifurcation fractal law. Catheter Cardiovasc Interv. 2021;97(suppl 2):1040–1047. doi: 10.1002/ccd.29592 [DOI] [PubMed] [Google Scholar]
- 11. Di Sciascio G, Patti G, Nasso G, Manzoli A, D'Ambrosio A, Abbate A. Early and long‐term results of stenting of diffuse coronary artery disease. Am J Cardiol. 2000;86:1166–1170. doi: 10.1016/S0002-9149(00)01197-8 [DOI] [PubMed] [Google Scholar]
- 12. Kumbhani DJ, Bhatt DL. Fractional flow reserve in serial coronary artery stenoses. JAMA Cardiol. 2016;1:359–360. doi: 10.1001/jamacardio.2016.0219 [DOI] [PubMed] [Google Scholar]
- 13. Coppel R, Gomez AL, Finet G, Mauro M, Pettigrew RI, Ohayon J, Lagache M. Experimental bench for hemodynamic study of coronary artery with serial stenoses: fractional flow reserve assessment. Comput Methods Biomech Biomed Engin. 2017;20:45–46. doi: 10.1080/10255842.2017.1382853 [DOI] [PubMed] [Google Scholar]
- 14. Sen S, Escaned J, Malik IS, Mikhail GW, Foale RA, Mila R, Tarkin J, Petraco R, Broyd C, Jabbour R, et al. Development and validation of a new adenosine‐independent index of stenosis severity from coronary wave‐intensity analysis: results of the ADVISE (ADenosine Vasodilator Independent Stenosis Evaluation) study. J Am Coll Cardiol. 2012;59:1392–1402. doi: 10.1016/j.jacc.2011.11.003 [DOI] [PubMed] [Google Scholar]
- 15. Nijjer SS, Sen S, Petraco R, Escaned J, Echavarria‐Pinto M, Broyd C, Al‐Lamee R, Foin N, Foale RA, Malik IS, et al. Pre‐angioplasty instantaneous wave‐free ratio pullback provides virtual intervention and predicts hemodynamic outcome for serial lesions and diffuse coronary artery disease. JACC Cardiovasc Interv. 2014;7:1386–1396. doi: 10.1016/j.jcin.2014.06.015 [DOI] [PubMed] [Google Scholar]
- 16. Kikuta Y, Cook CM, Sharp ASP, Salinas P, Kawase Y, Shiono Y, Giavarini A, Nakayama M, De Rosa S, Sen S, et al. Pre‐angioplasty instantaneous wave‐free ratio pullback predicts hemodynamic outcome in humans with coronary artery disease: primary results of the international multicenter iFR GRADIENT registry. JACC Cardiovasc Interv. 2018;11:757–767. doi: 10.1016/j.jcin.2018.03.005 [DOI] [PubMed] [Google Scholar]
- 17. Xu B, Tu S, Song L, Jin Z, Yu B, Fu G, Zhou Y, Wang J, Chen Y, Pu J, et al. Angiographic quantitative flow ratio‐guided coronary intervention (FAVOR III China): a multicentre, randomised, sham‐controlled trial. Lancet. 2021;398:2149–2159. doi: 10.1016/S0140-6736(21)02248-0 [DOI] [PubMed] [Google Scholar]
- 18. Nijjer SS, Petraco R, van de Hoef TP, Sen S, van Lavieren MA, Foale RA, Meuwissen M, Broyd C, Echavarria‐Pinto M, Al‐Lamee R, et al. Change in coronary blood flow after percutaneous coronary intervention in relation to baseline lesion physiology: results of the JUSTIFY‐PCI study. Circ Cardiovasc Interv. 2015;8:e001715. [DOI] [PMC free article] [PubMed] [Google Scholar]
- 19. Rubimbura V, Guillon B, Fournier S, Amabile N, Chi Pan C, Combaret N, Eeckhout E, Kibler M, Silvain J, Wijns W, et al. Quantitative flow ratio virtual stenting and post stenting correlations to post stenting fractional flow reserve measurements from the DOCTORS (Does Optical Coherence Tomography Optimize Results of Stenting) study population. Catheter Cardiovasc Interv. 2020;96:1145–1153. doi: 10.1002/ccd.28615 [DOI] [PubMed] [Google Scholar]
- 20. van Zandvoort LJC, Masdjedi K, Witberg K, Ligthart J, Tovar Forero MN, Diletti R, Lemmert ME, Wilschut J, de Jaegere PPT, Boersma E, et al. Explanation of postprocedural fractional flow reserve below 0.85. Circ Cardiovasc Interv. 2019;12:e007030. doi: 10.1161/CIRCINTERVENTIONS.118.007030 [DOI] [PubMed] [Google Scholar]
- 21. Ding D, Yu W, Tauzin H, De Maria GL, Wu P, Yang F, Kotronias RA, Terentes‐Printzios D, Wolfrum M, Banning AP, et al. Optical flow ratio for assessing stenting result and physiological significance of residual disease. EuroIntervention. 2021;17:e989–e998. doi: 10.4244/EIJ-D-21-00185 [DOI] [PMC free article] [PubMed] [Google Scholar]
- 22. Candreva A, Mizukami T, Sonck J, Munhoz D, Nagumo S, Di Gioia G, Gallinoro E, Mileva N, Bartunek J, Wyffels E, et al. Hyperemic hemodynamic characteristics of serial coronary lesions assessed by pullback pressure gradients. Catheter Cardiovasc Interv. 2021;1(98):E647–E654. [DOI] [PubMed] [Google Scholar]