

ABSTRACT
Macroautophagy/autophagy is a conserved cellular mechanism to degrade unneeded cytoplasmic proteins and organelles to recycle their components, and it is critical for embryonic stem cell (ESC) self-renewal and somatic cell reprogramming. Whereas autophagy is essential for early development of embryos, no information exists regarding its functions during the transition from naive-to-primed pluripotency. Here, by using an in vitro transition model of ESCs to epiblast-like cells (EpiLCs), we find that dynamic changes in ATG7-dependent autophagy are critical for the naive-to-primed transition, and are also necessary for germline specification. RNA-seq and ATAC-seq profiling reveal that NANOG acts as a barrier to prevent pluripotency transition, and autophagy-dependent NANOG degradation is important for dismantling the naive pluripotency expression program through decommissioning of naive-associated active enhancers. Mechanistically, we found that autophagy receptor protein SQSTM1/p62 translocated into the nucleus during the pluripotency transition period and is preferentially associated with K63 ubiquitinated NANOG for selective protein degradation. In vivo, loss of autophagy by ATG7 depletion disrupts peri-implantation development and causes increased chromatin association of NANOG, which affects neuronal differentiation by competitively binding to OTX2-specific neuroectodermal development-associated regions. Taken together, our findings reveal that autophagy-dependent degradation of NANOG plays a critical role in regulating exit from the naive state and marks distinct cell fate allocation during lineage specification.
Abbreviations: 3-MA: 3-methyladenine; EpiLC: epiblast-like cell; ESC: embryonic stem cell; PGC: primordial germ cell
KEYWORDS: ATG7, autophagy, naive-to-primed transition, NANOG, peri-implantation development
Introduction:
Pluripotency of mouse embryonic stem cells (mESCs) exists in at least two fundamentally distinct states, which are commonly termed naive and primed. Pre-implantation epiblast cells (E3.5-E4.5) can give rise to all somatic lineages as well as the germline, and are considered to display a naive pluripotent state [1]. Upon blastocyst implantation, epiblast cells transition to a primed state (E5.5–7.5), characterized by dissolution of the naive pluripotency program and more developmentally advanced formative states [2] and then primed states of pluripotency [3]. During naive-to-primed transition, ESCs undergo global remodeling of chromatin structure and epigenetic and transcriptional programs. These changes include gradual gain of CTCF-anchored chromatin loops [4], genome-wide reorganization of active enhancers [5], suppressed expression of naive pluripotency genes, activation of primed and early differentiation genes and partial primordial germ cell (PGC) specification (E6-6.5) [6]. Several pioneer transcription factors (TFs) constitute a flexible control circuitry that, in concert with epigenetic modifiers, further govern the pluripotency transition [7,8]. These findings raise the intriguing point that dynamic interplays between upstream effectors and epigenetic modifiers could serve as driving forces and participate in the establishment of novel cellular states.
As an important catabolic process, autophagy maintains appropriate patterns of intracellular homeostasis through degradation and recycling pathways that are relevant in stem cell and developmental biology [9,10]. In addition to pluripotency-associated transcriptional networks, pluripotent stem cells and especially those in the naive-state maintain high autophagic flux and robust competency for autophagy induction by coordinated expression of multiple autophagy core machinery genes [11,12]. Extensive studies on autophagy regulation in pluripotency maintenance and reprogramming highlight the contribution of mitochondria remodeling [12,13], metabolic regulation [14] and apoptotic cell clearance [15], which meet the high demand of self-renewal activity in stem cells. Recently, despite the conserved mechanism of autophagy in regulating cytoplasmic degradation, the potential crosstalk between autophagy and nuclear events has been increasingly appreciated [16,17]. However, little research has been done to investigate the role of autophagy in epigenetic regulation and chromatin dynamics, which are both key biological processes during the naive-to-primed transition. Whereas a shift toward glycolytic metabolism and reduced mitochondrial capacity is associated with development from naive-to-primed pluripotency in mouse and human pluripotent stem cells [18,19], autophagy regulation during this cellular state transition has not been reported.
In this study, we explore an important role of autophagy in contributing to the naive-to-primed pluripotency transition of mouse ESCs. We show that autophagy is critical for both the primed pluripotency transition and germline specification. By identifying gene expression and chromatin accessibility patterns, we show that NANOG protein and its chromatin association are eliminated by autophagy in an SQSTM1-dependent manner, which further contributes to exiting naive pluripotency. Moreover, NANOG degradation by autophagy also serves as a mechanism to prevent the binding of NANOG at neural differentiation-related enhancers, and thereafter governs epiblast cell commitment to differentiation during mouse peri-implantation development.
Results:
Autophagic flux changes dynamically during the naive-to-primed transition
For our study of autophagic flux during the naive-to-primed transition, we used a previously established system that promotes the conversion of ESCs into EpiLCs [6]. Naive-state mESCs maintained in the presence of LIF, the GSK3B/GSK3β inhibitor CHIR99021, and the MAP2K/MEK inhibitor PD0325901 (hereafter referred to as 2iL) were transferred to a more primed medium containing FGF2/bFGF and INHBA/Activin A. Within 4 days, the cells displayed the typical morphological features of EpiLCs (Fig. S1A), the expected changes in Pou5f1/Oct4 distal/proximal enhancer activity (Fig. S1B) and post-implantation gene expression patterns (Fig. S1C). Longer culture did not lead to further induction of these gene expression patterns, but instead resulted in massive cell death (data not shown). Therefore, this pluripotency conversion system was considered to closely resemble the in vivo transition and it was used in all further experiments.
We then measured autophagosome numbers by using transmission electron microscopy (TEM), which is regarded as the “gold standard” for autophagy detection [20]. ESCs maintained in 2iL conditions showed typical autophagosome structures. As the transition to EpiLCs began, loss of autophagosomes was observed on the first day but their number sharply increased on the second and third days of the transition period. By the fourth day of pluripotency transition, the numbers of autophagosomes were tending toward stability, with only about 40% fewer autophagosomes observed in EpiLCs relative to ESCs (Figure 1A, top). These findings revealed that a distinct autophagic basal flux occurred during the transition between these two pluripotent states. To further verify this observation, we generated ESC lines expressing GFP or mCherry-GFP fused MAP1LC3B/LC3, an autophagosome marker [21], and then quantified the autophagosomes by counting LC3 puncta (Figure 1A, middle and bottom). High autophagic flux was shown on day 2 of the pluripotency transition (Video. S1). By briefly treating cells with chloroquine (CQ) to block the late steps of autophagy [22], the association of autophagic flux with development of ESCs to EpiLCs was further confirmed by total fluorescence of saponin-extracted LC3-II (Figure 1B), LC3 conversion and the protein levels of ATG7, ATG12-ATG5, BECN1/beclin1 and SQSTM1/p62 (Figure 1C). Together, our data clearly suggest that a dynamic autophagic flux accompanies the naive-to-primed transition.
Figure 1.
The dynamics of autophagic flux during the naive-to-primed transition. (A) Autophagosomal structure changes during the naive-to-primed transition. ESCs maintained in 2iL were transferred into FGF2/bFGF and INHBA/Activin A for 4 days. Images at the top show autophagosomes detected by Transmission Electron Microscopy. Red arrowhead indicates autophagosome. Scale bar: 1 µm. Images at the middle show immunofluorescence analysis of GFP-LC3 dots in GFP-LC3 ESCs during pluripotency transition, Scale bar: 20 µm. Images at the bottom show immunofluorescence analysis of mCherry-GFP-LC3 (yellow) and mCherry-LC3 (red) dots in mCherry-GFP-LC3 ESCs, yellow arrowhead indicates autophagosome, red arrowhead indicates autolysosome, Scale bar: 10 µm. Statistical data at the right are presented as means ± s.d. from three representative experiments and at least 10 individual cells. (B) FACS analysis showing changes in autophagic flux during the naive-to-primed transition. GFP-LC3 ESCs for EpiLCs induction were treated with or without 30 µM chloroquine for 6 h, and washed twice with saponin to eliminate soluble GFP-LC3-I. Cells were harvested to perform FACS analysis. (C) Autophagy-related protein expression during the naive-to-primed transition. Western blot indicates expression levels of ATG7, ATG12–ATG5, BECN1, SQSTM1/p62, LC3 during EpiLCs transition with or without chloroquine treatment. Data analysis for LC3-II, ATG12–ATG5 and ATG7 protein expression are shown at the bottom and presented as means. ACTB is shown as a loading control. (D) Inhibition of autophagy by 3-MA affects primed pluripotency. ESCs for EpiLCs induction were transiently treated with or without 5 mM 3-MA at the indicated days, Western blot indicates expression of LC3 and SQSTM1/p62 upon 3-MA treatment. The percentages of three AP signal colonies were calculated at day 4. AP high, AP mixed, AP low colonies are shown at the top. Scale bar: 50 µm. (E) Transient inhibition of 3-MA affects pluripotency and differentiation related gene expression. mRNA levels of the cells from (D) were analyzed by RT-qPCR and Actb was used as internal control. *p< 0.05. **p < 0.01 compared to the control. All the images are representative of at least three independent experiments, error bars represent s.d. *p< 0.05. **p < 0.01. TEM, Transmission Electron Microscopy; IF, Immunofluorescence; CQ, chloroquine; autophago, autophagosome; autolyso, autolysosome.
To further assess the importance of autophagy at different time points of EpiLC induction, we treated the transitioning cells with the autophagy inhibitor, 3-methyladenine (3-MA), which blocks the activity of the autophagy initiation complex [23]. Results indicated that the LC3 conversion was decreased while the SQSTM1/p62 accumulation was increased upon 3-MA treatment (Figure 1D). Importantly, we found that 5 mM 3-MA did not trigger cell apoptosis during this transition period (data not shown), thereby excluding a toxic effect on cell viability. Interestingly, we observed that transient treatment of cells with 3-MA at day 2 and 3 increased the alkaline phosphatase (AP)-positive colony proportion compared to EpiLCs without 3-MA treatment (Figure 1D), representing the naive-to-primed transition process was attenuated by 3-MA treatment. Moreover, quantitative PCR (qPCR) results showed that the expression levels of partial naive marker genes (Nanog, Zfp42, Esrrb) and most lineage differentiation associated genes fluctuated on days 2 and 3 (Figure 1E), indicating that autophagy signaling, especially at day 2–3, plays a predominant role in the regulation of this transition period.
Collectively, our data demonstrate that dynamic changes of autophagy flux occur throughout the naive-to-primed transition. Remarkably, transient high autophagy flux at the middle stage (day 2–3) plays a major role in the pluripotency transition, which may affect the pluripotency of EpiLCs.
ATG7-mediated autophagy is critical for the primed pluripotency transition and germline specification
To further determine the effect of autophagy on the primed pluripotency transition, Dox-inducible CRISPR-Cas9 gene knockout approach was used to disrupt the core autophagy regulatory gene Atg7 (Fig. S2A and B), which is essential for Atg conjugation systems and indispensable for both bulk and selective autophagy induction [24]. Following differentiation of ESCs into EpiLCs (Figure 2A) in the presence of Dox, we found a high cleavage activity at 12 h (Fig. S2C) and there was reduced expression of ATG7 (> 90%) and suppressed LC3-II conversion (Fig. S2D), indicating blocked autophagic flux during the pluripotency transition. Interestingly, we observed that atg7 KO ESCs, which were maintained in 2iL conditions, exhibited a normal morphology, AP activity and cell proliferation (Fig. S2E and F). In addition, the cells displayed nearly identical gene expression patterns (Fig. S2G and H) and comparable Pou5f1 distal/proximal enhancer activity, compared to control cells (Fig. S2I). Moreover, there were no significant differences in ESC self-renewal between atg7 KO and control ESCs under prolonged culture for more than 15 passages (data not shown), suggesting a nonessential role of ATG7-dependent autophagy in the naive pluripotency maintenance.
Figure 2.
ATG7-deficiency impairs the naive-to-primed transition. (A) Schematic protocol for induction of atg7 KO and control EpiLCs. (B) Morphological feature of EpiLCs induction at days 2 and 4. Representative bright field images of d2-EpiLCs and d4-EpiLCs derived from ESCs with or without Dox treatment. Images for POU5F1 (red) in d4-EpiLCs are shown. DAPI (blue) was used to show the nucleus. Scale bar: 50 µm. (C) Proliferation analysis of atg7 KO and control cells during the naive-to-primed transition with or without Dox treatment. Data are representative of five different experiments and shown as mean ± s.d. *p< 0.05. (D) TUNEL analysis of cell apoptotic rate in atg7 KO and control EpiLCs during naive-to-primed transition. The image is representative of three independent experiments. Scale bar: 100 µm. (E) CASP3 analysis of cell apoptotic rate in atg7 KO and control EpiLCs during naive-to-primed transition. Data were obtained in triplicate and are presented as mean ± s.d. *p< 0.05, **p < 0.01. (F) Hematoxylin and eosin (HE) stained histological sections of teratomas derived from d4-atg7 KO and d4-Control EpiLCs, shown are, from left to right, epithelium, cartilage, nerves. Scale bar: 50 µm. The whole section of teratomas is shown at the right. Scale bar: 200 µm. (G) The weight of teratomas derived from d4-atg7 KO and d4-Control EpiLCs. Error bars represent s.d. n = 6. *p< 0.05. (H) Schematic protocols for PGCLCs specification from ESCs and the rescue experiment for I and J. (I) ATG7 and LC3 protein levels in the rescue assay. Vector containing Atg7 cDNA was transfected at d2- and d4-EpiLC stages, the ATG7 and LC3 protein expressions were detected by western blot. ACTB was used as internal control. (J) Loss of autophagy during the naive-to-primed transition period affects PGCLCs specification. Atg7 overexpression vector was infected at different pluripotent stages. Bright field images representing PGCLCs at day 6. Images for NanoS3-mCherry (red) represents putative PGCLCs. Percentages are mCherry positive cells after FACS. Scale bar: 100 µm. The images shown in B-G, I and J are representative of at least three independent experiments, error bars represent s.d. *p< 0.05. **p < 0.01. BF, bright field; Ø, no infection; EV, empty vector; OE, over expression.
The identical characteristic of naive pluripotency in atg7 KO ESCs provides an excellent context to address the function of autophagy in the naive-to-primed transition. Unexpectedly, the morphology of EpiLCs was not notably influenced and the expression of POU5F1 was not changed obviously (Figure 2B). However, the cell number was significantly decreased starting from the 2nd day of transition (Figure 2C), suggesting that autophagy affects the survival of EpiLCs. Indeed, both TdT-mediated dUTP Nick-End Labeling (TUNEL) and a CASP3 (caspase 3) activity assay indicated that cell apoptosis was increased in atg7 KO EpiLCs compared to that of the control (Figure 2D, E). These results demonstrated that autophagy negatively regulates apoptosis during the pluripotency transition, but does not alter the developmental potential of cells because the remaining live d4-EpiLCs were able to form teratomas containing all three germ layers tissue (Figure 2F). However, teratomas derived from atg7 KO d4-EpiLCs had a disordered arrangement of lineage tissues (Figure 2F, right) and decreased weight relative to those derived from control (Figure 2G), suggesting that ATG7 loss is associated with impaired differentiation during the pluripotency transition.
Because EpiLCs retain attributes of the original epiblasts and are a potential source for the generation of primordial germ cell-like cells (PGCLCs) in vitro, we next performed PGCLCs induction experiments to investigate the role of autophagy in germline specification (Figure 2H). We generated a germline reporter cell line in which a mCherry cassette was inserted into the 3’ untranslated region of the mouse Nanos3 locus [25]. To address the functional contribution of autophagy to the naive-to-primed transition, a complementation experiment was carried out in parallel by introducing a vector containing Atg7 cDNA into atg7 KO cells (atg7 KO + Atg7 OE) at stages from the naive-to-primed transition. The failed ATG7 expression, as well as the inhibited LC3 conversion of the atg7 KO + empty vector (EV) cells were rescued in the atg7 KO + Atg7 OE cells, as verified in EpiLCs at day 2 and day 4 (Figure 2I). After 6 days of PGCLCs induction, we found that atg7 KO EpiLCs failed to activate germline specification, evidenced by a few Nanos3-mCherry positive (Nanos3-mCherry+) cell numbers (Figure 2J, top). Ectopic expression of ATG7 at the ESC stage could largely rescue the specification of PGCLCs (Figure 2J, top); however, overexpression of ATG7 at the d4-EpiLC stage responds poorly to specification of PGCLCs. We only detected a few mCherry positive cells distributed at the edge of the PGCLCs complex (Figure 2J, bottom). In contrast, the phenotype of PGCLC was partially rescued upon overexpression of ATG7 at the d2-EpiLC stage, indicated with partially increased Nanos3-mCherry+ cell population (Figure 2J, bottom). These results suggest that the naive-to-primed transition is crucial for germline specification and loss of autophagy during this window results in an irreversible impairment of PGC induction.
Together, our results indicate that ATG7-mediated autophagy contributes to the efficiency of pluripotency transition and regulates the developmental potential of EpiLCs. Additionally, impaired germline specification was also indicated in the ESCs to EpiLCs transition upon ATG7 deficiency.
ATG7-mediated autophagy contributes to exit from naive pluripotency and establishment of primed pluripotency at the transcriptional level
To further investigate changes in gene expression caused by atg7 KO during the naive-to-primed transition, we performed RNA sequencing (RNA-seq) on five cell populations: a control ESC population obtained before Dox addition (ESC), atg7 KO and control populations collected after 2 days and 4 days of EpiLC induction along with or without Dox treatment (hereafter d2-atg7 KO and d2-Control; d4-atg7 KO and d4-Control). Our RNA-seq data across three biological replicates of each individual sample were highly correlated (Spearman’s correlation > 0.99; Fig. S3A). Analysis of differentially expressed genes (DEGs) in the atg7 KO and control groups revealed specific differences in the naive-to-primed transition states. Using a 2-fold change (FC) cutoff and 5% p-value adjusted (padj), the d2-atg7 KO EpiLCs had 579 upregulated genes and 659 downregulated genes relative to the d2-Control cells. In the d4-atg7 KO vs. d4-Control comparison, the transcriptional response was biased toward the downregulated genes with 749 downregulated genes but only 227 upregulated genes (Fig. S3B and C). Principal-component analysis showed clear segregation of atg7 KO and control EpiLCs on days 2 and 4 (Figure 3A), which suggested a distinct transcriptome and expression pattern between these two branches. Notably, silencing of the naive pluripotency gene program was retarded in atg7 KO EpiLCs because gene set enrichment analysis (GSEA) showed that the sets of genes most significantly upregulated in d2-atg7 KO and d4-atg7 KO were globally enriched in ESC, while genes downregulated in d2-atg7 KO and d4-atg7 KO were globally enriched in EpiLC (Figure 3B). To further confirm these findings, we performed commitment assays in which differentiated d4-atg7 KO and d4-Control EpiLCs were re-plated into 2iL conditions. Interestingly, atg7 KO EpiLCs generated dome-shaped AP positive colonies when re-adapting to 2iL conditions and could be maintained for more than five passages. In contrast, d4-Control EpiLCs appeared to be differentiated, mixed AP colonies after 24 hours and died within two passages (Figure 3C). Significant high adaption ability was also observed in the atg7 KO R1 ESC line compared to the control (Fig. S3D and E). These preliminary observations indicated a protracted exit from naive pluripotency in atg7 KO EpiLCs.
Figure 3.
The effect of ATG7-mediated autophagy on transcriptome. (A) Principal-component analysis (PCA) of gene expression during EpiLCs induction with or without Dox treatment. (B) GSEA for the top genes are considered as significantly up-regulated (red) or down-regulated (green) in atg7 KO versus Control EpiLCs with respect to the global transcriptional changes observed in ESCs versus EpiLCs. (C) atg7 KO and control cells were treated with FGF2/bFGF and INHBA/Activin A, differentiated into EpiLCs for 3 days, and then re-plated under “2iL”. Left: control and atg7 KO cells after two passages of being re-plated in “2iL”. Right: alkaline phosphatase staining of control and atg7 KO cells after 48 h of being re-plated in “2iL”. The experiment was performed in triplicates. Scale bar: 20 µm. (D) All expressed genes (FPKM > 1 of any one of ESC, d2-Control and d4-Control) were clustered into four classes by kmeans, and the gene set that was continuously down-regulated and continuously up-regulated in d2-Control and d4-Control was selected (C1 and C2). (E) Heat map showing relative expression levels of clusters 1–4 genes from ESCs, d2-atg7 KO, d2-Control and d4-atg7 KO, d4-Control cells. These genes were further classified into four categories based on the fold change (FC) in transcription levels between d4-atg7 KO and d4-Control EpiLCs. (F) Box plots showing the expression levels of cluster 1–4 genes in (E) Mann-Whitney-Wilcoxon two-sided test was used to calculate the P values between d4-atg7 KO and d4-Control data. (G) Functional annotation of the four clusters classified in (E).
We next assessed all of the expressed genes in transitional controls (ESC, d2-Control, d4-Control) using a k-means clustering method that separated four clusters (Figure 3D): group 1, with gene expression continuously downregulated (C1, N = 3946); group 2, with gene expression continuously upregulated (C2, N = 3462); as well as or the comgenes that are transiently up-regulated or down-regulated at day 2 (C3, N = 2510; C4, N = 3212). The group 1 and 2 represent genes related to naive state exit and primed state establishment (C1 and C2). According to the corresponding gene expression patterns in d4-atg7 KO EpiLCs, these two groups could be sub-divided into 4 clusters (Figure 3E and Table S2). Cluster 1 genes (1563) were relatively highly expressed in d4-atg7 KO EpiLCs compared to the control (FC > 1, padj < 0.05). Cluster 2 (2383) genes had a similar downward expression trend at day 2 and day 4 in both the atg7 KO EpiLCs and their controls. Cluster 3 genes (1229) were relatively lowly expressed in the d4-atg7 KO compared to the control (FC < 1, padj < 0.05). Cluster 4 genes (2233) had a similar upward expression trend at day 2 and 4 in the atg7 KO EpiLCs and their controls (Figure 3F).
Gene ontology (GO) and Kyoto Encyclopedia of Genes and Genomes (KEGG) pathways analysis of the genes in each cluster revealed specific cellular processes and pathways common to each cluster (Figure 3G). Cluster 1 was enriched in genes associated with chromatin modification and histone modification. In addition, some naive pluripotency-related transcripts (eg. Nanog, Esrrb, Tbx3 and Tcl1) were significantly upregulated (Table S2), suggesting that atg7 KO EpiLCs kept some characteristics of naive pluripotency. Cluster 2 was enriched for genes involved in mitochondrial reorganization, tricarboxylic acid (TCA) cycle and OXPHOS, indicating that the metabolic switch, which is also a hallmark of the naive-to-primed transition, was not obviously affected by loss of autophagy. The Golgi apparatus and endoplasmic reticulum were well developed during the naive-to-primed transition because cluster 4 was enriched for genes related to “Golgi vesicle transport” and “endoplasmic reticulum stress”. In line with our findings that ATG7-mediated autophagy was necessary for cell survival (Figure 2C,E), we observed that GO terms associated with the cell cycle and cell apoptosis were strongly enriched in cluster 3. Cluster 3 was also highly enriched in KEGG terms related to MAPK signaling, which is important for lineage commitment of ESCs. Taken together, our data indicated that atg7 KO EpiLCs preserved a portion of the naive pluripotency-related transcriptional program and incompletely entered the primed state, which might affect the developmental potential of EpiLCs.
ATG7 deficiency-dependent NANOG upregulation is a barrier to exiting from the naive state
The impaired naive-to-primed transition upon ATG7 deficiency indicated the existence of barriers preventing this transition. To identify factors controlling this transition, we harvested atg7 KO and control EpiLCs at day 2 and day 4, along with ESCs for profiling the genome-wide accessibility of open chromatin by transposase accessible chromatin sequencing (ATAC-seq) [26]. Peaks of open chromatin were highly correlated between two biological replicates (Pearson’s correlation > 0.84, Fig. S4A), and were identified in control groups at the indicated time points (Fig. S4B). By comparing the peaks at each locus between atg7 KO and control EpiLCs, we found that the d4-atg7 KO EpiLC chromatin was more accessible at ESC-specific peaks (C1), but less accessible at EpiLC-specific peaks (C2) (Fig. S4C). Consistent with the findings revealed by our RNA-seq data (Figure 3B), these results also indicated that atg7 KO EpiLCs displayed an incomplete exit from the naive state in chromatin accessibility.
Similar to the classification of RNA-seq data, we divided the ATAC-seq dataset into four groups: group 1 (stubbornly opened regions, SOR) and group 2 (obediently closed regions, OCR) represent chromatin locations that are closed in control cells but stubbornly opened or obediently closed in atg7 KO during the transition period. In contrast, group 3 (stubbornly closed regions, SCR) and group 4 (obediently opened regions, OOR) represented chromatin regions gradually opened in control EpiLCs but stubbornly closed or obediently opened in d2- and d4-atg7 KO EpiLCs (Figure 4A and Table S3). To identify candidate TFs that might drive these chromatin dynamics, we performed TF motif enrichment analysis associated with these four groups. Notably, we observed that POU5F1, SOX2 and NANOG were significantly enriched in SOR, OCR and OOR, consistent with their predominant regulatory roles in the pluripotency network [27]. We also identified JUN and FOSL2, as important regulators that are more accessible in OCR (Figure 4B). Both of these TFs belong to the AP-1 family and are critical factors involved in stem cell differentiation and embryonic development [28–30]. All of these genes represent barriers for atg7 KO EpiLCs to exit from the naive state and precede lineage commitment.
Figure 4.
The effect of ATG7-mediated autophagy on chromatin accessibility. (A) Heat map showing the classification of the ATAC-seq peaks. These include: 1) “stubbornly opened region (SOR)”, defined as those that are stubbornly opened in d4-atg7 KO cells compared to d4-Control cells; 2) “obedient closed region (OCR)”, defined as those that are gradually closed in d2 and d4 as that of controls; 3) “stubbornly closed region (SCR)”, defined as those that are stubbornly closed in d4 atg7 KO cells compared to d4-Control cells; 4) “obedient opened region (OOR)”, defined as those that are gradually opened in d2 and d4 as that of controls. (B) The TF motif identified in the four groups of ATAC-seq peaks that have been classified in (A). (C) Selected genomic views of the ATAC-seq data, and comparison with ChIP-seq data from NANOG, are shown for the indicated SOR, OCR, SCR and OOR groups: Nanog, Igf1, Krt18 and Ube2a. (D) The average ChIP-seq intensity of NANOG is shown within SOR, OCR, SCR and OOR compared with 1 kb flanking regions (left). The average ChIP-seq intensities of H3K27ac (middle) and H3K4me1 (right) are shown in the SOR, OCR, SCR, and OOR overlapping regions with d4-atg7 KO NANOG peaks. The ChIP-seq intensity of d4-atg7 KO is normalized by d4-Control, total mapped reads and region length.
Among these enriched TF binding motifs, we observed that NANOG was highly enriched upregulated upon Atg7 depletion during the naive-to-primed transition (Figure 4B). Previous studies suggested that a decline in Nanog was required for exiting from the naive pluripotent state and initiation of ESC differentiation [31,32]. Therefore, we next tested whether the failure of NANOG to decline in atg7 KO EpiLCs explains their incomplete transition to the primed state. By monitoring genome-wide targets of NANOG during the pluripotency transition by chromatin immunoprecipitation (ChIP) followed by sequencing (ChIP-seq), we identified 6359 NANOG-bound regions in d2-Control EpiLCs and 6126 regions in d2-atg7 KO EpiLCs, with many of them (3291 regions) present in both populations (Fig. S4D). However, on day 4 there was a dramatic difference in NANOG-bound regions between atg7 KO and control. Whereas d4-Control EpiLCs had ~90% fewer NANOG-bound regions than the d2-Control EpiLCs, d4-atg7 KO EpiLCs had almost exactly the same number of NANOG-bound regions as d2-atg7 KO EpiLCs, and almost 10-fold more than d4-Control EpiLCs. The NANOG regions in d4-atg7 KO EpiLCs (6110 regions) overlapped with almost all of the 588 NANOG regions in d4-Control EpiLCs (Fig. S4D). These findings suggested a persistent regulatory role of NANOG in atg7 KO EpiLCs during naive pluripotency exit. Remarkably, we observed a high proportion (29%, 48.9%) of NANOG-specific binding regions (5557) in d4-atg7 KO EpiLCs that was supposed to be occupied in SOR and OCR (Fig. S4E). By using d4-Control EpiLCs as a control, we found that many of these differently accessible peaks were located within ± 1 kb from ATAC peak as indicated by representative loci (Figure 4C) and co-localized with SOR, while OCR, SCR, and OOR were not found to have strong NANOG enrichment (Figure 4D, left). Further analysis indicated that these peaks were marked with high levels of the active enhancer histone markers H3K4me1 and H3K27ac (Figure 4D, middle and right), which was consistent with a prior regulatory role of NANOG at naive enhancers. Together, these observations suggested that the sustained NANOG activity in atg7 KO EpiLCs prevents the closure of open chromatin in naive enhancers, and subsequently impedes the exit from naive pluripotency.
Collectively, our results indicate that ATG7-mediated autophagy plays a role in chromatin dynamics during the naive-to-primed transition. Furthermore, we identified a sustained NANOG occupancy in naive enhancers during the entire transition process, which further prevents ESCs from exit from the naive state.
The autophagy-dependent NANOG degradation by interacting with SQSTM1/p62
To further verify NANOG was a barrier for the naive-to-primed transition upon autophagy inhibition, we performed Nanog interference in atg7 KO cells during naive-to-primed transition. Results demonstrated that the depletion of NANOG in atg7 KO EpiLCs could rescue the exit of naive pluripotency (Fig. S5A), as indicated with decreased naive pluripotent gene expression (Fig. S5B). In contrast, overexpression of NANOG in control cells re-capitulated the phenotype of atg7 KO EpiLCs, as shown with increased NANOG expression (Fig. S5C) and high AP staining (Fig. S5D). We next asked about the underlying mechanism causing aberrant NANOG expression and its chromatin occupation in atg7 KO EpiLCs during this transition. Autophagy is a cytoplasmic event, and the interaction with upstream signaling cascades is critical for transcriptional and epigenetic regulation occurring in the nucleus [33]. Accordingly, we investigated whether NANOG was regulated by autophagy at the post-transcriptional level. Compared to the control, which displayed a gradual reduction in NANOG protein, relatively high NANOG protein levels were observed in atg7 KO EpiLCs during the pluripotency transition (Figure 5A). Previous studies have indicated that NANOG is a short-lived protein that is quickly degraded via the ubiquitin-dependent proteasome system [34]. We therefore evaluated whether autophagy impacts NANOG degradation by monitoring NANOG levels after chemical inhibition of proteasomes (with MG132) and translation inhibition with cycloheximide (CHX). Interestingly, the half-life of NANOG degradation was increased in d2-atg7 KO EpiLCs compared to the control (Figure 5B and Fig. S5E), suggesting that NANOG degradation was impaired. Conversely, the other core factors POU5F1 and SOX2 had stable phenotypes both in the protein level and half-life of degradation compared to their controls (Figure 5A, B). Overall, these results suggested that the post-transcriptional level of NANOG was regulated by autophagy during the naive-to-primed transition.
Figure 5.
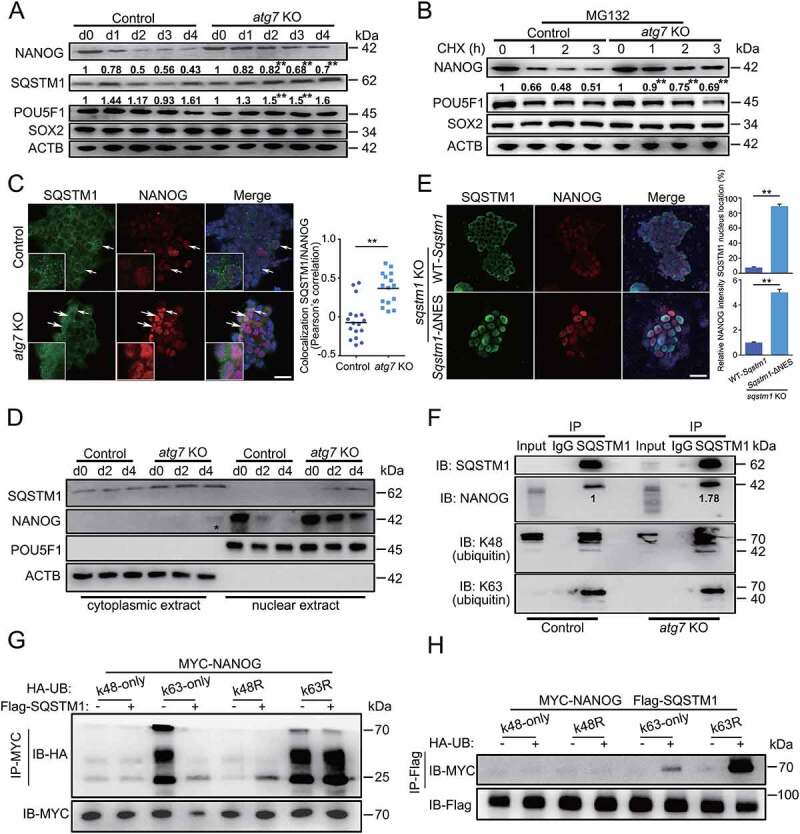
The physical interaction between NANOG and SQSTM1/p62. (A) Western blotting for NANOG, SQSTM1/p62, POU5F1 and SOX2 in atg7 KO or control cells during EpiLCs induction. ACTB is shown as a loading control. The relative intensity is shown below the band. (B) The effect of autophagy on NANOG half-life time. After treating cells with cycloheximide (CHX, 10 µg/ml) for indicated time intervals and MG132 (10 µM) for additional 2 h, NANOG, POU5F1 and SOX2 were analyzed by western blotting. ACTB is used as a loading control. The relative intensity is shown below the band. (C) The expression and subcellular location of NANOG and SQSTM1/p62. Immunofluorescence analysis of NANOG and SQSTM1/p62 in d2-atg7 KO and d2-Control EpiLCs. White arrowhead represents the colocation of NANOG and SQSTM1/p62 in the nucleus. Scale bar: 20 µm. Pearson’s correlation illustrated SQSTM1/p62-NANOG colocalization. Plots showed colocalization values for individual cells, for >10 cells per condition. **p < 0.01. (D) SQSTM1/p62 translocates into the nucleus of the cells during naive-to-primed transition. Nucleocytoplasmic separation and western blot analysis showing the expression of SQSTM1/p62 and NANOG. ACTB is used as a cytoplasmic protein control while POU5F1 is used as a nuclear protein control. *represents NANOG transports from the nucleus into the cytoplasm. (E) The NANOG degradation is associated with nuclear shuttling of SQSTM1/p62. WT SQSTM1/p62- or SQSTM1/p62ΔNES plasmids were transfected into sqstm1/p62 KO ESCs. Images for SQSTM1/p62 (green) and NANOG (red) were taken at d2-EpiLCs. Scale bar: 20 µm. Plots showed the nuclear location of SQSTM1/p62 and the relative NANOG intensity, for >10 cells per condition. Error bar represents s.d. **p < 0.01. (F) SQSTM1/p62 interacts with NANOG. Endogenous SQSTM1/p62 was immunoprecipitated with an antibody against SQSTM1/p62. NANOG, ubiquitin (linkage-specific K48), ubiquitin (linkage-specific K63) were detected by western blotting. The relative intensity of NANOG is shown below the band. (G) SQSTM1/p62 targets K63-linked NANOG for degradation. The 293 T cells were transfected with MYC-NANOG (2 µg) along with the indicated plasmids (0.2 µg). 24 h after transfection, immunoprecipitation, and immunoblot analysis were performed with the indicated antibodies. (H) SQSTM1/p62 targets NANOG for K63-linked ubiquitination. The 293 T cells were transfected with MYC-NANOG (2 µg), Flag-SQSTM1/p62 (2 µg) and the ubiquitin plasmids (0.2 µg). Immunoprecipitation and immunoblot analysis were performed 24 h later. All the experiments were performed in triplicates. Error bars represent s.d. **p < 0.01.
SQSTM1/p62 is a cargo receptor that is involved in ATG7-mediated selective autophagy and one of the top candidates to mediate the degradation of aggregated proteins and damaged or over-abundant organelles [35,36]. During the naive-to-primed transition, we observed an accumulation of SQSTM1/p62 in atg7 KO EpiLCs (Figure 5A), supporting the possibility of an SQSTM1/p62-NANOG interaction. However, a protein interaction between SQSTM1/p62 and NANOG seemed unlikely because SQSTM1/p62 is generally considered a cytoplasmic protein while NANOG is located in the nucleus. Notably, by immunostaining, we found that SQSTM1/p62 was almost always located in the cytoplasm of the d2-Control EpiLCs (Figure 5C, top), but in d2-atg7 KO EpiLCs it was in both cytoplasm and some nuclei (Figure 5C, bottom). Pearson’s correlation assay showed a high physical overlap between SQSTM1/p62 and NANOG that co-located in the nucleus (Figure 5C, right). In addition, we analyzed SQSTM1/p62 levels in nuclear extracts and cytoplasmic extracts, and observed increased nuclear accumulation of SQSTM1/p62 in atg7 KO EpiLCs during the naive-to-primed transition (Figure 5D). These findings were consistent with the report that SQSTM1/p62 recruits nuclear proteins through nucleocytoplasmic shuttling [37].
Interestingly, we also found that NANOG shuttled from the nucleus into the cytoplasm in d4-atg7 KO EpiLCs (Figure 5D), indicating a potential SQSTM1/p62-mediated autophagic degradation of NANOG during the naive-to-primed transition. We knocked out endogenous SQSTM1/p62 and introducing a wild type (WT SQSTM1/p62) or mutant type of SQSTM1/p62 (SQSTM1/p62ΔNES) [38], from which the nucleus export signal was removed. Western blot results indicated that the absence of SQSTM1/p62 in the nucleus of SQSTM1/p62ΔNES cells (Fig. S5F). Immunofluorescence analysis showed that d2-EpiLCs with strong nuclear SQSTM1/p62 accumulation (SQSTM1/p62ΔNES) also accumulate NANOG (Figure 5E, bottom). In contrast, cells with strong cytoplasmic SQSTM1/p62 signals (WT SQSTM1/p62) showed only weak NANOG signals in the nucleus (Figure 5E, top). As expected, there were no apparent changes in POU5F1 and SOX2 protein expression, and the LC3 conversion was changed slightly (Fig. S5G). These results clearly suggest that a nuclear shuttling capacity for SQSTM1/p62 is required for NANOG degradation.
To verify the physical interaction between SQSTM1/p62 and NANOG, we performed co-immunoprecipitation experiments in both d2-atg7 KO and d2-Control EpiLCs. Our results confirmed the interaction between NANOG and SQSTM1/p62 (Figure 5F). Notably, their apparent binding affinity was higher in atg7 KO EpiLCs than in control EpiLCs, indicating a closer partnership between SQSTM1/p62 and NANOG upon Atg7 depletion. We also found the interaction between SQSTM1/p62 and Lys48 (K48) or Lys63 (K63), consistent with the report that SQSTM1/p62 has high affinity for K48 or K63 polyubiquitinated proteins [39]. To further investigate the mechanism of SQSTM1/p62 mediated NANOG degradation, we performed ubiquitination assays by utilizing K63-only, K48-only, K63R, and K48R mutant ubiquitin in 293 T cells (Figure 5G, H). With a K63R mutant variant, SQSTM1/p62 can still recognize Nanog, but its capacity to promote Nanog degradation process is blocked. Upon introducing K48 or K48R mutations, we did not observe either Nanog binding or Nanog degradation. The results indicated that NANOG is more likely to bind to K63 but not K48, and SQSTM1/p62 mediates degradation of K63 modified NANOG. It is well known that SQSTM1/p62 recognizes and interacts with ubiquitinated proteins through its UBA domain [40]. We therefore constructed an SQSTM1/p62ΔUBA variant, which could no longer recognize the ubiquitinated NANOG protein; nor could this variant promote NANOG degradation (Fig. S5H). These data suggest that SQSTM1/p62 binds K63-polyubiquitinated NANOG through its UBA domain, which facilitates a gradual reduction of NANOG during the naive-to-primed transition.
Taken together, our data reveal a novel post-transcriptional modification and degradation mechanism during the naive-to-primed transition, by which the autophagy receptor protein SQSTM1/p62 translocates to the nucleus, interacts with K63-ubiquitinated NANOG and exports to the cytoplasm for selective autophagic degradation.
ATG7-mediated autophagy governs peri-implantation development in vivo
To further investigate the physiological relevance of our finding that the naive-to-primed transition was impaired upon autophagy deficiency, we asked whether autophagy deficiency would affect peri-implantation development, which represents the pluripotency transition in vivo. We made use of CRISPR/Cas9 technology to target the coding region of Atg7 by using the sgRNAs (sgRNA-Atg7). sgRNA-Rosa26 targeting the Rosa26 locus [41] was microinjected into the cytoplasm of zygotes as a control (Fig. S6A). Immunostaining results showed reduced ATG7 expression in sgRNA-Atg7 injected embryos (Fig. S6B). We examined the gene-edited 8-cell embryos at the single-cell level and found all blastomeres carried large-fragment deletion, resulting in complete Atg7 knockout (Table S4A). The embryos were then evaluated for developmental progression daily. As anticipated, we found that the sgRNA-Atg7 embryos developed normally before E3.5 because they had similar development rates as embryos microinjected with sgRNA-Rosa26 (Fig. S6C).
We next transferred the sgRNA-injected zygotes into the oviduct of pseudopregnant mice and the corresponding embryos were analyzed at different developmental stages. At E6.5, 100 sgRNA-Atg7 embryos (59.2%, 100/169) successfully developed and were collected from the uterus, comparable to the numbers of sgRNA-Rosa26 injected embryos (61.3%, 87/142). However, the percentage of abnormal sgRNA-Atg7 embryos (7.1%, 12/169), which showed abnormal morphology both in shape and size, was increased compared with the control (2.1%, 3/142) (Figure 6A, B). These results suggested that the development of ATG7-deficiency embryos was impaired in the peri-implantation period. Surprisingly, although sgRNA-Atg7 embryos displayed fetal growth retardation, the percentage of abnormal embryos was not dramatically increased with the further development of the sgRNA-Atg7 embryos (E9.0 and E19.0), and there was no obvious difference in the birth rate between mice obtained from sgRNA-Atg7 and sgRNA-Rosa26 embryos (Figure 6B). However, all the atg7 KO mice had movement disorders and were hard to turn their bodies over (Video S2), indicating the nervous system was impaired. DNA sequencing analysis of the brain, heart, liver as well as the tail tissues from three mice (mice #2, 3, 4) indicated that all the mice carried complete atg7 KO, with large-fragment exon deletion (Table S4B). Notably, we observed that the brain was the most severely affected part compared with other organs, as indicated with significant weight reduction and neuron apoptosis (Fig. S6D and E). In addition, AP staining of genital ridges suggested that the PGC numbers in E10.5 sgRNA-Atg7 embryos were reduced compared with the sgRNA-Rosa26 controls (Fig. S6F and G), consistent with the low PGCLC induction in atg7 KO EpiLCs (Figure 2J).
Figure 6.
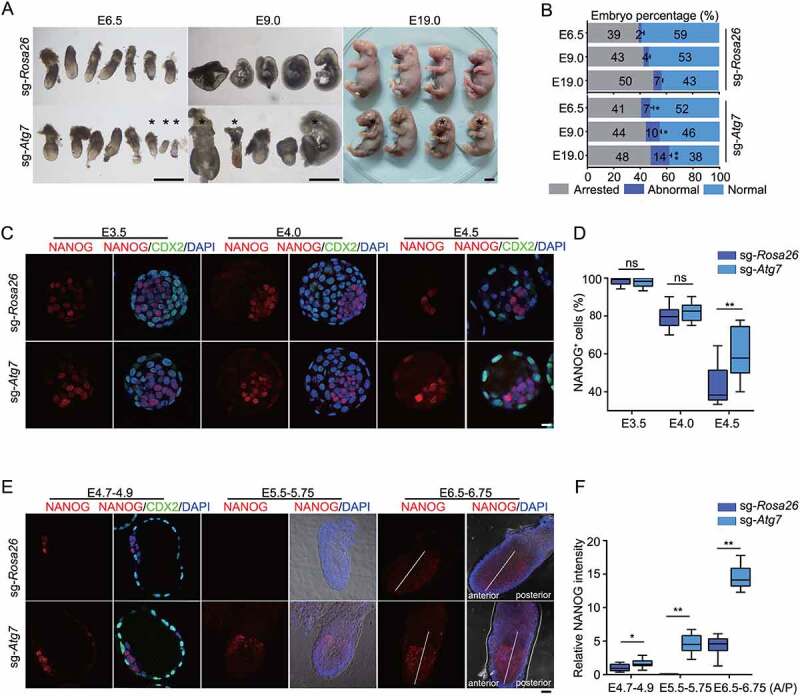
ATG7-mediated autophagy regulates peri-implantation embryonic development. (A) The effect of ATG7-mediated autophagy on embryonic development. Embryos injected with sgRNAs were transferred into the oviduct of psedudopregnants. Representative images showing conceptuses at E6.5, E9.0 and E19. *represents abnormal embryos. Scale bars: 1 mm. (B) Quantification of arrested, abnormal and normal embryos in (A). The number of total transferred sgRNA-injected embryos minus obtained embryos at indicated time represents arrested embryos. * p < 0.05, **p < 0.01, compared to sgRNA-Rosa26 embryos. (C) The NANOG expression in late pre-implantation stages. Immunofluorescence analysis of NANOG (red), CDX2 (green) and DAPI (blue) was performed at E3.5, E4.0 and E4.5 in sg-Atg7 and sg-Rosa26 embryos to follow NANOG expression in late pre-implantation stages. Each image is representative of three different experiments. Scale bars: 20 µm. (D) Data analysis of NANOG positive cell proportion in ICM of embryos derived from (C). DAPI-positive cell number minus CDX2 positive cell number represents epiblast and hypoblast cell numbers. Data are presented as mean ± s.d. n = 20. **p < 0.01, ns, not significant. (E) The NANOG expression in early post-implantation stages. Immunofluorescence analysis of NANOG (red), CDX2 (green) and DAPI (blue) was performed at E4.7–4.9. Images for Bright field, NANOG (red) and DAPI (blue) were taken at E5.5–5.75 and E6.5–6.75 in sg-Atg7 and sg-Rosa26 embryos. Data are representative of three different experiments. Scale bars: 20 µm. (F) Data analysis of relative NANOG intensity in embryos derived from (E). Data are presented as mean ± s.d. n = 6. * p < 0.05, **p < 0.01. All the experiments were repeated at least three times. sg-Atg7, sgRNA-Atg7; sg-Rosa26, sgRNA-Rosa26.
To evaluate whether impaired peri-implantation development was also NANOG dependent, we investigated NANOG expression in the embryonic development window from the pre-implantation stages (E3.5-E4.5) to the post-implantation stages (E4.7-E6.5). At E3.5, the NANOG positive (NANOG+) cells in ICM were almost 100% both in sgRNA-Atg7 and sgRNA-Rosa26 embryos (Figure 6C, D). From E3.5 to E4.5, we observed increased NANOG positive cell numbers in sgRNA-Atg7 embryos (Figure 6C, D). In controls, NANOG was gradually downregulated and it was almost completely excluded from the epiblast in sgRNA-Rosa26 embryos. At post-implantation stages (E4.7-E6.75), prolonged NANOG expression was still observed in sgRNA-Atg7 embryos. A distribution of NANOG was readily detected in the epiblast of sgRNA-Atg7 embryos at E5.5, when NANOG was absent in sgRNA-Rosa26 embryos (Figure 6E, F). Interestingly, we observed that NANOG was upregulated in the anterior side of the epiblast (Figure 6E, F), a transient tissue layer known to develop into both the central nervous system and the epidermis [42]. These results indicate that sustained NANOG expression correlates with ATG7 deletion-associated peri-implantation developmental defects.
Therefore, our data demonstrate that ATG7 deficiency leads to impaired peri-implantation development, which may further result in neurological deficit. In addition, ATG7 deficiency-induced abnormal NANOG expression was also observed during this developmental stage.
Competitive role of NANOG and OTX2 disrupt neuronal differentiation
Given the upregulated expression that we observed for NANOG at the anterior side of the E6.5-epiblast (Figure 6E, right), and considering the strong enrichment of NANOG in atg7 KO EpiLC sites (Fig. S4D), we reasoned that NANOG might impact lineage priming through its association with chromatin. To characterize potential NANOG-mediated epigenetic modifications, we utilized ChIP-seq to detect H3K27ac, H3K4me1, and H3K4me3 in d4-atg7 KO and d4-Control EpiLCs on day 4. Attesting to the data quality, the ChIP peak intensities for all three of these analyzed were highly correlated across two biological replicates (Pearson’s correlation > 0.8; Fig. S7A). We used DiffBind to identify the differential binding regions for NANOG between d4-atg7 KO and d4-Control EpiLCs (Table S5): more than 90% of the NANOG binding regions had stronger signals in the d4-atg7 KO EpiLCs (Fig. S7B). These regions showed relatively high levels of ATAC-seq, H3K4me1 and H3K27ac signals, indicating that these enhancers have high activity in atg7 KO EpiLCs (Figure 7A and S7G). By contrast, there was no obvious difference in the levels of H3K4me3 modifications at these NANOG binding regions between the d4-atg7 KO and d4-Control EpiLCs, results consistent with our finding that fewer than 30% of the NANOG ChIP-seq peaks overlapped with gene promoters (< 1Kb at the distance of TSS) (Fig. S7D). We cataloged each of the nearest genes to these NANOG binding regions, and a GO analysis indicated enrichment among these neighbor genes for annotations related to forebrain development and neuronal differentiation processes (Fig. S7E). In addition, we compared expression of these neighbor genes in d4-atg7 KO and d4-Control EpiLCs. In d4-atg7 KO EpiLCs, fully 15% of the predicted NANOG gene targets were significantly up-regulated (Fig. S7F). These results indicate that the occupancy of NANOG in d4-atg7 KO EpiLCs somehow promotes the deposition of transcriptional enhancer histone modifications, and suggest that the overall influence of NANOG’s epigenetic regulation in these cells is the dysregulation of neuronal differentiation gene programs.
Figure 7.
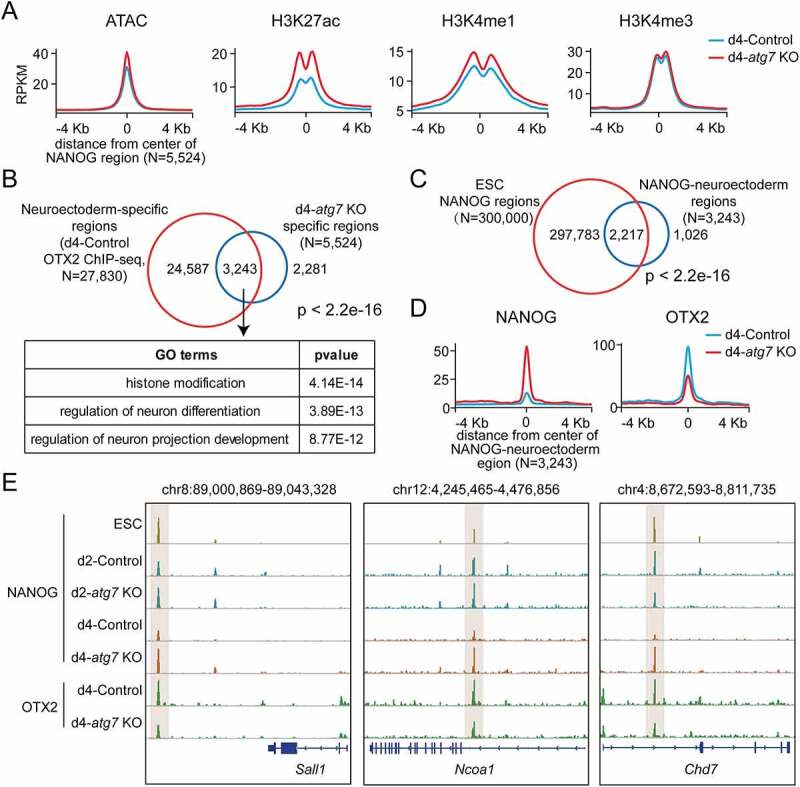
NANOG regulates neuroectoderm-specific enhancers by antagonizing OTX2. (A) Average profiles for ATAC-seq, H3K27ac, H3K4me1, and H3K4me3 around the central position of d4-atg7 KO specific regions in d4-atg7 KO and d4-Control EpiLCs. (B) Venn diagram showing the overlap between the neuroectoderm-specific regions marked by OTX2 ChIP-seq in d4-Control EpiLCs and d4-atg7 KO specific regions (regions colored in red in Fig. S7B). GO enrichment analysis was performed on the 3,243 overlap regions. Two-sided P values (Fisher’s exact test) are shown. (C) Venn diagram showing the overlap between the NANOG-bound regions in ESC [84] and NANOG-neuroectoderm regions (overlap regions in Figure 7B). Two-sided P values (Fisher’s exact test) are shown. (D) Average profiles for NANOG and OTX2 around the central position of NANOG-neuroectoderm regions (overlap regions in Figure 7B) in d4-atg7 KO and d4-Control EpiLCs. (E) Representative genome browser views showing the NANOG and OTX2 in Control, atg7 KO or ESC cells near Sall1, Ncoa1, Chd7 gene loci.
Pursuing how NANOG impacts the regulation of neural development genes, we performed ChIP-seq on the neuroectoderm marker OTX2 [43] in d4-Control EpiLCs to indicate neural differentiation-associated regulatory regions. Compared with control EpiLCs, the OTX2 expression was unaltered in atg7 KO EpiLCs (Fig. S7C). We found that 60% of NANOG binding regions (d4-atg7 KO specific) overlapped with OTX2-specific regulatory regions (Figure 7B, up). GO analysis indicated that the overlapped regions are enriched for genes involved in histone modification and neural differentiation (Figure 7B, bottom). In addition, 70% of overlapped regions were bound by NANOG at the ESC stage (Figure 7C). The results showed that the binding properties of NANOG with chromatin during the differentiation process were maintained longer after Atg7 was depleted. Previous report indicated that NANOG and OTX2 had antagonistic effects on neural developmental genes [44]. Therefore, we investigated whether NANOG could interfere with the occupation of OTX2 in NANOG binding regions (overlapped regions in Figure 7B). The results indicated that NANOG occupancy leads to reduced OTX2 binding on the analyzed NANOG binding regions (Figure 7D). The negative effects of NANOG on OTX2 binding were confirmed in the neural associated enhancers of Sall1, Ncoa1 and Chd7 genes (Figure 7E). Our results showed a competitive role of OTX2 and NANOG in neural differentiation regulation.
The embryoid body (EB) formation assay indicated that genes representing neuroectoderm were significantly downregulated in atg7 KO ESCs compared to that of the controls (Fig. S8A). To further explore the potential effect of prolonged NANOG expression on neural differentiation, Dox inducible atg7 KO ESCs were induced for neural commitment with or without Dox treatment (Fig. S8B). Our results showed a persistent NANOG expressed observed in atg7 KO EpiLCs was still indicated throughout the course of neural differentiation. The derivation of neural progenitors and mature neurons were compromised upon Atg7 depletion, as evidenced by much less expression of SOX1 at day 6 and mature neuron marker βIII-tubulin positive cells at day 12. Correspondingly, our qPCR results confirmed that the neural differentiation related marker genes Pax6 and Nestin were not responsive to neural differentiation in atg7 KO compared to the control (Fig. S8C). These results demonstrated that Atg7 depletion led to abnormal neural differentiation.
Together, our data collectively indicate a novel regulatory mechanism of NANOG induced by ATG7 deficiency, which disrupts normal neuroectoderm development through antagonizing OTX2 to activate neural development related enhancers.
Discussion
In this study, we set out to understand the role of autophagy in the naive-to- primed transition. By using an in vitro model of the naive-to-primed transition, we identified a dynamic autophagic flux throughout the transition process and validated the important function of autophagy. Furthermore, our study uncovered a significant effect of autophagy on the global transcriptome and chromatin accessibility and identified NANOG as an important target during the naive-to-primed transition. Finally, we demonstrated that the notable reduction of NANOG protein regulated by autophagy during the pluripotency transition was an important mechanism for exiting from naive pluripotency and achieving lineage commitment, which was also necessary for successful embryonic development.
Naive and primed pluripotency are two transient pluripotent states in vivo and the transition represents peri-implantation embryonic development. These two pluripotent cell types exhibit marked molecular and functional differences, which subsequently influence their characteristics, function and safety. By using an in vitro transition model, we and others [5,45] successfully obtained EpiLCs, which displayed typical morphological and molecular features of EpiSC derived from E5.5 Epiblast (Fig. S1). Both naive and primed pluripotent cells share the same core transcriptional network driven by POU5F1-SOX2-NANOG; however, their genome-wide binding profiles are distinct as indicated by ChIP combined with genomic analysis [5,46,47], indicating a whole genome remodeling of the epigenetic landscape. In support of this concept, gain- and loss-of-function studies show that several pioneer regulators govern essential nuclear and cytoplasmic events during the naive-to-primed transition [7,8,48], which provide more fundamental properties of these sub-states of pluripotency and the means by which the naive-to-primed transition occurs. However, to date, critical factors or biological processes that are responsible for the exit from the naive state and primed state establishment have remained largely unknown.
Autophagy is a highly conserved degradation mechanism that involves in pluripotency acquirement and maintenance [12,49]. Here, by using robust detection assays, we defined autophagy to be highly dynamic during the naive-to-primed pluripotency transition with a peak level at the middle stage (day 2–3) of this transition (Figure 1A-C). Nevertheless, a decreased number of autophagosomes was observed on day 1, and we cannot exclude that the suppressed autophagic flux is due to rapidly activated FGF2/bFGF and INHBA/Activin A signaling but not pluripotency transition, as FGF-FRS2/FRS2α and INHBA/Activin A-SMAD signaling pathways inhibit autophagy in some context-dependent manners [50,51]. Pharmacological inhibition and gene ablation experiments indicated that the dynamic autophagic flux is critical to promote exit from the naive state and program ESCs to primed pluripotency (Figure 1 D and E; Figure 2F, G). It is worth noting that there are distinct features in terms of the metabolic state [18], mitochondrial function [52] and protein expression profiles [53] between these two pluripotent states, all of which are closely associated with autophagy induction. Therefore, it is reasonable that there is a negative impact of ATG7 deficiency on the pluripotency transition, as indicated by decreased cell proliferation (Figure 2C) and increased apoptotic rates (Figure 2D). One of the major characteristics of the naive-to-primed transition is to make PGC-specific enhancers more accessible and lead to PGC specification [54,55]. Our study showed a significant reduction in the induction of PGCLCs from atg7 KO EpiLCs, but ectopic Atg7 expression at ESC or d2-EpiLC stages, but not d4-EpiLC stage, could rescue or partially rescue this deficit (Figure 2J). Hence, incomplete naive-to-primed transition caused by loss of autophagy may contribute to impaired re-activation of naive pluripotency and early germ line genes.
NANOG is a naive pluripotency regulator, and its expression is repressed during the naive-to-primed transition [56]. Indeed, overexpression of NANOG maintains LIF-independent self-renewal by sustaining H3K27me3 at developmental regulators [44]. Here we observed that during the naive-to-primed transition, atg7 KO EpiLCs had sustained Nanog expression (Figure 4B and Figure 5A), which was a barrier for the naive-to-primed transition. Meanwhile, a subset of naive pluripotency related genes was not repressed while genome-wide de novo DNA methylation may not be fully established during this transition (Figure 3G). Unlike the dual regulatory roles of POU5F1 in both the naive and primed states [5], NANOG plays a less predominant role in the primed pluripotency gene network because its low expression in primed cells is not sufficient to regulate target genes. Indeed, overexpression of NANOG in EpiLCs cannot maintain primed pluripotency, but promotes germline specification through binding active enhancers proximate to the Prdm14 and Prdm1 loci [57], suggesting the epigenetic resetting of NANOG binding profiles in EpiLCs was associated with germline specification. In this study, we observed that NANOG in atg7 KO EpiLCs specifically binds naive pluripotency-related regions, enriched with active enhancer markers (Figure 4D). These data indicated that NANOG binding profiles were locked in naive pluripotency and further verified the incomplete exit from the naive state.
The molecular machinery for selective autophagy must ensure efficient recognition and sequestration of the cargo within autophagosomes [58]. SQSTM1/p62 is an autophagic cargo receptor that specifically binds the cargo material and the phagophore membrane for degradation of ubiquitinated substrates [59]. Here we defined a novel protein interaction mechanism that SQSTM1/p62 could translocate into the nucleus and directly bind with K63-polyubiquitinated NANOG for protein degradation. In support of the protein interaction, we first observed the accumulation of NANOG and SQSTM1/p62 protein in atg7 KO EpiLCs during the naive-to-primed transition (Figure 5A). NANOG is a short-lived protein whose turnover mediated by the ubiquitin-dependent proteasome system is critical for naive pluripotency maintenance [34]. Here our study for the first time showed a novel mechanism that NANOG was specifically regulated post-transcriptionally by autophagy because the half-life of NANOG was extended in atg7 KO EpiLCs under the condition of proteasome inhibition (Figure 5B). Previous studies showed that SQSTM1/p62 protein can be observed transiently in the nucleus and identified residues that contribute to this localization [38]. Consistently, accumulation of nuclear localized SQSTM1/p62 was observed in atg7 KO EpiLCs (Figure 5C, D). Mutation in the nucleus export signal of SQSTM1/p62 attenuated the reducing of NANOG (Figure 5E), further reflecting a necessary SQSTM1/p62 trans-nucleus mechanism in NANOG degradation during the pluripotency transition. Recently, a growing number of protein substrates for selective autophagy have been identified [60,61], and various degradation pathways are pointed out to reflect the essential role of SQSTM1/p62 in regulating degradation of K63-ubiquitinated proteins. In this study, we showed that SQSTM1/p62 can both bind to K48- or K63-linked UB chains (Figure 5F). However, during the naive-to-primed transition, NANOG preferentially binds to K63-linked UB chains and SQSTM1/p62 facilitates the degradation of NANOG through its C-terminal UBA domain (Figure 5G, H). Notably, we also observed the transcriptional upregulation corresponding to Nanog gene site in atg7 KO EpiLCs during the pluripotency transition (Table S2), which makes it reasonable to ask whether the high NANOG expression in atg7 KO EpiLCs is due to increased transcription or reduced autophagy-dependent protein degradation. Our ChIP-seq data showed that NANOG directly bound to a NANOG-recognized element site within the Nanog promoter and contributed to the regulation of Nanog expression (Fig S8D-F), which suggested a NANOG-Nanog positive feedback mechanism in atg7 KO EpiLCs during the naive-to-primed transition (Fig. S8G).
A previous study indicates that autophagy is essential for the very early stages of embryonic development because atg5-null embryos cannot proceed beyond the 4- to 8-cell stage [9]. Our results suggest a autophagy in early embryonic development because the development of ATG7-deficient embryo to the blastocyst stage is not changed significantly (Fig. S6C). In addition, we also successfully derived and established atg7−/− ESC lines in 2iL condition by using the corresponding blastocysts (data not shown), further demonstrating a nonessential role for ATG7-mediated autophagy in ESC maintenance under 2iL conditions. The negative impact of loss of ATG7-dependent autophagy on embryonic development is concentrated on peri-implantation development (Figure 6A). A previous report indicates that ATG7 plays an important role in nucleophagy [62] and it can deacetylate LC3 from the nuclear pool and facilitate nucleocytoplasmic translocation of LC3 for autophagy induction [63]. According to our proceeding results, we conclude that peri-implantation development is a process where nuclear events happen for which ATG7-dependent autophagy is needed. Because the rates of developmental defects were not dramatically increased with progression of developmental stages (Figure 6B), we also conclude that the peri-implantation window plays a check-point role for the development of ATG7-deficient embryos. atg7−/− mice obtained by breeding Atg7± mice are born at Mendelian frequency; however, these mice have decreased body weight and die within 1 d after birth [64]. Using our methods, despite some fetuses being born at term, we found that all sgRNA-Atg7 mice had movement disorders (Video S2) and died within 5 days. Their slightly prolonged survival relative to atg7−/− mice is most likely due to mosaicism in the mutants generated by Cas9/sgRNA (Table S4).
Despite the important role of autophagy in pluripotency maintenance, the early events of lineage commitment are also highly correlated with autophagy activity [65]. Loss of autophagy leads to severe neurodegenerative disorders and neuronal abnormalities [66], which may further contribute to neonatal lethality [64]. In this study, we demonstrated that sustained NANOG expression and chromatin association transcriptionally affected neuronal differentiation-related gene expression through binding to their enhancers (Figure 7A,B). During early stages of ES cell differentiation into the neuroectoderm, NANOG is reported to co-occupy with the master differentiation gene Hoxa1 to target regions that are associated with genes involved in differentiation pathways [67], providing a potential regulatory link between NANOG and ESC differentiation. In this study, with the identification of neuroectoderm-associated genes by OTX2 ChIP-seq data, we showed that the neural regulatory model targeted by NANOG already existed at the ESC stage and the chromatin association sustained due to prolonged expression of NANOG during pluripotency transition (Figure 7B, C). Our study also provides potential insight into the competitive role of NANOG in regulating neuronal differentiation. The occupation of NANOG in neuronal differentiation related regions alleviated the impact of OTX2 (Figure 7D, E), which is a master TF for premature neuroectoderm specification.
In sum, by combining the cell identity of EpiLCs and the developmental phenotypes in ATG7-dificiency embryos, we propose a model (Figure 8) in which ATG7-mediated autophagy governs the naive-to-primed transition through gradual NANOG degradation in an SQSTM1/p62-dependent pathway, with a large reduction in NANOG causing naive pluripotency exit with decreased naive transcript and closed naive chromatin accessibility. In addition, ATG7-deficient embryos display sustained expression of NANOG in the anterior side of the epiblast, which in turn affects subsequent fetal growth through competitively binding enhancers proximal to neural development genes.
Figure 8.
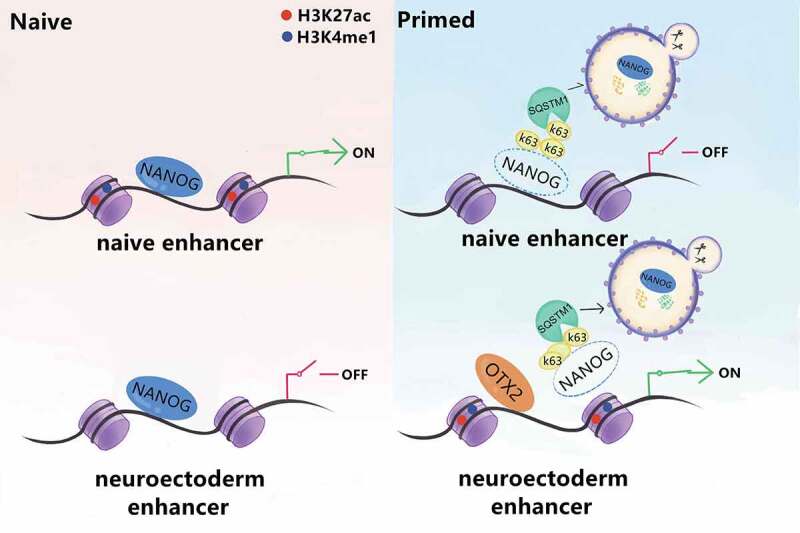
Diagram illustrating the proposed mechanisms for alteration of naive-to-primed transition and peri-implantation development in vivo. Our data suggests that autophagy is required for exit from naive state, primed establishment and germline specification. Through degradation of NANOG in an SQSTM1/p62-mediated pathway, autophagy downregulates the NANOG level and NANOG occupancy in naive related enhancers, and therefore dismantles the naive pluripotency expression program. In the primed state, the elimination of NANOG caused by autophagy improves OTX2 binding to its neuro-related enhancers, which further govern the normal neuronal differentiation process both in vivo and in vitro.
Materials and methods
Animal care
ICR, KM, and BALB/c nude mice were purchased from Vital River Laboratories (China; 201, 202, and 211). 6-8-week-old ICR strain mice were used for zygote collection. 8–10-week-old KM females were used as recipients. BALB/c nude mice were used for teratoma detection. All the animals were housed under SPF conditions in a controlled environment of lighting (lights on at 6:00–18:00), temperature (23 ± 2°C) and humidity (50 ± 5%), with free access to food and water. The Animal Care and Use Committee of Huazhong Agriculture University approved all animal experiments (No. HZAUMO-2018-046).
Mouse embryonic stem cells
ES cell lines used to detect autophagic flux were derived from embryos injected with the linear pEGFP-LC3 (Addgene, 24,920; deposited by Toren Finkel) or mCherry-EGFP-LC3B (Addgene, 22,418; deposited by Jayanta Debnath) plasmids. The other ES cell lines generated from this study were derived from E14Tg2 (E14) and R1 (129/Sv x 129/Sv-CP) and their identities were verified by several means including pluripotency gene expression, cell proliferation, resistance to drug selection, PCR and sequencing of specific genomic regions.
ESC culture, EpiLC and PGCLC induction
ESCs were routinely cultivated on mitotically inactivated mouse embryonic fibroblasts (MEFs) in Knockout DMEM (Gibco, 10,829–018) supplemented with 20% Knockout Serum Replacement (KSR; Gibco, 10,828–028), 1× Glutamine Max (Thermo Fisher Scientific, 35,050–061), 1× NEAA (Thermo Fisher Scientific, 10,378–016), 1× Pen/Strep (Thermo Fisher Scientific, 15,140–122), 0.1 mM β-mercaptoethanol (Sigma, M6250), 1000 U ml−1 LIF (Merck Millipore, LIF1050), 1 μM PD0325901 (Selleck, S1036) and 3 μM CHIR99021 (Selleck, S2924). MEFs were grown in DMEM high glucose (Gibco, 11,965–084) supplemented with 15% FBS and 1× Pen-Strep. HEK297T cells used for lentivirus production were grown in DMEM supplemented with 10% FBS and 1× Pen-Strep. EpiLCs induction was performed by seeding 1.0 × 10⁵ ESCs into a well of a 12-well plate coated with 16.7 mg/ml human plasma fibronectin (Merck Millipore, FC010) in N2B27 medium containing 20 ng/ml INHBA/Activin A (Peprotech, 233-FB), 12 ng/ml FGF2/bFGF (R&D system, 13,256–029), and 20% KSR. The culture medium was changed every day. The PGCLCs were generated under a floating condition by plating 1.0 × 10³ EpiLCs in a well of an ultra-low cell attachment U-bottom 96-well plate in a serum-free medium (GMEM [Gibco, 11,710–035] with 15% KSR, 0.1 mM NEAA, 1 mM sodium pyruvate [Gibco, 11,360–070], 0.1 mM 2-mercaptoethanol, 1× Pen-Strep, and 2 mM L-Glutamine [Gibco, 25,030–149]) in the presence of 500 ng/ml BMP4 (Peprotech, 120–05ET), 1000 U/ml LIF, 100 ng/ml KITL/SCF (R&D Systems, 455-MC), 500 ng/ml BMP8B (R&D Systems, 1073-BP), and 50 ng/ml EGF (R&D Systems, 2028-EG).
Neural differentiation
Neural commitment assay was performed according to methods previously reported [68]. Briefly, approximately 1.0 × 10⁴ ESCs were plated at in N2B27 medium supplemented with 1 mM L-glutamine and 0.1 mM β-mercaptoethanol for 6 days. For mature neuron derivation, cells were subsequently dissociated and plated on poly-d-lysine (PDL; Sigma, P7504) and laminin (Sigma; FC-010)-coated plates at the same cultural conditions for another 6 days.
Chemical treatment
All chemicals used in this study were purchased from Sigma Aldrich. Dox-inducible gene knockout was induced by addition of 200 ng/ml Dox (Sigma, D9891) at day 0 of EpiLC induction. During naive-to-primed transition, 30 µM chloroquine (Sigma, C6628), 5 mM 3-MA (Selleck, S2767), 10 µg/ml cycloheximide (Sigma, C1988), and 10 µM MG132 (Sigma, M7449) were used. Transitioning cells were treated with chloroquine for 6 h before FACS analysis, western blot and immunofluorescent detection. For AP staining, 3-MA was treated at the indicated day during pluripotency transition. For half-time detection, 10 µg/ml cycloheximide treatment was used for the indicated hours with or without 10 µM MG132 for additional 2 h.
CRISPR-CAS9 targeting of genes in mESCs and pre-implantation embryos
The Cas9 target sequences in the Atg7 gene were selected using the web-based tool Benchling (https://benchling.com) and shown in Table S1A. The sgRNA pairs were subcloned into a lentiviral backbone vector lenti-sgRNA (Addgene, 104,990; deposited by Brett Stringer). Drug-inducible Cas9-2A-GFP vector TLCV2 (Addgene, 87,360; deposited by Adam Karpf) was used to introduce the cut and nucleotide deletion. To prepare lentivirus, HEK293T cells underwent liposome-mediated transduction with the paired plasmids and the lentivirus packaging vectors PSPAX2 (Addgene, 12,260; deposited by Didier Trono) and pMD2.G (Addgene, 12,259; deposited by Didier Trono) (3:2:1). Lentivirus supernatant was harvested at 48 and 72 h post-transfection and infections were carried out in the presence of 8 µg/ml of polybrene (Merck Millipore, H9268). After 48 h of G418 (500 µg/ml; Sigma; A1720) and puromycin (1 µg/ml; Sigma; P7255) screening, GFP positive ESCs were sorted and single cells were plated into 96 well plates the next day. Positive clones were expanded and genotyped for shifts in PCR product size.
To generate NanoS3–T2A–mCherry-reporter ESC lines, 5′ and 3′ homology arms were amplified from mouse cDNA by specific primers. (800-bp 5′ arm, F1-GTCGCCCTTGTCGACGGATCCCAGGATGGCAGGTGCTTGC, R1- CTGTCCCTCCACTACGGCCGGATCCGGAGAGGGGCAGAGGA; 800-bp 3′ arm, F1-TACAAGTGATCTAGAAAGCTTGCTGGAGACTGGACCTTGCTTA, R1- CACTGTGTTCCCCCTATGCAGAAAGCTTAAGGGCGACCGCCC). The 5′ and 3′ homology arms were inserted into the PBM16A-T2A-mCherry vector. A 20-bp sequence (5′-TGGAGTGGGGAGGACCATGG-3′) preceding the stop codon targeted by gRNA/Cas9 was subcloned into px330 (Addgene, 98,750; deposited by Jinsong Li) to introduce the cut and mediate homologous recombination. Individual Clone was picked and sequenced until homozygous inserted mutant was found.
For gene editing in pre-implantation embryos, T7 promoter was added to sgRNA template by PCR amplification of px330, using primers listed in (Table S1A). The T7-sgRNA PCR product was used as the template for IVT using MEGA shortscript T7 kit (Life Technologies, AM1354). The sgRNAs were purified using MEGA clear kit (Life Technologies, M1909) and eluted in RNase-free water. Then, Cas9 mRNA (100 ng/ml; Invitrogen, A29378) and sgRNAs (50 ng/ml) were mixed and injected into the cytoplasm of fertilized eggs with well recognized pronuclei in a droplet of HEPES-CZB medium using a FemtoJet microinjector (Eppendorf) with constant flow settings.
Plasmid construction
The cDNA of Atg7, Nanog and Sqstm1 were amplified from mouse ESCs and subcloned into the plVX vector (Addgene, 125,839; deposited by Boyi Gan). Deletion mutants of SQSTM1/p62 including SQSTM1/p62ΔUBA, SQSTM1/p62ΔNES were generated by subcloning corresponding fragments of Sqstm1 cDNA. Ubiquitin plasmids including K63-only, K48-only, K63R, and K48R mutant were gifts from Prof. Hong-Bing Shu at Wuhan University, China.
In vitro culture of embryos and embryo transfer
For in vitro culture of embryos before pre-implantation stages, the injected zygotes were cultured in G1 plus medium (Vitrolife, 10,132) covered with mineral oil under 37°C, 5% CO2 conditions. The development of the embryos was checked daily under a microscope. For embryo transfer, we performed four independent injection rounds. The first round was performed with 311 embryos (Rosa26 = 142 embryos, Atg7 = 169 embryos), the second with 242 embryos (Rosa26 = 118 embryos, Atg7 = 124 embryos), the third with 234 embryos (Rosa26 = 114 embryos, Atg7 = 120 embryos). These embryos were transferred into the oviduct of psedudopregnant KM mice 0.5 d post-coitus with a mouth pipette. The recipients were sacrificed and the embryos were obtained at E6.5, E9.0 and E19.0, respectively. The last round was performed with 120 embryos (Rosa26 = 60 embryos, Atg7 = 60 embryos). The embryos were collected at E5.5–5.75 and E6.5 for immunohistochemistry assays.
Immunofluorescent detection and alkaline phosphatase (AP) staining
Cells or embryos were fixed with 4% paraformaldehyde for 1 h and permeabilized with 0.5% Triton X-100 (Sigma, 93,443) in PBS (Gibco, 20,012,027) for 30 min at room temperature. Cells or embryos were then blocked with 1% BSA (Beyotime, China, ST023) for 1 h at room temperature and incubated with primary antibody overnight at 4°C. The samples were washed with PBS containing 0.1% Triton X-100 and incubated with the secondary antibody for 1 h at room temperature. Nuclei were stained with DAPI (Sigma, D9542) for 10 min. The images were taken with a LSM800 confocal microscope system (Zeiss) and processed using Zen 2.3 lite software and Adobe Photoshop CS6.
For AP staining, cells were fixed in 4% paraformaldehyde for 5 min, washed twice with cold DPBS (Gibco, 14,190,144) and incubated with AP staining solution (Beyotime, China, C3206) for 30 min. The staining reaction was stopped with RNase-free water. The images were taken on a TS100 microscope (Nikon).
Antibodies
Anti-POU5F1/OCT4 (ab181557), anti-SOX2 (ab79351), anti-NANOG (ab80892), anti-OTX2 (ab78078), anti-H3K4me3 (ab8580), anti-H3K9me3 (ab8898), anti-H3K27ac (ab4729), anti-H3K4me1 (ab176877), anti-H3K27me3 (ab6002), anti- ACTB (ab8227), anti-TUBB3/βIII-tubulin (ab78078), anti-HA-tag (ab9110), anti-K48-linkage polyubiquitin (ab140601), anti-K63-linkage polyubiquitin (ab179434), goat anti-rabbit-HRP (ab6721), and goat anti-mouse-HRP (ab6789) were purchased from Abcam. Anti-ATG7 (8558), anti-LC3B (3868), anti-SQSTM1 (23,214), anti-SOX1 (4194), and anti-MYC-tag (2276) were purchased from Cell Signaling Technology. Anti-POU5F1/OCT4 (39,811), anti-NANOG (61,419) were purchased from Active Motif. Anti-ATG5-12 (A2859), rabbit anti-LC3B (L7543), and monoclonal anti-FLAG (F1804) were purchased from Sigma. Anti-BECN1 (bs-1353 R), donkey anti-Rabbit Alexa Flour 555 (bs-0295D-A555), and rabbit anti-Mouse Alexa Flour 488 (bs-0296 R-A488) were purchased from Bioss.
Transmission electron microscopy and flow cytometry
For transmission electron microscopy (TEM), cells were harvested by trypsin digestion and fixed with 2.5% glutaraldehyde on ice for 2 h followed by postfixation in 2% osmium tetroxide. Samples were immersed in EPON812 resin after dehydrating with sequential washes in 50, 70, 90, 95 and 100% ethanol. The ultrathin sections were collected on copper grids and counterstained using uranyl acetate and lead citrate. Images were taken with a FEI Tecnai spirit transmission electron microscope.
For flow cytometry, cells were harvested with trypsin, washed with PBS and washed twice with PBS containing 0.05% saponin (Sigma, 84,510). More than 20,000 events were captured for every analysis. FACS data were collected using a FACSCalibur flow cytometer (Beckman) with CXP cytometer software. Data analysis was carried out with FlowJo.
Live cell imaging
pEGFP-LC3 ESCs were cultured at a density of ~5× 10⁴ cells per ml in “2iL” condition at 37°C and 5% CO2. After incubation for 1 day to make sure adhesion of the majority of the cells was accomplished, the cells were washed three times with PBS and processed for EpiLCs induction prior to luminescence imaging measurements. The cell images were captured at an interval of 30 min with a Zeiss LSM 800 NLO confocal microscope (63× /NA 1.4 oil immersion objective) and analyzed using the AxioVision 4.2 software (Carl Zeiss).
Cell apoptosis detection
Cell apoptosis was analyzed with the one step TUNEL kit (Beyotime, China, C1089). Briefly, cells were washed with PBS twice and fixed with 4% paraformaldehyde for 20 min, followed by permeabilization with 0.05% Triton X-100 for 5 min. The TUNEL reaction mixture prepared as indicated by the instructions was applied to cells for 1 h at 37°C in the dark. The FITC-labeled TUNEL-positive cells were imaged under a fluorescent microscope. The cells with red fluorescence were defined as apoptotic cells. Alternatively, CASP3 activity was measured using a Caspase-3 activity kit (Beyotime, China, P9710). Briefly, cells were collected using trypsin digestion and washed with cold PBS twice, suspended in lysis buffer and incubated on ice for 20 min. The lysate was centrifuged at 16,000 × g at 4°C for 10 min. CASP3 (caspase 3) activity assays were performed in 96-well microtiter plates by incubation of 10 μl cell lysate protein in 80-μl reaction buffer containing 10 μl CASP3 substrate (Ac-DEVD-pNA) at 37°C for 2 h. Samples were measured with PE Enspire Plate Reader (Perkin Elmer) at an absorbance of 405 nm.
Genotyping
Mouse 8-cell stage embryos were digested with Acid Tyrode’s solution to remove the zona pellucida. The embryos were transferred into 0.25% trypsin and the individual blastomeres were separated by gentle pipetting. The blastomeres were washed in 0.25% trypsin for 5 times and transferred into a PCR tube. The genotypes of mutant mice were determined by PCR of genomic DNA extracted from brain, heart, liver and tails. DNA extraction was performed according to the manufacturer’s instructions (TIANGEN, DP304). PCR amplification was performed using nested primer sets (Table S1A). PCR was performed for 34 cycles at 95°C for 30s, 60°C for 30s, and 72°C for 1 min, with a final extension at 72°C for 5 min. Secondary PCR was performed using 0.5 µg primary PCR product and nested inner primer. PCR was carried out in the same reaction mixture. The PCR product was gel purified and cloned using a pMD-19 t cloning kit (Vazyme, China, C601) following the manufacturer’s instructions. Colonies were picked from each transformation and then Sanger sequencing was applied to detect mutations.
RNA extraction, reverse transcription and quantitative real-time PCR
Total RNA was isolated using TRIzol (Invitrogen, 15,596–018), and the reactions were performed with cDNA Synthesis Kit (Vazyme, R212-01) according to the manufacturer’s protocol. Quantitative real-time PCR was performed with AceQ Universal SYBR qPCR Master Mix (Vazyme, China, Q511-02) in a reaction volume of 10 μl and the Bio-Rad CFX96 ConnectTM Real-Time PCR Detection System (Bio-Rad). Primers were selected according to Primer Bank (http://pga.mgh.harvard.edu/primerbank) and listed in Table S1B. Melting curves were analyzed to verify amplification specificity. Delta-Delta Ct value represented the mRNA expression, and the data were normalized to Actb.
Luciferase assay
The Pou5f1/Oct4 distal/proximal enhancer activity assay was performed according to a previously described protocol [69]. Briefly, the Pou5f1 enhancer fragments were amplified and subcloned into the pGL3-Promoter Vector (Promega, E1761) using standard cloning techniques. For the luciferase assays, equimolar amounts of each construct were liposome-mediated transfected into 2 × 10⁶ HEK293T cells along with the pRL-TK (Addgene, 27,163; deposited by Ron Prywes) vector as an internal control. Assays were performed 24 hours later using the Dual-Luciferase Reporter Assay System (Promega, E1910) and signals were detected using a PE Enspire Plate Reader (Perkin Elmer).
Teratoma formation and histological analysis
EpiLCs were suspended at 1 × 10⁸ cells/ml in DPBS. Nude mice were anesthetized with diethyl ether. 100 µl of the cell suspension (1 × 10⁷ cells) were injected subcutaneously into the dorsal flank. Six weeks after the injection, tumors were surgically dissected from the mice. Samples were weighed, fixed in PBS containing 4% paraformaldehyde, and embedded in paraffin. Sections were stained with hematoxylin and eosin.
Nuclear-cytoplasmic protein separation
Nuclear and cytoplasmic proteins were extracted using a Nuclear-Cytoplasmic Extract Kit (Sangon, China, C510001). Briefly, 5 × 10⁷ cells were lysed in cytoplasmic buffer containing protease inhibitors, mixed and incubated for 15 min at 4°C followed by centrifugation at 13,400 × g for 20 min at 4°C. The supernatant containing cytoplasmic protein was collected. The remaining cell pellets at the bottom of tubes were collected and resuspended in nucleus buffer for 10 min at 4°C. The sample was centrifuged at 13,400 × g for 10 min at 4°C. The supernatant containing nuclear proteins was collected for analysis.
Co-immunoprecipitation and western blot
Cell pellets were resuspended in IP lysis buffer (50 mM Tris HCl, pH 7.4, 150 mM NaCl, 1% NP-40 [Roche, 11,332,473,001], 0.5% sodium deoxycholate [Sigma, D6750], 0.1% SDS and protease inhibitor cocktail [Roche, 4,693,116,001]). The lysates were immunoprecipitated with 2 µg of specific antibody and 30 µl A/G agarose beads (Sigma, 88,804) overnight at 4°C. The precipitates were washed three times with lysis buffer, and the immune complexes were boiled with loading buffer for 10 min before analysis by SDS-PAGE. Original blots are shown in the file Data S1.
For western blot, cells were lysed in lysis buffer (50 mM Tris-HCl, pH 7.4, 150 mM NaCl, 1% NP-40, 0.5% sodium deoxycholate, 0.1% SDS and protease inhibitor cocktail). Protein concentration was detected with the BCA method (Beyotime, China, P0009). Equivalent protein quantities were subjected to SDS-PAGE, and transferred to PVDF membranes (Millipore, IPVH00010). Membranes were blocked with 5% BSA (Beyotime, China, ST023) for 1 h at room temperature and then probed with the indicated primary antibodies overnight at 4°C, followed by the appropriate HRP-conjugated secondary antibodies for 2 h at room temperature. After washing with TBST (Solarbio, T1081) three times, the blotted membranes were visualized with SuperSignal West Pico chemiluminescent substrate (Pierce Chemical, 34,580).
RNA-Seq and data analysis
Two micrograms of total RNA were used for RNA sample preparation. Sequencing libraries were generated using NEBNext® Ultra™ RNA Library Prep Kit for Illumina® (NEB, E7530L) following the manufacturer’s recommendations and index codes were added to attribute sequences to each sample. RNA concentration of library was measured using Qubit® RNA Assay Kit in Qubit® 3.0 to preliminarily quantify and then dilute to 1 ng/μl. Library quality was assessed using the Agilent Bioanalyzer 2100 system. RNA-seq libraries (Table S6) were sequenced with a 2 × 150 bp strand-specific protocol on a HiSeq 2500 sequencer (Illumina). Reads of RNA-seq were mapped to the mm10 genome (GRCm38) with STAR [70] using the ENCODE standard options. Gene expression levels were quantified by Stringtie [71] using the refFlat database from the UCSC genome browser. Expression level of each gene was quantified with normalized FPKM (Fragments per kilobase of exon per million mapped reads). Gene differential expression analysis using DESeq2 [72] based on the reads count file was obtained by featureCounts [73]. Spearman’s r coefficient was calculated using the cor function in R. To assess the expression level of repeats elements, all RNA-seq data were remapped to the mm10 genome using STAR with the option “–outFilterMultimapNmax 500”. Only reads mapped to less than 500 positions in the genome were retained for further analysis. Use of HOMER’s analyzeseats.pl script to specify “repeat and -noadj” to get reads counts for each repeat family [74].
ATAC-seq
ATAC-seq was performed as previously described [26]. In brief, a total of 50,000 cells were washed once with 50 µl of cold PBS and resuspended in 50 µl lysis buffer (10 mM Tris-HCl, pH 7.4, 10 mM NaCl, 3 mM MgCl2, 0.2% [v:v] IGEPAL CA-630). The suspension of nuclei was then centrifuged for 10 min at 500 g at 4°C and diluted to 5 ng/µl in the elution buffer (10 mM Tris buffer, pH 8), followed by the addition of 50 µl transposition reaction mix (10 µl 5× TTBL, 5 µl TTE Mix V50 and nuclease-free H2O up to 50 µl) of TruePrep DNA library Preparation Kit V2 (Vazyme, China, TD501-503). Then the reaction mix was mixed thoroughly by pipetting gently for 20 times, samples were then incubated at 55°C for 10 min. To amplify transposed DNA fragments, 10 µl sample was combined with 25 µM Customized Nextera PCR Primer and 25 µl NEB Next High-Fidelity 2× PCR Master Mix (New England Biolabs, M0541). ATAC-seq libraries were subjected to 9 cycles of PCR amplification. To determine the suitable number of cycles required for the second round of PCR the library was assessed by quantitative PCR as described [75] and the library was then PCR amplified for the appropriate number of cycles. Libraries were purified with a Qiaquick PCR (Macherey Nagall, 740,609) column. Library concentration was measured using a KAPA Library Quantification kit (KAPA Biosystems, KK4824) according to the manufacturer’s instructions. Library integrity was checked by gel electrophoresis.
ChIP-seq
ChIP was performed as described previously [76]. Briefly, cells were fixed in 5 mL PBS containing 1% formaldehyde for 10 min at room temperature with rotation, the reaction was quenched by the addition of 2 mL of 0.125 M glycine for 5 min rotation at room temperature. And then the cells were washed with PBS 3 times. Cells were lysed in ChIP buffer A (50 mM HEPES-KOH, 140 mM NaCl, 1 mM EDTA, pH 8.0, 10% glycerol, 0.5% NP-40, 0.25% Triton X-100, 50 mM Tris-HCl, pH 8.0, and protease inhibitor cocktail) for 10 min at 4°C. Pellets were lysed in ChIP buffer B (1% SDS, 50 nM Tris-HCl, pH 8.0, 10 mM EDTA and protease inhibitor cocktail) for 5 min at 4°C. The DNA was fragmented to 100–500 bp by sonication, and then centrifuged at 12,000 g for 2 min. The supernatant was diluted with ChIP IP buffer (0.01% SDS, 1% Triton X-100, 2 mM EDTA, 50 mM Tris-HCl, pH 8.0, 150 mM NaCl and protease inhibitor cocktail). Immunoprecipitation was performed using 2 mg antibody added to protein A/G Dynabeads (Life Technologies, 10015D), and incubated overnight at 4°C. Beads were washed, eluted and reverse crosslinked. DNA was purified by using the MinElute Reaction Clean up Kit (Beckman Coulter, A63881). ChIP-seq libraries were prepared according to the recommendation described in the KAPA DNA Library Preparation Kits (KAPA Biosystems, KK8502). 125 bp sequencing was further performed on an Illumina platform.
ATAC-seq, ChIP–seq data analysis
DNA libraries (Table S6) from ATAC, NANOG ChIP, OTX2 ChIP, H3K27ac ChIP, H3K4me1 ChIP, H3K4me3 ChIP and corresponding input DNA samples were prepared according to Illumina protocol and sequenced on illumina platform. Paired-end reads for ATAC-seq and ChIP-seq were aligned to the mouse mm10 genome using Bowtie2 [77] with the “-X 2000” options. The Picard was used to remove PCR duplicates and Samtools [78] was used to remove low quality reads (MAPQ < 30). The MACS2 [79] software calls the ChIP-seq peak with default parameters and calls the ATAC-seq peak with the “-nomodel” and “-nolambda” parameters. Two biological replicates were sequenced for each condition and initially analyzed separately to ensure results were consistent between replicates, then Bedtools [80] was used to determine repeated consistent peak calls (overlapping at least 50%). Significant changes in d4-atg7-KO and d4-Control EpiLC ATAC-seq data were identified using the DiffBind software package, with FDR < 0.05 and fold change (FC) > 1 was considered to be significant changes. Motif analysis was performed using HOMER with default settings. Density profiles of chromatin marks around NANOG-bound regions were computed using deepTools [81].
Comparison between ATAC-seq and ChIP-seq repetitions
RPKM was calculated using a 5000-bp sliding window to compare the correlation of genome-wide chromatin accessibility and ChIP-seq intensity between biological replicates. Pearson’s correlation was used for all analyzed.
Clustering analysis
All ATAC-seq peaks from ESC, d2-Control EpiLC and d4-Control EpiLC were combined and genes with low expression (FPKM <1) in three cell lines were deleted. K-means clustering of gene expression and chromatin accessibility was performed using kmeans. Finally, the gene set was divided into four clusters based on the FC of the transcription level between d4-atg7-KO and d4-Control EpiLC. Compared with ESC, d2-Control and d4-Control continued to be down-regulated, and the gene expression of d4-atg7KO higher than d4-Control was cluster1 (FC > 1, padj < 0.05), and the gene set with no significant difference between the two expressions was cluster2 (padj > 0.05); compared with ESC, d2-Control and d4-Control were continuously up-regulated, and the gene set with higher expression of d4-Control than d4-atg7 KO was cluster3 (FC < 1, padj < 0.05), and the gene set with no significant difference between the two expressions was cluster4 (padj > 0.05). The chromatin accessibility classification was also the same.
Functional enrichment analysis
The GO (Gene ontology) and KEGG (Kyoto Encyclopedia of Genes and Genomes) enrichment analyzed were performed by using clusterProfiler [82] R package. Gene Set Enrichment Analysis (GSEA) was performed using the GSEA [83] option following the provided instructions (http://www.broadinstitute.org/gsea/index.jsp). The considered gene sets consisted of: the top 500 up-regulated and down-regulated genes in d2-atg7 KO versus d2-Control; d4-atg7 KO versus d4-Control is the top 500 up-regulated and down-regulated genes; up-regulated genes (FC > 2, padj < 0.05) and down-regulated genes in ESC versus EpiLC (FC < 0.5, padj < 0.05).
Statistical analysis
Data were analyzed using SPSS version 16.0 (SPSS Inc., Chicago, IL, USA) or R (http://www.r-project.org). Statistical significance was calculated with two-tailed unpaired Student’s t test (P< 0.05 was considered statistically significant). All experiments were repeated at least three times unless otherwise stated. Results were expressed as the mean ± s.d. Values of p < 0.05 were considered statistically significant.
Supplementary Material
Acknowledgments
We thanked Dr. Heide Schatten (University of Missouri) for helping us to improve our English language. We are grateful to Prof. Carmen J. Williams (National Institute of Environmental Health Sciences, NIH), Jin He (Michigan State University) and Jinsong Li (Institute of Biochemistry and Cell Biology, Chinese Academy of Sciences) for critical reading of the manuscript and advice throughout this project. We are grateful to Fangke Wang for her assistance in the pattern diagram drawing.
Funding Statement
This work was supported by the National Key Research and Development Program of China, Stem Cell and Translational Research (Grant# 2016YFA0100203), the National Natural Science Foundation of China (Grant# 31801242), the project supported by the Fundamental Research Funds for the Central University (Grant# 2662020DKQD001), the Project funded by China Postdoctoral Science Foundation (Grant# 2018M632883, 2019T120668).
Data availability
The authors declare that all data supporting the findings of this study are available within the article and its Supplementary Information files or from the corresponding author on reasonable request. All data have been deposited to GEO with the accession number GSE150870 and GSE160976.
Disclosure statement
No potential conflict of interest was reported by the author(s).
Supplementary material
Supplemental data for this article can be accessed here
References
- [1].Hackett JA, Surani MA.. Regulatory principles of pluripotency: from the ground state up. Cell Stem Cell. 2014;15(4):416–430. [DOI] [PubMed] [Google Scholar]
- [2].Smith A. Formative pluripotency: the executive phase in a developmental continuum. Development. 2017;144(3):365–373. [DOI] [PMC free article] [PubMed] [Google Scholar]
- [3].Kojima Y, Kaufman-Francis K, Studdert JB, et al. The transcriptional and functional properties of mouse epiblast stem cells resemble the anterior primitive streak. Cell Stem Cell. 2014;14(1):107–120. [DOI] [PubMed] [Google Scholar]
- [4].Pekowska A, Klaus B, Xiang W, et al. Gain of CTCF-anchored chromatin loops marks the exit from naive pluripotency. Cell Syst. 2018;7(5):482–95 e10. [DOI] [PMC free article] [PubMed] [Google Scholar]
- [5].Buecker C, Srinivasan R, Wu Z, et al. Reorganization of enhancer patterns in transition from naive to primed pluripotency. Cell Stem Cell. 2014;14(6):838–853. [DOI] [PMC free article] [PubMed] [Google Scholar]
- [6].Hayashi K, Ohta H, Kurimoto K, et al. Reconstitution of the mouse germ cell specification pathway in culture by pluripotent stem cells. Cell. 2011;146(4):519–532. [DOI] [PubMed] [Google Scholar]
- [7].Chen AF, Liu AJ, Krishnakumar R, et al. GRHL2-dependent enhancer switching maintains a pluripotent stem cell transcriptional subnetwork after exit from naive pluripotency. Cell Stem Cell. 2018;23(2):226–38 e4. [DOI] [PMC free article] [PubMed] [Google Scholar]
- [8].Respuela P, Nikolic M, Tan M, et al. Foxd3 promotes exit from naive pluripotency through enhancer decommissioning and inhibits germline specification. Cell Stem Cell. 2016;18(1):118–133. [DOI] [PMC free article] [PubMed] [Google Scholar]
- [9].Tsukamoto S, Kuma A, Murakami M, et al. Autophagy is essential for preimplantation development of mouse embryos. Science. 2008;321(5885):117–120. [DOI] [PubMed] [Google Scholar]
- [10].Guan JL, Simon AK, Prescott M, et al. Autophagy in stem cells. Autophagy. 2013;9:830–849. [DOI] [PMC free article] [PubMed] [Google Scholar]
- [11].Wang S, Xia P, Ye B, et al. Transient activation of autophagy via Sox2-mediated suppression of mTOR is an important early step in reprogramming to pluripotency. Cell Stem Cell. 2013;13(5):617–625. [DOI] [PubMed] [Google Scholar]
- [12].Liu K, Zhao Q, Liu P, et al. ATG3-dependent autophagy mediates mitochondrial homeostasis in pluripotency acquirement and maintenance. Autophagy. 2016;12(11):2000–2008. [DOI] [PMC free article] [PubMed] [Google Scholar]
- [13].Ma T, Li J, Xu Y, et al. Atg5-independent autophagy regulates mitochondrial clearance and is essential for iPSC reprogramming. Nat Cell Biol. 2015;17(11):1379–1387. [DOI] [PubMed] [Google Scholar]
- [14].Liu P, Liu K, Gu H, et al. High autophagic flux guards ESC identity through coordinating autophagy machinery gene program by FOXO1. Cell Death Differ. 2017;24(10):1672–1680. [DOI] [PMC free article] [PubMed] [Google Scholar]
- [15].Qu X, Zou Z, Sun Q, et al. Autophagy gene-dependent clearance of apoptotic cells during embryonic development. Cell. 2007;128(5):931–946. [DOI] [PubMed] [Google Scholar]
- [16].Luo M, Zhao X, Song Y, et al. Nuclear autophagy: an evolutionarily conserved mechanism of nuclear degradation in the cytoplasm. Autophagy. 2016;12(11):1973–1983. [DOI] [PMC free article] [PubMed] [Google Scholar]
- [17].Baek SH, Kim KI. Epigenetic control of autophagy: Nuclear events gain more attention. Mol Cell. 2017;65(5):781–785. [DOI] [PubMed] [Google Scholar]
- [18].Zhou W, Choi M, Margineantu D, et al. HIF1alpha induced switch from bivalent to exclusively glycolytic metabolism during ESC-to-EpiSC/hESC transition. EMBO J. 2012;31(9):2103–2116. [DOI] [PMC free article] [PubMed] [Google Scholar]
- [19].Wu J, Ocampo A, Belmonte JCI. Cellular metabolism and induced pluripotency. Cell. 2016;166(6):1371–1385. [DOI] [PubMed] [Google Scholar]
- [20].Klionsky DJ, Abdelmohsen K, Abe A, et al. Guidelines for the use and interpretation of assays for monitoring autophagy (3rd edition). Autophagy. 2016;121–222. [DOI] [PMC free article] [PubMed] [Google Scholar]
- [21].Kabeya Y, Mizushima N, Ueno T, et al. LC3, a mammalian homologue of yeast Apg8p, is localized in autophagosome membranes after processing. EMBO J. 2000;19(21):5720–5728. [DOI] [PMC free article] [PubMed] [Google Scholar]
- [22].Fedorko M. Effect of chloroquine on morphology of cytoplasmic granules in maturing human leukocytes–an ultrastructural study. J Clin Invest. 1967;46(12):1932–1942. [DOI] [PMC free article] [PubMed] [Google Scholar]
- [23].Seglen PO, Gordon PB. 3-Methyladenine: specific inhibitor of autophagic/lysosomal protein degradation in isolated rat hepatocytes. Proceedings of the National Academy of Sciences of the United States of America 1982;79:1889–1892. [DOI] [PMC free article] [PubMed] [Google Scholar]
- [24].Xie Z, Klionsky DJ. Autophagosome formation: core machinery and adaptations. Nat Cell Biol. 2007;9(10):1102–1109. [DOI] [PubMed] [Google Scholar]
- [25].Gkountela S, Li Z, Vincent JJ, et al. The ontogeny of cKIT+ human primordial germ cells proves to be a resource for human germ line reprogramming, imprint erasure and in vitro differentiation. Nat Cell Biol. 2013;15(1):113–122. [DOI] [PMC free article] [PubMed] [Google Scholar]
- [26].Buenrostro JD, Giresi PG, Zaba LC, et al. Transposition of native chromatin for fast and sensitive epigenomic profiling of open chromatin, DNA-binding proteins and nucleosome position. Nat Methods. 2013;10(12):1213–1218. [DOI] [PMC free article] [PubMed] [Google Scholar]
- [27].Orkin SH. Chipping away at the embryonic stem cell network. Cell. 2005;122(6):828–830. [DOI] [PubMed] [Google Scholar]
- [28].Kook SH, Jeon YM, Lim SS, et al. Fibroblast growth factor-4 enhances proliferation of mouse embryonic stem cells via activation of c-Jun signaling. PloS one. 2013;8:e71641. [DOI] [PMC free article] [PubMed] [Google Scholar]
- [29].Lee BK, Uprety N, Jang YJ, et al. Fosl1 overexpression directly activates trophoblast-specific gene expression programs in embryonic stem cells. Stem Cell Res. 2018;26:95–102. [DOI] [PMC free article] [PubMed] [Google Scholar]
- [30].Wo Y, Zhu D, Yu Y, et al. Involvement of NF-kappaB and AP-1 activation in icariin promoted cardiac differentiation of mouse embryonic stem cells. Eur J Pharmacol. 2008;586(1–3):59–66. [DOI] [PubMed] [Google Scholar]
- [31].Dhaliwal NK, Miri K, Davidson S, et al. KLF4 nuclear export requires erk activation and initiates exit from naive pluripotency. Stem Cell Reports. 2018;10(4):1308–1323. [DOI] [PMC free article] [PubMed] [Google Scholar]
- [32].Pfeuty B, Kress C, Pain B. Network features and dynamical landscape of naive and primed pluripotency. Biophys J. 2018;114(1):237–248. [DOI] [PMC free article] [PubMed] [Google Scholar]
- [33].Fullgrabe J, Klionsky DJ, Joseph B. The return of the nucleus: transcriptional and epigenetic control of autophagy. Nat Rev Mol Cell Biol. 2014;15(1):65–74. [DOI] [PubMed] [Google Scholar]
- [34].Jin J, Liu J, Chen C, et al. The deubiquitinase USP21 maintains the stemness of mouse embryonic stem cells via stabilization of Nanog. Nat Commun. 2016;7(1):13594. [DOI] [PMC free article] [PubMed] [Google Scholar]
- [35].Seibenhener ML, Babu JR, Geetha T, et al. Sequestosome 1/p62 is a polyubiquitin chain binding protein involved in ubiquitin proteasome degradation. Mol Cell Biol. 2004;24(18):8055–8068. [DOI] [PMC free article] [PubMed] [Google Scholar]
- [36].Bjorkoy G, Lamark T, Brech A, et al. p62/SQSTM1 forms protein aggregates degraded by autophagy and has a protective effect on huntingtin-induced cell death. J Cell Biol. 2005;171(4):603–614. [DOI] [PMC free article] [PubMed] [Google Scholar]
- [37].Pankiv S, Lamark T, Bruun JA, et al. Nucleocytoplasmic shuttling of p62/SQSTM1 and its role in recruitment of nuclear polyubiquitinated proteins to promyelocytic leukemia bodies. J Biol Chem. 2010;285(8):5941–5953. [DOI] [PMC free article] [PubMed] [Google Scholar]
- [38].Sanchez-Martin P, Saito T, Komatsu M. p62/SQSTM1: ‘Jack of all trades’ in health and cancer. FEBS J. 2019;286(1):8–23. [DOI] [PMC free article] [PubMed] [Google Scholar]
- [39].Wurzer B, Zaffagnini G, Fracchiolla D, et al. Oligomerization of p62 allows for selection of ubiquitinated cargo and isolation membrane during selective autophagy. eLife. 2015;4:e08941. [DOI] [PMC free article] [PubMed] [Google Scholar]
- [40].Isogai S, Morimoto D, Arita K, et al. Crystal structure of the ubiquitin-associated (UBA) domain of p62 and its interaction with ubiquitin. J Biol Chem. 2011;286(36):31864–31874. [DOI] [PMC free article] [PubMed] [Google Scholar]
- [41].Chu VT, Weber T, Graf R, et al. Efficient generation of Rosa26 knock-in mice using CRISPR/Cas9 in C57BL/6 zygotes. BMC Biotechnol. 2016;16(1):4. [DOI] [PMC free article] [PubMed] [Google Scholar]
- [42].Wilson PA, Hemmati-Brivanlou A. Induction of epidermis and inhibition of neural fate by Bmp-4. Nature. 1995;376(6538):331–333. [DOI] [PubMed] [Google Scholar]
- [43].Kurokawa D, Sakurai Y, Inoue A, et al. Evolutionary constraint on Otx2 neuroectoderm enhancers-deep conservation from skate to mouse and unique divergence in teleost. Proceedings of the National Academy of Sciences of the United States of America. 2006;103:19350–19355. [DOI] [PMC free article] [PubMed] [Google Scholar]
- [44].Heurtier V, Owens N, Gonzalez I, et al. The molecular logic of Nanog-induced self-renewal in mouse embryonic stem cells. Nat Commun. 2019;10(1):1109. [DOI] [PMC free article] [PubMed] [Google Scholar]
- [45].Yamaji M, Ueda J, Hayashi K, et al. PRDM14 ensures naive pluripotency through dual regulation of signaling and epigenetic pathways in mouse embryonic stem cells. Cell Stem Cell. 2013;12(3):368–382. [DOI] [PubMed] [Google Scholar]
- [46].Galonska C, Ziller MJ, Karnik R, et al. Ground state conditions induce rapid reorganization of core pluripotency factor binding before global epigenetic reprogramming. Cell Stem Cell. 2015;17(4):462–470. [DOI] [PMC free article] [PubMed] [Google Scholar]
- [47].Weinberger L, Ayyash M, Novershtern N, et al. Dynamic stem cell states: naive to primed pluripotency in rodents and humans. Nat Rev Mol Cell Biol. 2016;17(3):155–169. [DOI] [PubMed] [Google Scholar]
- [48].Bahat A, Goldman A, Zaltsman Y, et al. MTCH2-mediated mitochondrial fusion drives exit from naive pluripotency in embryonic stem cells. Nat Commun. 2018;9(1):5132. [DOI] [PMC free article] [PubMed] [Google Scholar]
- [49].Sharif T, Martell E, Dai C, et al. Autophagic homeostasis is required for the pluripotency of cancer stem cells. Autophagy. 2017;13(2):264–284. [DOI] [PMC free article] [PubMed] [Google Scholar]
- [50].Zhang J, Liu J, Huang Y, et al. FRS2alpha-mediated FGF signals suppress premature differentiation of cardiac stem cells through regulating autophagy activity. Circ Res. 2012;110(4):e29–39. [DOI] [PMC free article] [PubMed] [Google Scholar]
- [51].Xue LX, Xu ZH, Wang JQ, et al. Activin A/Smads signaling pathway negatively regulates oxygen glucose deprivation-induced autophagy via suppression of JNK and p38 MAPK pathways in neuronal PC12 cells. Biochem Biophys Res Commun. 2016;480(3):355–361. [DOI] [PubMed] [Google Scholar]
- [52].Carbognin E, Betto RM, Soriano ME, et al. Stat3 promotes mitochondrial transcription and oxidative respiration during maintenance and induction of naive pluripotency. EMBO J. 2016;35(6):618–634. [DOI] [PMC free article] [PubMed] [Google Scholar]
- [53].van Mierlo G, Wester RA, Marks H. A mass spectrometry survey of chromatin-associated proteins in pluripotency and early lineage commitment. Proteomics. 2019;19(14):e1900047. [DOI] [PubMed] [Google Scholar]
- [54].Ohinata Y, Ohta H, Shigeta M, et al. A signaling principle for the specification of the germ cell lineage in mice. Cell. 2009;137(3):571–584. [DOI] [PubMed] [Google Scholar]
- [55].Guibert S, Forne T, Weber M. Global profiling of DNA methylation erasure in mouse primordial germ cells. Genome Res. 2012;22(4):633–641. [DOI] [PMC free article] [PubMed] [Google Scholar]
- [56].Du P, Pirouz M, Choi J, et al. An intermediate pluripotent state controlled by micrornas is required for the naive-to-primed stem cell transition. Cell Stem Cell. 2018;22:851–64 e5. [DOI] [PMC free article] [PubMed] [Google Scholar]
- [57].Murakami K, Gunesdogan U, Zylicz JJ, et al. NANOG alone induces germ cells in primed epiblast in vitro by activation of enhancers. Nature. 2016;529(7586):403–407. [DOI] [PMC free article] [PubMed] [Google Scholar]
- [58].Johansen T, Lamark T. Selective autophagy mediated by autophagic adapter proteins. Autophagy. 2011;7(3):279–296. [DOI] [PMC free article] [PubMed] [Google Scholar]
- [59].Pankiv S, Clausen TH, Lamark T, et al. p62/SQSTM1 binds directly to Atg8/LC3 to facilitate degradation of ubiquitinated protein aggregates by autophagy. J Biol Chem. 2007;282(33):24131–24145. [DOI] [PubMed] [Google Scholar]
- [60].Feng L, Zhang J, Zhu N, et al. Ubiquitin ligase SYVN1/HRD1 facilitates degradation of the SERPINA1 Z variant/alpha-1-antitrypsin Z variant via SQSTM1/p62-dependent selective autophagy. Autophagy. 2017;13(4):686–702. [DOI] [PMC free article] [PubMed] [Google Scholar]
- [61].Jiao L, Zhang HL, Li DD, et al. Regulation of glycolytic metabolism by autophagy in liver cancer involves selective autophagic degradation of HK2 (hexokinase 2). Autophagy. 2018;14(4):671–684. [DOI] [PMC free article] [PubMed] [Google Scholar]
- [62].Fu N, Yang X, Chen L. Nucleophagy plays a major role in human diseases. Curr Drug Targets. 2018;19(15):1767–1773. [DOI] [PubMed] [Google Scholar]
- [63].Huang R, Liu W. Identifying an essential role of nuclear LC3 for autophagy. Autophagy. 2015;11(5):852–853. [DOI] [PMC free article] [PubMed] [Google Scholar]
- [64].Komatsu M, Waguri S, Ueno T, et al. Impairment of starvation-induced and constitutive autophagy in Atg7-deficient mice. J Cell Biol. 2005;169(3):425–434. [DOI] [PMC free article] [PubMed] [Google Scholar]
- [65].Sharma K, Asp NT, Harrison SP, et al. Autophagy modulates cell fate decisions during lineage commitment. Autophagy. 2021;1–17. DOI: 10.1080/15548627.2021.2008691 [DOI] [PMC free article] [PubMed] [Google Scholar]
- [66].Komatsu M, Wang QJ, Holstein GR, et al. Essential role for autophagy protein Atg7 in the maintenance of axonal homeostasis and the prevention of axonal degeneration. Proceedings of the National Academy of Sciences of the United States of America. 2007;104:14489–14494. [DOI] [PMC free article] [PubMed] [Google Scholar]
- [67].De Kumar B, Parker HJ, Parrish ME, et al. Dynamic regulation of Nanog and stem cell-signaling pathways by Hoxa1 during early neuro-ectodermal differentiation of ES cells. Proceedings of the National Academy of Sciences of the United States of America. 2017;114:5838–5845. [DOI] [PMC free article] [PubMed] [Google Scholar]
- [68].Han X, Gui B, Xiong C, et al. Destabilizing LSD1 by Jade-2 promotes neurogenesis: an antibraking system in neural development. Mol Cell. 2014;55(3):482–494. [DOI] [PubMed] [Google Scholar]
- [69].Tesar PJ, Chenoweth JG, Brook FA, et al. New cell lines from mouse epiblast share defining features with human embryonic stem cells. Nature. 2007;448(7150):196–199. [DOI] [PubMed] [Google Scholar]
- [70].Dobin A, Gingeras TR. Mapping RNA-seq Reads with STAR. [DOI] [PMC free article] [PubMed]
- [71].Pertea M, Pertea GM, Antonescu CM, et al. StringTie enables improved reconstruction of a transcriptome from RNA-seq reads. [DOI] [PMC free article] [PubMed]
- [72].Love Mi Fau - Huber W, Huber W Fau - Anders S, Anders S. Moderated estimation of fold change and dispersion for RNA-seq data with DESeq2. [DOI] [PMC free article] [PubMed]
- [73].Liao Y, Smyth Gk Fau - Shi W, Shi W. featureCounts: an efficient general purpose program for assigning sequence reads to genomic features. [DOI] [PubMed]
- [74].Heinz S, Benner C Fau - Spann N, Spann N Fau - Bertolino E, et al. Simple combinations of lineage-determining transcription factors prime cis-regulatory elements required for macrophage and B cell identities. [DOI] [PMC free article] [PubMed]
- [75].Buenrostro JD, Wu B, Chang HY, et al. ATAC-seq: a method for assaying chromatin accessibility genome-wide. Curr Protoc Mol Biol. 2015;109(1):21 9 1–9 9. [DOI] [PMC free article] [PubMed] [Google Scholar]
- [76].Liu J, Han Q, Peng T, et al. The oncogene c-Jun impedes somatic cell reprogramming. Nat Cell Biol. 2015;17(7):856–867. [DOI] [PubMed] [Google Scholar]
- [77].Langmead B, Salzberg SL. Fast gapped-read alignment with Bowtie 2. [DOI] [PMC free article] [PubMed]
- [78].Zhong J, Agha G, Baccarelli AA. The role of DNA methylation in cardiovascular risk and disease. Circ Res. 2016;118(1):119–131. [DOI] [PMC free article] [PubMed] [Google Scholar]
- [79].Zhang Y, Liu T Fau - Meyer CA, Meyer Ca Fau - Eeckhoute J, et al. Model-based analysis of ChIP-Seq (MACS). [DOI] [PMC free article] [PubMed]
- [80].Quinlan AR, Hall IM. BEDTools: a flexible suite of utilities for comparing genomic features. [DOI] [PMC free article] [PubMed]
- [81].Ramirez F, Dundar F, Diehl S, et al. deepTools: a flexible platform for exploring deep-sequencing data. [DOI] [PMC free article] [PubMed]
- [82].Yu G, Wang Lg Fau - Han Y, Han Y, et al. clusterProfiler: an R package for comparing biological themes among gene clusters. [DOI] [PMC free article] [PubMed]
- [83].Subramanian A, Tamayo P Fau - Mootha VK, Mootha Vk Fau - Mukherjee S, et al. Gene set enrichment analysis: a knowledge-based approach for interpreting genome-wide expression profiles. [DOI] [PMC free article] [PubMed]
- [84].Dunham I, Kundaje A, Aldred SF, et al. An integrated encyclopedia of DNA elements in the human genome. Nature. 2012;489:57–74. [DOI] [PMC free article] [PubMed] [Google Scholar]
Associated Data
This section collects any data citations, data availability statements, or supplementary materials included in this article.
Supplementary Materials
Data Availability Statement
The authors declare that all data supporting the findings of this study are available within the article and its Supplementary Information files or from the corresponding author on reasonable request. All data have been deposited to GEO with the accession number GSE150870 and GSE160976.