

Abstract
Light and lighting protocols of animal research facilities are critically important to the outcomes of biomedical research that uses animals. Previous studies from our laboratory showed that the wavelength (color) of light in animal housing areas affects the nocturnal melatonin signal that temporally coordinates circadian rhythms in rodents. Here, we tested the hypothesis that exposure to LED light enriched in the blue-appearing portion (460-480 nm) of the visible spectrum during the light phase (bLAD) influences circadian concentrations of select neuroendocrine hormones in adolescent Sprague–Dawley rats. Male and female rats (4 to 5 wk old) were housed on a novel IVC system under a 12L:12D in either cool-white fluorescent (control, n = 72) or bLAD (experimental, n = 72) lighting. Every third day, body weight and food and water consumption were measured. On Day 30, rats were anesthetized with ketamine/xylazine and terminal collection of arterial blood was performed to quantify serum concentrations of melatonin, corticosterone, insulin, and glucose at 6 circadian time points (0400, 0800, 1200, 1600, 2000, 2400). As compared with male and female rats housed under cool white fluorescent (CWF) lighting, rats in bLAD lighting showed a 6-fold higher peak in dark phase serum melatonin (P < 0.05). Effects on serum corticosterone were sex dependent, as CWF and bLAD females had significantly higher corticosterone levels than did CWF and bLAD males, respectively. CWF and bLAD females had significantly higher serum glucose overall as compared with males. However, serum insulin was not affected by sex (M or F) or lighting conditions (CWF or bLAD). These data show that housing Sprague–Dawley rats under bLAD lighting conditions increases circadian peaks of melatonin without increasing serum levels of corticosterone, glucose or insulin, indicating less variation of circadian cycling of key neuroendocrine hormones in bLAD-exposed rats.
Abbreviations: bLAD, blue-enriched light-emitting diode light-at-day; CWF, cool white fluorescent; HPA, hypothalamic-pituitary-adrenal; IP, intraperitoneal; ipRGC, intrinsically photosensitive retinal ganglion cell; IVC, Individual Ventilated Caging; LED, light-emitting diode; LX, lux; RHT, retinohypothalamic tract; SCN, suprachiasmic nucleus; SPD, spectral power distribution
Introduction
Animals used in research should be housed in micro- and macro-environments that promote physiologic homeostasis and the expression of normal species-specific behavior. In recent years, research regarding refinement of laboratory rodent husbandry has increased, resulting in improved animal welfare and enhanced reproducibility of research results.4 Providing considerate and compassionate care to laboratory animals improves their utility as a preclinical model for biomedical research, thus improving human and animal health.31
Extrinsic factors of laboratory animal husbandry such as light can variably affect research outcomes if species-specific guidelines are not followed.4,13 For example, our laboratory discovered that rats exposed to aberrant light during scheduled dark periods experienced significantly faster growth of breast cancer tumor xenografts.8 In general, standard lighting intensity and photoperiod inside animal vivaria should replicate the natural conditions in which their ancestors evolved for millennia under periods of alternating light and darkness from the Earth’s daily rotation around the sun.10 Specific recommendations for light intensity and duration of light cycles in animal housing rooms are outlined in the Guide for Care and Use of Laboratory Animals.31 The Guide bases its current recommendations for lighting intensity that does not cause toxic photoretinopathy in susceptible rodent strains and stocks, which include nonpigmented Sprague–Dawley rats. Light intensity in animal rooms can be up to 400 lux (lx) at 1m off the floor in an empty room, with intracage lighting intensity between 130 to 325 lx.31 Nonpigmented rodents can develop permanent retinal damage and blindness if housed under lighting 130 to 240 lx higher than the stated recommendation of 325 lx.5,41 The Guide also recognizes photoperiod as an important regulator of reproductive behavior that should be carefully considered. However, the Guide does not provide recommendations for light type or discuss the potential influences of different light types, wavelengths, and photoperiod on the circadian rhythms of metabolism and physiology of laboratory animals.
Whether provided by natural sunlight or artificial lighting, light regulates the circadian rhythms of metabolism and physiology in all vertebrates, including laboratory rodents and humans.15 As light enters the eye, photons first pass through the lens and scatter across the surface of the retina to stimulate ganglion cells, amacrine cells, and rod and cone photoreceptors; together these comprise the primary optic tract, which allows visual recognition of light.1,2,23,28 Some ganglion cells of the retina, referred as intrinsically photosensitive retinal ganglion cells (ipRGCs), contain the photopigment melanopsin, which is particularly sensitive to stimulation from short-wavelength light on the blue-appearing portion of the visible spectrum (465 to 485 nm).6,23,28,37,39,46 Once stimulated, these ipRGCs transmit this photic information via the retinohypothalamic tract (RHT) to the suprachiasmic nucleus (SCN) of the hypothalamus, with projections extending in a polysynaptic pathway to the pineal gland in the epithalamus of the brain. As an active part of the body’s endocrine system, the pineal gland produces and secretes the neurohormone melatonin (N-acetyl-5 methoxytryptamine). In laboratory rodents, melatonin reaches peak plasma concentrations during nighttime, or dark phase of the 24-h light cycle, with lowest melatonin concentrations during the day.16,21,41,42 This daily circadian rhythm of melatonin production, which is influenced by lighting intensity, duration, and wavelength, plays a significant role in regulation of metabolism and physiology of laboratory mice and rats.16,21
Recent years have seen an increased effort to replace conventional fluorescent lighting used in laboratory animal housing facilities with more cost- and energy-efficient LED lighting.40 Of particular focus is the use of blue-enriched LED lighting that mimics the wavelength of natural sunlight and, therefore, preferentially stimulates retinal ipRGCs.15,28 Despite the increasing use of blue-enriched LED in animal facilities worldwide, little is known about its effects on circadian rhythms of animals used in research. Previous studies from our laboratory showed a 6-fold increase in nighttime melatonin production in mice housed under bLAD light as compared with CWF lighting.16 A similar study in rats21 showed that male rats housed under blue-enriched LED lighting exhibited 7-fold increase in nighttime melatonin production as compared with rats housed under fluorescent lighting. Similar research in humans showed phase shifting of salivary melatonin and cortisol in individuals exposed to blue LED light (100 lx, 470 nm) for 20 min upon waking.24 The study we present here is the first, to our knowledge, to assess serum neuroendocrine hormones between both CWF and bLAD groups and male and female rats.
In this study, we postulate that daytime exposure to blue-enriched LED lighting (bLAD) will provide less variation in circadian cycling of serum melatonin, corticosterone, insulin, and glucose in male and female adolescent Sprague–Dawley rats as compared with control rats housed under cool-white fluorescent (CWF) lighting. In addition, we hypothesize that male and female rats housed under the same lighting conditions (CWF or bLAD) will show no significant difference in serum levels of melatonin, corticosterone, insulin, and glucose across multiple circadian time points.
Materials and Methods
Animals, housing conditions, and diet.
Male (n = 72) and female (n = 72) nonpigmented, outbred Sprague–Dawley rats (Crl:CD, strain code 001, 4 to 5 wk old) were purchased from Charles River Laboratories (Raleigh, NC) for use in this experiment. Rats were verified by the vendor as free from the following pathogens: Sendai virus, pneumonia virus of mice, Kilham rat virus, Toolan H-1 virus, rat minute virus, rat parvovirus 1 and 2, reovirus, rat Theilovirus, lymphocytic choriomeningitis virus, Hantavirus, mouse adenovirus, common bacterial species of rats excluding Staphylococcus aureus, as well as common endo- and ectoparasites. The rats were housed in an AAALAC-accredited facility for 30 d in standard transparent, polycarbonate rat cages (Super Rat 1400 cage, 15-¾ in.× 13-¼ in. × 7-⅜ in. [40 cm × 33.7 cm × 18.7 cm], Lab Products, Seaford, DE) on hardwood shavings (coarse grade Sani-Chips® Bedding, P.J. Murphy, Montville, NJ); fed an irradiated pelleted rodent diet (LabDiet 5053, Purina, St. Louis, MO); and provided tap water from a municipal source ad libitum. Each rat was supplied with a new nylon half bone (Bio-Serv, Flemington, NJ) for enrichment and was socially housed with other rats (3 per cage) of same sex. All animals were maintained in an environmentally controlled animal housing room (25°C; 50% to 55% humidity) for the duration of the experiment. Animal care was provided according to guidelines in The Guide for the Care and Use of Laboratory Animals, with prior approval for all animal procedures from Tulane University’s IACUC (protocol #540).
IVC system specifications, lighting conditions, and spectral transmittance measurements.
Upon arrival, rats were segregated by sex and randomly divided into 2 experimental groups. The control group (n = 36 males, n = 36 females) was housed on a standard IVC system (One Cage Double Sided Ventilated Rack 88112AR, Lab Products, Seaford, DE) under room-level broad-spectrum (300 to 740 nm) cool-white fluorescent lighting (CWF; Figure 1). The CWF room lighting consisted of 2 overhead systems equipped with 4 standard soft, cool-white (2700 lm; 4100 Correlated Color Temperature [CCT]) fluorescent lamps per ballast (Philips F32T8TL841 [model 272484], Alto II Collection 32W, 48”, Series 800 Somerset, NJ), similar to the lighting conditions provided by the animal vendor during rearing. The experimental group (n = 36 males, n = 36 females) was housed in a novel light containment IVC unit (Ventilated Light Controlled Animal Housing System, Lab Products, Seaford, DE) equipped with blue-enriched LED light at day (bLAD) that was high in emission of blue-appearing portion of the visible spectrum (465 to 485 nm; 2650 lm > 5000 CTT). The blue-enriched LED lighting ran in continuous strips along the rear aspect of each shelf (n = 8) inside the bLAD containment unit (Figure 2). Both CWF and bLAD lighting systems were programmed with a 12L:12D light cycle (lights on 0600), with the animal housing room completely devoid of light during the dark phase.18
Figure 1.
Adolescent Sprague–Dawley rats (n = 36 males, n = 36 females) were housed in same-sex groups of 3 rats per cage under control CWF lighting on an IVC rack. Light contamination during the dark phase was controlled with blackout curtains at the single entrance to the animal room, in addition to covering any light-emitting sources within the room, like the cardboard-covered digital face to the IVC rack, as shown.
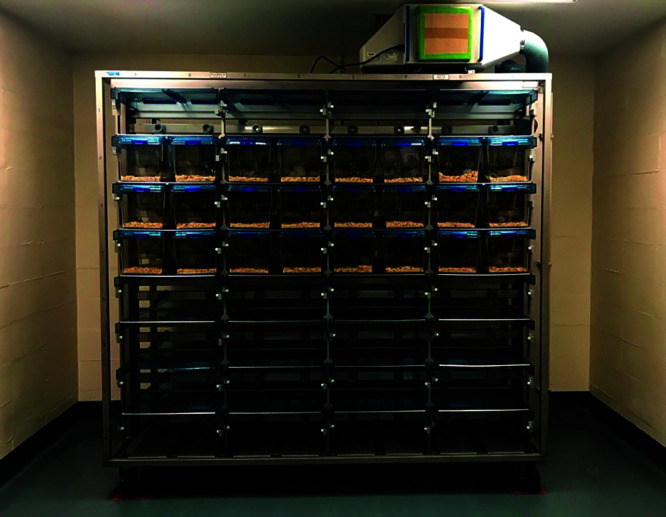
Figure 2.

Adolescent Sprague–Dawley rats (n = 36 males, n = 36 females) were housed in same-sex groups of 3 rats per cage on a novel IVC light-containment rack. Light contamination during the dark phase was controlled with the use of blackout panels on each unit and shelf of the light containment rack.
Initial measurements of CWF lighting intensity were measured at 1 m above the floor at multiple points (n = 8) in the room using an IL-1400A radiometer/photometer (International Light Technologies, Peabody, MA) with a silicon diode detector head (Model #SEL033) with a wide-angle input optic (W#6849) and a filter (F#23104) to provide a flat response across the human visible spectrum. Illuminance measures used a silicon diode detector head (Model #SEL033) with a wide-angle input optic (W10069) and a filter (Y23104) to provide a photopic illuminance response. The meter and associated optics were calibrated annually, as described previously.16-18
Baseline irradiance measurements inside the cages under CWF were measured at multiple spatial points (back right, back left, middle right, middle left, front right, front left) inside each cage. The value for overall average irradiance measured between cages was used to manually program the intensity of the bLAD lighting inside the light containment unit using the provided SunCalc software from the manufacturer (Lab Products). Lighting duration was similarly programmed to maintain rats under the standard 12L: 12D cycle (lights on 0600) inside each row of the light containment unit.
Under current convention, when discussing human and laboratory animal environments, the term lux is employed, indicating the amount of light falling on a surface that stimulates the mammalian eye during daytime, that is, the perceived brightness to the eye (photometric values). Measures of lux are appropriate for human daytime vision but are not appropriate for quantifying light stimuli that regulates circadian, neuroendocrine, or neurobehavioral physiology in animals or humans.11,26,36 Consequently, radiometric values of irradiance (µW/cm2) were measured in the cages by the radiometric detector described above. Given these standards, the light stimuli in the investigation reported here are presented in terms of lux and µW/cm2 for ease of understanding.
Calculation of effective rod, cone and melanopsin photoreceptor illuminances.
To calculate the effective rodent rod, cone, and melanopsin photoreceptor illuminances, the light sources (CWF compared with bLAD) were entered into a toolbox worksheet that is a software model for rodent photoreception freely available online.38 The spectral power distribution (SPDs) for the experiments shown here were imported into the worksheet in 1 nm increments between 325 and 782 nm. The toolbox lists the rodent spectral range as extending to 298 nm, outside the range of the spectroradiometer used in this study. As per toolbox instructions, values between 298 nm-325 nm were manually changed to zero.
Recording animal body weight, food intake, and water intake.
Upon arrival (Day 0), rats were weighed, randomly divided into single-sex groups of 3 per cage, and were identified via ear punch (Kent Scientific, Torrington, CT). Each cage was given a set weight of food (250 g) and volume of water (500 mL). On every third day (Days 3, 9, 12, 15, 18, 21, 24, 27, and 30) the rats were weighed to assess changes in body weight over time. Remaining food and water were also quantified every third day and recorded to estimate each rat’s daily food and water consumption. Rats were observed daily for health status, access to food and water, and signs of aberrant behavior such as decreased activity in the cage, hunched posture, or increased aggression to conspecifics.
Arterial blood collection.
At the experimental endpoint on Day 30, arterial blood was collected at 6 circadian time points over a 24-h collection period (0800, 1200, 1600, 2000, 2400, 0400) to detect circadian changes in neuroendocrine hormones. Starting at the 0800-time point, 2 cages of rats (6M, 6F total) were weighed and their food and water consumption quantified, as described in the previous section. Rats were then anesthetized using a ketamine (80 to 100 mg/kg; Zetamine, VetOne, Boise, ID) and xylazine (5 to 10 mg/kg; XylaMed, VetOne) combination administered intraperitoneally with a 1-mL syringe and 25-gauge hypodermic needle (MWI Animal Health, Boise, ID). Once in a surgical plane of anesthesia, as verified by negative response to toe- and tail-pinch and decreased respiratory rate, the rat was placed in dorsal recumbency with the head facing the surgeon. Fur on the ventral aspect of the neck and chest was doused with isopropyl alcohol, and sharp tissue dissection scissors were used to excise the skin over the area of the salivary complex. Forceps and curved hemostats were used to bluntly dissect the large salivary complex and isolate one of the common carotid arteries. The artery was completely transected using blunted, curved Metzenbaum scissors (MWI Animal Health, Boise, ID) to allow free-flow of arterial blood into a 15-mL conical tube (Fisherbrand, Pittsburgh, PA) and subsequent euthanasia of the rat via exsanguination. Bilateral thoracotomy was performed on each rat postmortem as a secondary method of euthanasia. This procedure was repeated for rats in both groups at the remaining time points.
Arterial collection was performed during the light phase under CWF lighting for the 0800, 1200, and 1600 time points, whereas collections at the 2000, 2400, and 0400 time points were performed during the dark-phase under dim-red light (low-intensity [<30 lx] red light provided by a 15-W incandescent white light [cat. no. #90001, Soft White Light 120V, GE Cleveland, OH] covered with Kodak 1A Red Safelight Filter cat. no #1521517, Eastman Kodak, Rochester, NY). Whole arterial blood from each rat was centrifuged for 10 min at 1500 rpm. Disposable transfer pipets were used to transfer serum from the 15-mL conical tube to corresponding labeled (Tough Tags, Diversified Biotech, Dedham, MA) microtubes (Fisherbrand). Serum was stored frozen at −20°C for future analysis of serum melatonin, corticosterone, insulin, and glucose.
Melatonin analysis.
Arterial serum melatonin levels were measured in-house via radioimmunoassay (RIA) using the melatonin rat 125I – radioimmunoassay kit (Cat. #01-RK-MEL2, Alpco, Salem, NH; Lot #1429.18, prepared by Bühlmann Laboratories, Schönenbuch, Switzerland) and analyzed using a Packard Cobra 5005 Automated Gamma Counter (Palo Alto, CA), as previously described.3,7,9,17-19,21,22 The minimal detection level for the assay was 1 to 2 pg/mL serum.
Corticosterone analysis.
This assay was performed by The University of Virginia Ligand Assay and Analysis Core. Arterial serum corticosterone of each rat was measured by RIA, using a commercial kit (MP Biomedicals; Orangeburg, NY). The method was validated for mouse serum samples using a protocol based on the recommendations of the Endocrine Society’s Sex Steroid Assays Reporting Task Force.47 The RIA evaluation included the following indices: accuracy, linearity, functional sensitivity, precision, and correlation to a previous or established method. Assay characteristics were as follows: sensitivity = 15 ng/mL; intraassay coefficient of variation (CV) = 6.3%; interassay CV = 7.1%.
Insulin analysis.
This assay was performed by The University of Virginia Ligand Assay and Analysis Core. Arterial serum insulin was measured by ELISA, using a commercial kit (MP Biomedicals; Orangeburg, NY EMD Millipore Corp; Bilerica, MA). Assay characteristics were as follows: sensitivity = 0.2 ng/mL; intraassay coefficient of variation (CV) = 4.0%; interassay CV = 5.5%.
Glucose analysis.
Aliquots of arterial rat serum were shipped to IDEXX BioAnalytics (North Grafton, MA) for a custom blood chemistry analysis. Results of serum glucose are reported.
Statistical analysis.
The following data are presented as a mean ± 1 SEM or SD unless otherwise stated. (Figures 4–8, n = 6 male and n = 6 female rats per time point; Tables 1–2, n = 36 male and n = 36 female rats for CWF and bLAD experimental group, respectively; n = 144 rats total). Comparisons of values for mean body weight, food intake, and water intake between male and female rats under CWF and bLAD over 30 d were determined by one-way ANOVA followed by the Bonferroni multiple comparison test, with a P value < 0.05 defined as statistically significant.
Figure 4.

Mean rat A) body weight ± SEM, B) daily food intake ± SEM, and C) daily water intake ± SEM between males and females in both CWF and bLAD groups over the 30-d housing period is shown.
Figure 8.

Mean serum glucose ± SEM between male and female rats in CWF and bLAD groups.
Table 1.
Calculated radiometric and photometric values and rodent photopigment illuminances (α-opic lux) of the LED and fluorescent light sources as transmitted through the animal cage
| Radiometric and Photometric Values (300 - 780 nm inclusive) | Retinal Photopigment Weighted Illuminances (α-opic lux) | ||||||
|---|---|---|---|---|---|---|---|
| Photon Flux (cm2/s) | Irradiance (µW/cm2) | Photopic Illuminance (lux) | S Cone | Melanopsin ipRGC | Rod | M Cone | |
| Cage Transmittance - Philips LED (bLAD experimental) | 1.32E+15 | 476 | 1534 | 270 | 1055 | 1148 | 1201 |
| Cage Transmittance - T8 Fluorescent (CWF control) | 1.35E+15 | 484 | 1721 | 74 | 827 | 996 | 1106 |
Table 2.
Summary of JTK_CYCLE analysis for rats maintained in CWF and bLAD lighting environments
| Estimated Peak Phasea | Phase Shift (hrs)b | Amplitudea | Fold Changeb | Q-value for Circadian Cyclinga | |||||
|---|---|---|---|---|---|---|---|---|---|
| Analyte | CWF | bLAD | CWF | bLAD | CWF | bLAD | |||
| Melatonin | Male | 22:00 | 22:00 | 0 | 40.69 | 134.66 | 3.31 | 2.31E-16 | 2.84E-18 |
| Female | 22:00 | 22:00 | 0 | 39.03 | 128.79 | 3.30 | 2.84E-18 | 8.19E-15 | |
| Corticosterone | Male | 14:00 | 16:00 | +2 | 30.46 | 214.69 | 7.05 | NS | 1.37E-03 |
| Female | 12:00 | 16:00 | +4 | 171.54 | 147.46 | −0.86 | NS | NS | |
| Insulin | Male | 22:00 | 10:00 | +12 | 0.02 | 0.04 | 2.00 | NS | NS |
| Female | 18:00 | 02:00 | +8 | 0.08 | 0.08 | 1.00 | NS | NS | |
| Glucose | Male | 10:00 | 14:00 | +4 | 12.02 | 19.09 | 1.59 | NS | NS |
| Female | 14:00 | NA | — | 6.36 | NA | — | NS | NS | |
NS, not significant
NA = Not Available. Algorithm failed to converge on a single peak phase or amplitude; a value was not provided.
Phase-, amplitude-, and multiple-testing-adjusted P value (Q) estimated by JTK_Cycle the algorithm, with P values for 20-28h periodicity, adjusted for multiple comparisons.
Phase difference and fold change are for the bLAD group relative to the CWF group. A decrease in bLAD amplitude with regard to CWF is a negative value, and an increase is represented by a positive value.
Statistical differences between mean values of serum analytes in group bLAD as compared with the control CWF group at each circadian time point were assessed by using an unpaired Student test. A P value of less than 0.05 was considered to indicate a significant difference compared with baseline values within each group. Statistical differences among group means (Figures 4–8) were determined by one-way ANOVA followed by the Bonferroni multiple comparison test. Student t test, one-way ANOVA followed by Bonferroni posthoc testing were all performed using Prism 8 (GraphPad Software, La Jolla, CA). The nonparametric JTK_CYCLE algorithm29 as implemented in scripts for the R software package (R version 3.1.0; http//openwetware.org/wiki/HughesLab:JTK Cycle) was used to determine statistical significance of 24-h cycling for each analyte, with adjustments made for multiple comparisons. This algorithm also was used to determine phase (time of peaks) and amplitude of cycling.
Results
Animal-room illumination and spectral comparisons.
Animal room illuminance and irradiance measurements (taken 1 m above the floor inside the room) varied minimally between cages housed under CWF [501 ± 3 lx (204 ± 1 µW/cm2)] and inside all 8 shelves of the experimental bLAD system [495 ± 7 lx (201 ± 3 µW/cm2)]. Measurements of photometric illuminance (lux) and radiometric irradiance (µW/cm2) in the cages of each group were derived as the mean of the values taken at 6 locations within the cages with the detector facing the light sources (back left, back right, middle left, middle right, front back, front right) at all cage positions to accurately account for rodent ocular light levels within the cages independent of the animal location. Average interior ocular light levels showed little to no intercage or intergroup variability between the CWF [51 ± 15 lx (21 ± 6 µW/cm2)] and bLAD groups, respectively [62 ± 4 lx (25 ± 1 µW/cm2)].
Normalized SPDs of the lights used in this study, as transmitted through the cage, are shown in Figure 3. The fluorescent lamp shows signature peaks in the appropriate wavelengths (545 nm and 612 nm) for this type of light. The LED light shows a standard blue LED pumped phosphor spectral power distribution with a peak at 448 nm. In terms of total energy in the 465 to 485 nm range, the LED light had 73% higher emissions than did the CWF lamp. Table 1 provides the calculated photon flux, irradiances, and weighted rodent photopigment illuminances for both lights used, as transmitted through the cage. The data illustrate that although photon flux and irradiance are similar in the 2 light sources, they are markedly different with regard to stimulation of the rodent photoreceptors. In terms of the potential light stimulation to the melanopsin containing ipRGCs, the LED lamp was calculated to have more than 28% higher emissions than did the CWF lamp.
Figure 3.

This figure depicts the spectrum of the light used in this study compared with intensity for both CWF control (T8 fluorescent) and bLAD experimental (T8 blue-enriched LED). While both lights are broad spectrum in nature, they exhibit peak intensity at different wavelengths of light: CWF peaks on the higher end of the visible spectrum (550-650 nm), whereas bLAD peaks at the lower end of the visible spectrum (450 nm).
Body weight, food, and water intake measurements.
Mean ± SEM of body weight, daily food consumption, and daily water consumption between male and female rats in CWF and bLAD groups are shown in Figure 4.
Overall, we found no significant difference in the cumulative mean body weight between male (194 ± 21 g) and female (148 ± 11 g) rats in the CWF group, nor between bLAD males (210 ± 20 g) and bLAD females (155 ± 11 g). Male and female rats housed under bLAD conditions showed no significant difference in the integrated mean body weight as compared with CWF males and CWF females, respectively.
Male rats in both CWF control (19.4 ± 0.9 g/day) and bLAD experimental (20.2 ± 0.7 g/day) groups consumed significantly more food over the 30-d housing period than CWF females (15.8 ± 0.4 g/day) by 23% (P = 0.0005) and bLAD females (15.4 ± 0.3 g/day) by 31% (P < 0.0001). No statistically significant difference was found between the integrated mean of daily food consumption between CWF and bLAD males, nor between CWF and bLAD female rats.
No significant difference was noted in daily water consumption overall between males (38 ± 3 mL/day) and females (30 ± 2 mL/day) housed under CWF conditions; however, bLAD males (37 ± 3 mL/day) consumed 42% more water daily than did bLAD females (26 ± 1 mL/day) (P < 0.0117). No significant differences were noted overall between daily water consumption of CWF males and bLAD males, nor between CWF females and bLAD females.
Serum melatonin.
Concentrations of serum melatonin for rats in CWF and bLAD lighting are shown in Figure 5. Serum melatonin concentrations (peak and cumulative) are represented as the mean ± SD.
Figure 5.

Mean serum melatonin (> 4 pg/mL detectable level) ± SD between male and female rats in CWF and bLAD groups. Serum concentrations denoted with an asterisk (*) denote statistical significance (P < 0.05).
Circadian cycling was evident for male and female rats in both CWF and bLAD groups, which had a severely dampened amplitude during daytime (Table 2). The overall patterns of daily serum melatonin level rhythms were similar for both CWF and bLAD groups: low during the light phase and significantly (P < 0.001) higher during the dark phase, with peak levels (CWF males: 176 ± 6 pg/mL; CWF females: 130 ± 5 pg/mL; bLAD males: 942 ± 38 pg/mL; bLAD females: 679 ± 21 pg/mL) occurring between 2400 and 0400 and decreasing to a nadir between 1200 and 1600 in all groups (CWF males: 4.5 ± 0.9 pg/mL; CWF females: 5.6 ± 1.0 pg/mL; bLAD males: 16.2 ± 0.4 pg/mL; bLAD females: 14.3 ± 1.0 pg/mL). Peak melatonin concentrations were significantly higher (P < 0.001) in both males and females in the bLAD group as compared with CWF males and CWF females. Cumulative serum melatonin levels (integrative mean under each curve) over the 24-h sampling period were also significantly higher (P < 0.001) in CWF males and bLAD males as compared with CWF females and bLAD females, respectively (CWF males: 292 ± 5 pg/mL; CWF females: 233 ± 5 pg/mL; bLAD males: 1266 ± 28 pg/mL; bLAD females: 976 ± 16 pg/mL). Cumulative melatonin levels of bLAD male and bLAD female rats were over 4-fold higher than those of CWF male and CWF female rats (P < 0.001), respectively.
Significant differences were detected in the peak amplitude and phase duration of the nocturnal melatonin signal between the CWF and bLAD groups. Melatonin levels in the bLAD group began to rise rapidly after the onset of the dark phase, reaching nearly 40% the peak of those in CWF groups (control) by 2000. However, the peak dark-phase melatonin level for Sprague–Dawley rats in the bLAD group at 2400 was over 5-fold higher (P < 0.0001) in both males and females than that in CWF male and female rats, respectively, at the same time point. Arterial serum melatonin levels remained more than 11-fold higher (P < 0.05; 17.0 ± 0.8 pg/mL) in bLAD compared with CWF, even at 2 to 3 h after the onset of light phase (1.5 ± 0.4 pg/mL) and did not reach normal daytime levels (less than 10 pg/mL) until 1200.
Serum corticosterone.
Circadian rhythm of serum corticosterone between male and female rats and CWF and bLAD groups is shown in Figure 6. Serum corticosterone concentrations (peak and cumulative) are represented as the mean ± SEM.
Figure 6.

Mean serum corticosterone (> 15 ng/mL detectable level) ± SEM between male and female rats in CWF and bLAD groups. Serum concentrations denoted with an asterisk (*) denote statistical significance (P < 0.05).
Only the male rats in bLAD lighting showed a significant value (1.37E-03) for circadian rhythmicity in serum corticosterone (Table 2). The peak amplitude fold change in this bLAD group was 7 times that of CWF males. Peak corticosterone levels in bLAD males were phase shifted forward 2 h as compared with the CWF males; the female bLAD rats were phase shifted forward 4 h as compared with the female CWF rats.
Male and female rats housed under CWF and bLAD lighting showed differences both in time and concentration of peak serum corticosterone. CWF males reached peak serum corticosterone (531 ± 153 ng/mL) toward the end of the dark phase at 0400, with the nadir (405 ± 58 ng/mL) in the middle of the dark phase at 2400. CWF females exhibited highest serum corticosterone levels (990 ± 158 ng/mL) toward the end of the light phase at 1600, with nadir corticosterone (504 ± 114 ng/mL) in the middle of the dark phase at 2400. bLAD males similarly reached peak serum corticosterone (761 ± 63 ng/mL) at the end of the light phase at 1600, but reached nadir (284 ± 71 ng/mL) at the onset of the light phase at 0800. bLAD females exhibited highest levels of circulating corticosterone (1151 ± 130 ng/mL) at the beginning of the dark phase at 2000, with the lowest levels (731 ± 189 ng/mL) at end of the dark phase at 0400.
Differences in mean of serum corticosterone were sex dependent. CWF females produced more serum corticosterone overall (3707 ± 554 ng/mL) as compared with CWF male rats (2201 ± 325 ng/mL; P = 0.0205); similarly, bLAD females produced more serum corticosterone (4558 ± 463 ng/mL) than did bLAD male rats overall (2780 ± 276 ng/mL; P = 0.0100). No statistically significant difference was detected in the integrated mean of serum corticosterone produced over 24-h in CWF and bLAD male rats or in CWF and bLAD female rats.
Serum insulin.
The circadian rhythm of serum insulin concentration between male and female rats housed under CWF and bLAD groups is shown in Figure 7. Serum insulin concentrations (peak and cumulative) are represented as the mean ± SEM.
Figure 7.

Mean serum insulin (> 0.2 ng/mL detectable level) ± SEM between male and female rats in CWF and bLAD groups.
The peak amplitude fold change in the bLAD males was twice that of the CWF males (Table 2). Peak insulin levels in bLAD male rats were phase shifted forward 12 h as compared with the CWF males; the female bLAD rats were phase shifted forward 8 h as compared with the female CWF rats. All groups varied in time and amplitude of serum insulin peaks during the 24-h sampling period. CWF males reached first peak of insulin (0.35 ± 0.06 ng/dL) in the middle of the dark phase (2400 h), with the nadir (0.21 ± 0.04 ng/dL) at the end of the dark phase (0400 h). CWF males then showed a smaller insulin peak (0.29 ± 0.08 ng/dL) in the middle of the light phase (1200 h) with another nadir (0.24 ± 0.04 ng/dL) in the beginning of the dark phase (2000 h). Females in the CWF group also exhibited highest insulin (0.93 ± 0.36 ng/dL) during the middle of the dark phase (2400 h), with a nadir (0.25 ± 0.02 ng/dL) at the onset of the light phase (0800 h). Serum insulin increased again in CWF females with a smaller peak (0.44 ± 0.12 ng/dL) in the middle of the light phase (1200 h) and another nadir (0.25 ± 0.02 ng/dL) at the end of the light phase (1600 h). Males in the bLAD group reached peak circulating insulin (0.37 ± 0.07 ng/dL) at the beginning of the light phase (0800 h), with the nadir (0.22 ± 0.03 ng/dL) in the middle of the light phase (1200 h). bLAD males then showed a smaller peak in insulin (0.35 ± 0.05 ng/dL) at the end of the light phase (1600 h), with the second nadir (0.22 ± 0.03 ng/dL) in the middle of the dark phase (2400 h). Females in the bLAD group reached peak insulin (0.60 ± 0.127 ng/dL) in the middle of the dark phase (2400 h) and fell to 0.34 ± 0.07 ng/dL at the beginning of the light phase (0800 h). bLAD females also showed a smaller peak (0.46 ± 0.08 ng/dL) in serum insulin at the end of the light phase (1600 h), with a nadir (0.25 ± 0.02 ng/dL) at the beginning of the dark phase (2000 h).
No statistically significant differences were found between either peak or cumulative means of serum insulin measured in all groups (CWF males, CWF females, bLAD males, bLAD females) over the 24-h sampling period. Female rats showed no significant difference between CWF (1.97 ± 0.47 ng/dL) and bLAD (1.99 ± 0.30 ng/dL) conditions. Similarly, no difference was detected between the cumulative mean of insulin produced by CWF males (1.37 ± 0.19 ng/dL) and bLAD males (1.43 ± 0.17 ng/dL).
Serum glucose.
The circadian rhythms of serum glucose concentrations between CWF and bLAD rats are shown in Figure 8. Serum glucose concentrations (peak and cumulative) are represented as the mean ± SEM.
The peak amplitude fold change in bLAD males was 1.6 times greater than that of the CWF males (Table 2). Peak glucose levels in bLAD male rats were phase shifted forward 4 h as compared with the CWF males; the female bLAD rats were not phase shifted compared with the female CWF rats, with no fold differences between the 2 conditions.
Male and female rats under either CWF or bLAD lighting conditions showed sex differences in time of peak and nadir serum glucose concentrations. Male rats (CWF and bLAD) had peak serum glucose at 1600, just prior to the onset of the dark phase. No significant difference was found between peak serum glucose in CWF males (275 ± 17 mg/dL) and bLAD males (278 ± 26 mg/dL). While CWF male rats showed nadir serum glucose (240 ± 123 mg/dL) at the end of the dark phase at 0400, bLAD male rats did not reach nadir glucose (236 ± 17 mg/dL) until the middle of the light phase at 1200. Female rats housed under CWF and bLAD conditions exhibited peak serum glucose at 2400, in the middle of the dark phase. No statistically significant difference was noted between peak glucose concentrations in female CWF (245 ± 42 mg/dL) and bLAD rats (246 ± 15 mg/dL). CWF females reached nadir serum glucose (221 ± 17 mg/dL) at the onset of the light phase at 0800, whereas bLAD females showed nadir glucose (197 ± 10 mg/dL) at the end of the light phase at 1600.
Overall, male rats housed under both CWF and bLAD lighting conditions had significantly higher cumulative serum glucose concentrations than did CWF and bLAD females, respectively (CWF males 1336 ± 67 mg/dL, CWF females 1152 ± 79 mg/dL, P = 0.0004; bLAD males 1285 ± 80 mg/dL, bLAD females 1076 ± 46 mg/dL, P = 0.0033) over the 24-h sampling period. No significant difference was detected between mean serum glucose concentration of CWF and bLAD male rats. Female CWF and bLAD rats also showed no significant difference in serum glucose concentrations.
Discussion
Light is a potent extrinsic factor of laboratory animal husbandry that can disturb circadian rhythms of metabolism and physiology in both research animals and their human caretakers. Perturbation of light and its rhythms can trigger a variety of downstream effects, including increased weight gain, reduced cognitive function, and impaired reproductive ability.27,35,36,41 In context of biomedical research, circadian disruption of the metabolism and physiology of experimental animals raises concerns of animal welfare, while also confounding the validity and reproducibility of research outcomes. These effects are mediated by the characteristics of light to which the animals are exposed, including the wavelength, or color spectrum; the light intensity, more colloquially denoted as its perceived brightness; and light duration, as most animals experience alternating periods of light and darkness in their natural environment.
Lighting of vivaria typically mimics the light intensity and duration that a species experiences in its natural habitat. For the housing of Sprague–Dawley rats, which are a nonpigmented, nocturnal rodent, appropriate guidelines for light intensity and duration have been published in the Guide. In the current study, adolescent rats were exposed to different light types at day (CWF compared with bLAD), with no significant difference in light intensity or light duration. As shown in Figure 3, the major difference between the 2 groups in our study is the spectral quality of light, with CWF light exhibiting a broad peak of irradiance from 300 to 700 nm and bLAD exhibiting a relatively sharp spike in irradiance around 470 nm. One effect of differing spectral quality between CWF and bLAD lighting is captured in Table 1. Despite no significant difference in photon flux, irradiance, or photopic illuminance between the 2 lighting conditions, the bLAD light preferentially stimulates melanopsin-containing ipRGCs as it penetrates the retina of the rat, thereby activating circadian regulation of melatonin via the retinohypothalamic tract (RHT). The data presented support this (Figure 5), as rats exposed to bLAD had significantly greater production of serum melatonin over the 24-h collection period.
Previous work from our laboratory found similar effects on circadian regulation and overall melatonin production in rodents exposed to bLAD.16,21,45 A unique feature of our current study is the use of a novel light-containment IVC rack to house rats in the bLAD group under experimental lighting conditions for comparison with rats housed under standard cool-white fluorescent (CWF) lighting. In addition, our study compared these effects not only between CWF and bLAD groups, but also between male and female rats. To our knowledge, our study is the first to report higher melatonin concentrations overall in male rats compared with females under both CWF and bLAD conditions. This finding contradicts a previous study25 that found significantly higher plasma melatonin in female humans as compared with males. However, humans experience even more daily variables that can perturb melatonin circadian rhythms, including the type of employment, oral contraception use, and comorbid health conditions.36
The current study is also the first to show that the increase in melatonin production overnight extends well into the light phase for the Sprague–Dawley rats housed under bLAD lighting. Greater overall production of melatonin provides multiple benefits to the individual, including enhanced regulation of glucose and lactate metabolism and of corticosterone, insulin, and leptin in humans,43,44 rats,30,33,34 and melatonin-producing mice.16 Results from one of our previous studies showed decreased xenografted prostatic tumor growth in male nude rats exposed to daytime blue-enriched LED.19 A study involving university students showed that exposure to bLAD lighting for one hour upon waking enhanced the melatonin circadian rhythm and heightened wakefulness.14
Serum corticosterone, as regulated via the body’s hypothalamic-pituitary-adrenal (HPA) axis, is a well-known indicator of stress in rodents.3 Rodents exhibit a diurnal circadian rhythm in circulating corticosterone, with highest corticosterone occurring at the onset of the dark (active) phase and nadir corticosterone at the onset of the light (resting) phase.11 This pattern was pronounced in the bLAD male and female rats, as shown in Figure 6. In contrast, CWF males and females showed peak corticosterone at the onset of the light phase, possibly indicating stress in these rats after early morning exposure to CWF lighting. While the timing of peak and nadir corticosterone differed among lighting conditions, a statistically significant difference was not detected in overall serum corticosterone between CWF and bLAD groups. Female rats in both CWF and bLAD groups produced more corticosterone overall than did group-matched males. However, potential confounding effects of handling stress and induction of anesthesia with ketamine-xylazine on measured serum corticosterone should be considered, and such effects ideally should be minimized in future studies.
While our previous work found significant differences in body weight and food and water consumption between Buffalo rats exposed to blue-enriched lighting as opposed to standard fluorescent lighting,21 the current study found no significant differences in these parameters between rats in CWF and bLAD groups. The current study may not have adequately captured true alterations in these parameters because as compared with the previous study, we used rats that were slightly older in age (estimated 4 to 5 wk) and thus slightly larger in size at study onset. In addition, in the current study, measurements of food and water consumption were totaled for each cage and an average value calculated per rat (3 rats/cage), which neglects the social hierarchy of resource consumption that is probable among cohoused rats, especially breeding-age males.
Insulin is a neuroendocrine hormone that is regulated peripherally by the hypothalamus and the pancreas to maintain normal glucose homeostasis throughout all tissues of the body. The SCN, acting still as the main biologic clock of the system, senses endogenous glucose concentrations and ultimately sends this neuronal message to pancreatic islet β-cells. When circulating glucose is high, such as after food intake, the SCN triggers a response to stimulate secretion of insulin-secreting granules of β-cells.20 In rats fed ad libitum, as in this study, serum insulin is expected to rise shortly after the start of the dark phase as the rats become active and begin to eat. This pattern was observed in all groups (CWF females, CWF males, bLAD females) except male rats in the bLAD group, which exhibited smaller peaks in serum insulin at the end of the light phase and again at the end of the dark phase (Figure 7).
Circadian regulation of insulin secretion is directly associated with circulating levels of serum glucose. Serum glucose in rats is typically highest during the dark phase when the animal is active and eating, and lowest during the light phase when resting is predominant.32 The liver has a critical role in glucose homeostasis, as it stores excess glucose in the form of glycogen, acting as an energy reserve for times of low circulating glucose. When serum glucose is low, the liver breaks down stored glycogen and generates glucose through the process of gluconeogenesis. Just as light entrains circadian rhythms of the sleep-wake cycle and food and water intake via the master biologic clock of the SCN, peripheral circadian ‘clocks’ located in cells of the liver and pancreas become entrained to a daily rhythm of glucose breakdown and glucose regeneration throughout the 24-h day. Perturbations to such circadian rhythms can alter the programming of these biologic ‘clocks’ in the body, thus altering the daily rhythm of glucose metabolism and glucose production. Previous work from our laboratory has demonstrated this, as female nude rats housed in blue-tinted cages exhibited lower overall serum glucose as compared with rats housed in either transparent or amber cages.17 In a follow up study using LED, male Buffalo rats exposed to bLAD also exhibited lower serum glucose overall as compared with rats exposed to CWF lighting.21 In the present study, we found no such difference in serum glucose between bLAD and CWF rats. Blood chemistry analysis revealed that rats in all groups were hyperglycemic, possibly indicating a stress response to handling for administration of the anesthetic. In addition, ketamine/xylazine anesthesia can induce a transient hyperglycemia in rodents.4 Future studies should evaluate alternative anesthetic protocols for terminal blood collection and subsequent measurement of serum glucose.
The novel light containment IVC rack used to house the bLAD rats in this study may provide certain advantages for both laboratory animal researchers and animal caretakers. Laboratory animals approved for use in light-controlled studies require additional husbandry considerations and facility management guidelines designed to prevent disruption of the animals’ natural light-entrained rhythms. As our laboratory has previously demonstrated, extremely low intensity light (0.2 lx) contamination during the dark phase can disrupt circadian regulation of neuroendocrine hormones; thus, the installation of black-out curtains inside the housing room may be necessary, in addition to implementation of strict facility guidelines to restrict access to animal rooms during the dark phase.18,22 The light containment rack eliminates these concerns, as the animals are contained inside the unit with the blue-enriched LED providing illumination from within during the programmed light-phase. Light contamination does not occur between the animal housing room and the animals housed inside the unit because the cages are secured inside the unit with insulated blackout doors. The programmable nature of the light containment rack allows exposure of animals to light of specified duration and intensity without the need for costly alterations to the animal housing facility; however, repeated measurements of light intensity within the illuminated unit at the rodent eye-level are recommended to prevent development of phototoxic retinopathy, especially in nonpigmented rodents. Future assessment of the effects of using horizontal LED beam lighting on laboratory animals should be considered because the current edition of the Guide only describes standard overhead lights when discussing animal room illumination.
From an animal care standpoint, visualization of animals inside the light-containment IVC unit for daily health evaluations was more efficient, as routine observation showed that the rats generally rested in the front of the cage (closest to the observer), away from the light source. In contrast, rats housed under CWF lighting generally rested in the back of the cage (farthest away from the observer), making detailed health observations more difficult. However, we perceived no differences in animal behavior between rats in the 2 lighting groups, with the exception that one cage of female rats in the CWF cohort exhibited food grinding throughout the 30-d housing period. While not uncommon in laboratory rodents, stereotypies like food grinding can indicate an animal’s inability to cope with various stressors.12 This particular cage was located on the far-right end of the CWF rack, exposing the animals inside to slightly higher light intensity than rats housed in cages toward the center or lower shelves. This slightly increased light intensity could have induced a stress response and resulting stereotypy in these rats, but determining the cause would require further research. Future studies comparing effects of standard CWF housing and the bLAD light-containment rack should provide detailed movement and behavioral analysis to evaluate indications of stress.
Current research regarding laboratory animal husbandry and mitigation of extrinsic factors on biomedical research outcomes offer the opportunity to continuously refine housing guidelines as more information becomes available. Use of a light-containment IVC unit for research animal housing may mitigate effects of light contamination on acquired data. To assess its effects, more long-term studies housing rodents in the bLAD light-containment rack should be considered in the future. Whether this novel light-containment rack provides isolation from effects of other extrinsic factors of animal husbandry, such as noise and vibrations, is uncertain and such evaluations can and should be made in future studies of a light-containment IVC system. Studies currently underway regarding this topic include evaluation of human melatonin production secondary to daytime exposure of bLAD lighting.
Light is a critically important extrinsic factor in laboratory animal husbandry due to its entrainment of normal circadian rhythms in research animals. Its effects depend on the intensity, duration, and spectral quality of the light to which the animal is exposed. The data provided in this and previous studies16-21,45 strongly argues that an intact and robust circadian nighttime melatonin rhythm, which is amplified by blue-enriched LED lighting during the light phase, may provide physiologic benefits to laboratory rodents and thus improve scientific research outcomes while also providing cost- and energy-efficient illumination to the animal housing facility.
Acknowledgments
The authors would like to thank Tulane University and the American Association for Laboratory Animal Science (AALAS) Grants for Laboratory Animal Science (GLAS) Program for funding this experiment, as well as Lab Products for providing the novel SunCalc IVC system used in our study. The authors would also like to thank Dr. Aaron Hoffman for aiding in our statistical analysis, and the University of Virginia Center for Research in Reproduction Ligand Assay and Analysis Core for analysis of serum corticosterone and insulin (supported by the Eunice Kennedy Shriver NICHD/NIH Grant R24HD102061). The authors would especially like to thank the animal care staff of Tulane University Department of Comparative Medicine for their assistance with the completion of this project. Lastly, the authors would like to express gratitude to laboratory animals for their innumerable contributions to the advancement of biomedical research and human and animal health.
References
- 1.Altimus CM, Güler AD, Alam NM, Arman AC, Prusky GT, Sampath AP, Hattar S. 2010. Rod photoreceptors drive circadian photoentrainment across a wide range of light intensities. Nat Neurosci 13:1107–1112. 10.1038/nn.2617. [DOI] [PMC free article] [PubMed] [Google Scholar]
- 2.Aschoff J. editor. 1981. Handbook of behavioral neurobiology, biological rhythms. New York (NY): Plenum Press. [Google Scholar]
- 3.Atkinson HC, Waddell BJ. 1997. Circadian Variation in Basal Plasma Corticosterone and Adrenocorticotropin in the Rat: Sexual Dimorphism and Changes across the Estrous Cycle. Endocrinology 138:3842–3848. 10.1210/endo.138.9.5395. [DOI] [PubMed] [Google Scholar]
- 4.Baker DG, Lipman NS. 2015. Factors That Can Influence Animal Research, p 1441–1495. In: Fox JG, Anderson LC, Otto GM, Pritchett-Corning KR, Whary MT, editors. Laboratory animal medicine, 3rd edition. London, UK: Elsevier. 10.1016/B978-0-12-409527-4.00033-X [DOI] [Google Scholar]
- 5.Bellhorn RW. 1980. Lighting in the animal environment. Lab Anim Sci 30:440–450. [PubMed] [Google Scholar]
- 6.Berson DM, Dunn FA, Takao M. 2002. Phototransduction by retinal ganglion cells that set the circadian clock. Science 295:1070–1073. 10.1126/science.1067262. [DOI] [PubMed] [Google Scholar]
- 7.Blask DE, Brainard GC, Dauchy RT, Hanifin JP, Davidson LK, Krause JA, Sauer LA, Rivera-Bermudez MA, Dubocovich ML, Jasser SA, Lynch DT, Rollag MD, Zalatan F. 2005. Melatonin-Depleted Blood from Premenopausal Women Exposed to Light at Night Stimulates Growth of Human Breast Cancer Xenografts in Nude Rats. Cancer Res 65:11174–11184. 10.1158/0008-5472.CAN-05-1945. [DOI] [PubMed] [Google Scholar]
- 8.Blask DE, Dauchy RT, Brainard GC, Hanifin JP. 2009. Circadian stage-dependent inhibition of human breast cancer metabolism and growth by the94 nocturnal melatonin signal: consequences of its disruption by light at night in rats and women. Integr Cancer Ther 8:347–353. 10.1177/1534735409352320. [DOI] [PubMed] [Google Scholar]
- 9.Blask DE, Dauchy RT, Dauchy EM, Mao L, Hill SM, Greene MW, Belancio VP, Sauer LA, Davidson L. 2014. Light Exposure at Night Disrupts Host/Cancer Circadian Regulatory Dynamics: Impact on the Warburg Effect, Lipid Signaling and Tumor Growth Prevention. PLoS One 9:e102776. 10.1371/journal.pone.0102776. [DOI] [PMC free article] [PubMed] [Google Scholar]
- 10.Brainard GC. 1989. Illumination of laboratory animal quarters: participation of light irradiance and wavelength in the regulation of the neuroendocrine system, p 69–74. In: Guttman HN, Mench JA, Simmonds RC, editors. Science and animals: addressing contemporary issues. Bethesda (MD): Scientists Center for Animal Welfare. [Google Scholar]
- 11.Brainard GC, Hanifin JP. 2005. Photons, Clocks, and Consciousness. J Biol Rhythms 20:314–325. 10.1177/0748730405278951. [DOI] [PubMed] [Google Scholar]
- 12.Cameron KM, Speakman JR. 2010. The extent and function of ‘food grinding’ in the laboratory mouse (Mus musculus). Lab Anim 44:298–304. 10.1258/la.2010.010002. [DOI] [PubMed] [Google Scholar]
- 13.Clough G. 1982. Environmental effects on animals used in biomedical research. Biol Rev Camb Philos Soc 57:487–523. 10.1111/j.1469-185X.1982.tb00705.x. [DOI] [PubMed] [Google Scholar]
- 14.Choi K, Shin C, Kim T, Chung HJ, Suk HJ. 2019. Awakening effects of blue enriched morning light exposure on university students’ physiological and subjective responses. Sci Rep 9:345. 10.1038/s41598-018-36791-5. [DOI] [PMC free article] [PubMed] [Google Scholar]
- 15.Dacey DM, Liao HW, Peterson BB, Robinson FR, Smith VC, Pokorny J, Yau KY, Gamlin PD. 2005. Melanopsin-expressing ganglion cells in primate retina signal color and irradiance and project to the LGN. Nature 433:749–754. 10.1038/nature03387. [DOI] [PubMed] [Google Scholar]
- 16.Dauchy RT, Blask DE, Hoffman AE, Xiang S, Hanifin JP, Warfield B, Brainard GC, Anbalagan M, Dupepe LM, Dobek GL, Belancio VP, Hill SM. 2019. Influence of Daytime LED Light Exposure on Circadian Regulatory Dynamics of Metabolism and Physiology in Mice. Comp Med 69:350–373. 10.30802/AALAS-CM-19-000001. [DOI] [PMC free article] [PubMed] [Google Scholar]
- 17.Dauchy RT, Dauchy EM, Hanifin JP, Gauthreaux SL, Mao L, Belancio VP, Ooms TG, Dupepe LM, Jablonski MR, Warfield B, Wren MA, Brainard GC, Hill SM, Blask DE. 2013. Effects of Spectral Transmittance through Standard Laboratory Cages on Circadian Metabolism and Physiology in Nude Rats. J Am Assoc Lab Anim Sci 52:146–156. [PMC free article] [PubMed] [Google Scholar]
- 18.Dauchy RT, Dupepe LM, Ooms TG, Dauchy EM, Hill CR, Mao L, Belancio VP, Slakey LM, Hill SM, Blask DE. 2011. Eliminating Animal Facility Light-at-Night Contamination and Its Effect on Circadian Regulation of Rodent Physiology, Tumor Growth, and Metabolism: A Challenge in the Relocation of a Cancer Research Laboratory. J Am Assoc Lab Anim Sci 50:326–336. [PMC free article] [PubMed] [Google Scholar]
- 19.Dauchy RT, Hoffman AE, Wren-Dail MA, Hanifin JP, Warfield B, Brainard GC, Xiang S, Yuan L, Hill SM, Belancio VP, Dauchy EM, Smith K, Blask DE. 2015. Daytime Blue Light Enhances the Nighttime Circadian Melatonin Inhibition of Human Prostate Cancer Growth. Comp Med 65:473–485. [PMC free article] [PubMed] [Google Scholar]
- 20.Dauchy RT, Wren MA, Dauchy EM, Hanifin JP, Jablonski MR, Warfield B, Brainard GC, Hill SM, Mao L, Dupepe LM, Ooms TG, Blask DE. 2013. Effect of Spectral Transmittance through Red-Tinted Rodent Cages on Circadian Metabolism and Physiology in Nude Rats. J Am Assoc Lab Anim Sci 52:745–755. [PMC free article] [PubMed] [Google Scholar]
- 21.Dauchy RT, Wren-Dail MA, Hoffman AE, Hanifin JP, Warfield B, Brainard GC, Hill SM, Belancio VP, Dauchy EM, Blask DE. 2016. Effects of Daytime Exposure to Light from Blue-Enriched Light-Emitting Diodes on the Nighttime Melatonin Amplitude and Circadian Regulation of Rodent Metabolism and Physiology. Comp Med 66:373–383. [PMC free article] [PubMed] [Google Scholar]
- 22.Dauchy RT, Xiang S, Mao L, Brimer S, Wren MA, Yuan L, Anbalagan M, Hauch A, Frasch T, Rowan BG, Blask DE, Hill SM. 2014. Circadian and Melatonin Disruption by Exposure to Light at Night Drives Intrinsic Resistance to Tamoxifen Therapy in Breast Cancer. Cancer Res 74:4099–4110. 10.1158/0008-5472.CAN-13-3156. [DOI] [PMC free article] [PubMed] [Google Scholar]
- 23.Foster RG, Provencio I, Hudson D, Fiske S, De Grip W, Menaker M. 1991. Circadian photoreception in the retinally degenerate mouse (rd/rd). J Comp Physiol A 169:39–50. 10.1007/BF00198171. [DOI] [PubMed] [Google Scholar]
- 24.Gabel V, Maire M, Reichert CF, Chellappa SL, Schmidt C, Hommes V, Viola AU, Cajochen C. 2013. Effects of Artificial Dawn and Morning Blue Light on Daytime Cognitive Performance, Well-being, Cortisol and Melatonin Levels. Chronobiol Int 30:988–997. 10.3109/07420528.2013.793196. [DOI] [PubMed] [Google Scholar]
- 25.Gunn PJ, Middleton B, Davies SK, Revell VL, Skene DJ. 2016. Sex differences in the circadian profiles of melatonin and cortisol in plasma and urine matrices under constant routine conditions. Chronobiol Int 33:39–50. 10.3109/07420528.2015.1112396. [DOI] [PMC free article] [PubMed] [Google Scholar]
- 26.Hanifin JP, Brainard GC. 2007. Photoreception for Circadian, Neuroendocrine, and Neurobehavioral Regulation. J Physiol Anthropol 26:87–94. 10.2114/jpa2.26.87. [DOI] [PubMed] [Google Scholar]
- 27.Hanifin JP, Dauchy RT, Blask DE, Hill SM, Brainard GC. 2019. Relevance of Electrical Light on Circadian, Neuroendocrine, and Neurobehavioral Regulation in Laboratory Animal Facilities. ILAR J 60:150–158. 10.1093/ilar/ilaa010. [DOI] [PMC free article] [PubMed] [Google Scholar]
- 28.Hattar S, Lucas RJ, Mrosovsky N, Thompson S, Douglas RH, Hankins MW, Lem J, Biel M, Hofman F, Foster RG, Yau KW. 2003. Melanopsin and rod-cone photoreceptive systems account for all major accessory visual functions in mice photosensitivity. Nature 424:76–81. 10.1038/nature01761. [DOI] [PMC free article] [PubMed] [Google Scholar]
- 29.Hughes ME, Hogenesch JB, Kornacker K. 2010. JTK_CYCLE: an efficient non-parametric algorithm for detecting rhythmic components in genome-scale datasets. J Biol Rhythms 25:372–380. 10.1177/0748730410379711. [DOI] [PMC free article] [PubMed] [Google Scholar]
- 30.Illnerová H, Vanĕcek J, Hoffman K. 1983. Regulation of the pineal melatonin concentration in the rat (Rattus norvegicus) and the Djungarian hamster (Phodopus sungorus). Comp Biochem Physiol A Comp Physiol 74:155–159. 10.1016/0300-9629(83)90727-2. [DOI] [PubMed] [Google Scholar]
- 31.Institute for Laboratory Animal Research. 2011. Guide for the care and use of laboratory animals, 8th ed. Washington (DC): National Academy Press. [Google Scholar]
- 32.Kalsbeek A, la Fleur S, Fliers E. 2014. Circadian control of glucose metabolism. Mol Metab 3:372–383. 10.1016/j.molmet.2014.03.002. [DOI] [PMC free article] [PubMed] [Google Scholar]
- 33.Lettieri-Barbato D, Cannata SM, Casagrande V, Ciriolo MR, Aquilano K. 2018. Time-controlled fasting prevents aging-like mitochondrial changes induced by persistent dietary fat overload in skeletal muscle. PLoS One 13:e0195912. 10.1371/journal.pone.0195912. [DOI] [PMC free article] [PubMed] [Google Scholar]
- 34.Lima FB, Machado UF, Bartol I, Seraphim PM, Sumida DH, Moraes SMF, Hell NS, Okamotot NM, Saad MJ, Carvalho CR, Cipolla-Neto J. 1998. Pinealectomy causes glucose intolerance and decreases adipose cell responsiveness to insulin in rats. Am J Physiol 275:E934–E941. 10.1152/ajpendo.1998.275.6.E934. [DOI] [PubMed] [Google Scholar]
- 35.Lucas RJ, Pierson SN, Berson DM, Brown TM, Cooper HM, Czeisler CA, Figueiro MG, Gamlin PD, Lockley SW, O’Hagan JB, Price LLA, Provencio I, Skene DJ, Brainard GC. 2014. Measuring and using light in the melanopsin age. Trends Neurosci 37:1–9. 10.1016/j.tins.2013.10.004. [DOI] [PMC free article] [PubMed] [Google Scholar]
- 36.Lunn RM, Blask DE, Coogan AN, Figueiro MG, Gorman MR, Hall JE, Hansen J, Nelson RJ, Panda S, Smolensky MH, Stevens RG, Turek FW, Vermeulen R, Carreón T, Caruso CC, Lawson CC, Thayer KA, Twery MJ, Ewens AD, Garner SC, Schwingl PJ, Boyd WA. 2017. Health consequences of electric lighting practices in the modern world: A report on the National Toxicology Program’s workshop on shift work at night, artificial light at night, and circadian disruption. Sci Total Environ 607-608:1073–1084. 10.1016/j.scitotenv.2017.07.056. [DOI] [PMC free article] [PubMed] [Google Scholar]
- 37.Moore RY, Lenn NJ. 1972. A retinohypothalamic projection in the rat. J Comp Neurol 146:1–14. 10.1002/cne.901460102. [DOI] [PubMed] [Google Scholar]
- 38.Nuffield Department of Clinical Neurosciences Medical Sciences Division. [Internet]. 2015. Rodent Toolbox v1.xlsx. [Cited 01 March 2019]. Available at: http://www.ndcn.ox.ac.uk/team/stuartpeirson.
- 39.Panda S, Provencio I, Tu DC, Pires SS, Rollag MD, Castrucci AM, Sato TK, Wiltshire T, Andahazy M, Kay SA, Van Gelder RN, Hogenesch JB. 2003. Melanopsin is required for non-image-forming photic responses in blind mice. Science 301:525–527. 10.1126/science.1086179. [DOI] [PubMed] [Google Scholar]
- 40.Pattison PM, Tsao JY, Brainard GC, Bugbee B. 2018. LEDs for photons, physiology and food. Nature 563:493–500. 10.1038/s41586-018-0706-x. [DOI] [PubMed] [Google Scholar]
- 41.Peirson SN, Brown LA, Pothecary CA, Benson LA, Fisk AS. 2017. Light and the laboratory mouse. J Neurosci Methods 300:26–36. [DOI] [PMC free article] [PubMed] [Google Scholar]
- 42.Perreau-Lenz S, Kalsbeek A, Garidou M-L, Wortel J, Van Der Vliet J, Van Heijningen C, Simonneaux V, Pévet P, Buijs RM. 2003. Suprachiasmatic control of melatonin synthesis in rats: inhibitory and stimulatory mechanisms. Eur J Neurosci 17:221–228. 10.1046/j.1460-9568.2003.02442.x. [DOI] [PubMed] [Google Scholar]
- 43.Reiter RJ, Tan DX, Korkmaz A, Ma S. 2012. Obesity and metabolic syndrome: association with chronodisruption, sleep deprivation, and melatonin suppression. Ann Med 44:564–577. 10.3109/07853890.2011.586365. [DOI] [PubMed] [Google Scholar]
- 44.Tähkämö L, Partonen T, Pesonen AK. 2019. Systematic review of light exposure impact on human circadian rhythm. Chronobiol Int 36:151–170. 10.1080/07420528.2018.1527773. [DOI] [PubMed] [Google Scholar]
- 45.Voros GB, Dauchy RT, Myers L, Hill SM, Blask DE, Dobek GL. 2021. Effects of Daytime Blue-Enriched LED Light on Physiologic Parameters of Three Common Mouse Strains Maintained on an IVC System. J Am Assoc Lab Anim Sci 60:259–271. 10.30802/AALAS-JAALAS-20-000109. [DOI] [PMC free article] [PubMed] [Google Scholar]
- 46.Weng S, Estevez ME, Berson DM. 2013. Mouse ganglion-cell photoreceptors are driven by the most sensitive rod pathway and by both types of cones. PLoS One 8:e66480. 10.1371/journal.pone.0066480. [DOI] [PMC free article] [PubMed] [Google Scholar]
- 47.Wierman ME, Auchus RJ, Haisenleder DJ, Hall JE, Handelsman D, Hankinson S, Rosner W, Singh RJ, Sluss PM, Stanczyk FZ. 2014. The New Instructions to Authors for the Reporting of Steroid Hormone Measurements. J Clin Endocrinol Metab 99:4375. 10.1210/jc.2014-3424. [DOI] [PubMed] [Google Scholar]