Abstract
Context:
Hair loss is a common complaint among Indian women. For female pattern hair loss (FPHL), diagnosis is primarily clinical. In the early stages, it can be confused with other conditions. Histopathology is the diagnostic method of choice but requires multiple biopsies and can be disfiguring. Trichoscopy is an alternative noninvasive, rapid tool.
Aim:
The aim of this study is to study the hair density and hair diameter variance in relation with severity grading of FPHL.
Settings and Design:
Cross-sectional study.
Materials and Methods:
Ninety women aged 18 years and above were included in this cross-sectional study conducted at the dermatology department of Bangalore Medical College and Research Institute. Trichoscopic examination was done with a videodermoscope (Firefly DE300) at 20 and 70-fold magnification. Only those patients who met the trichoscopic diagnostic criteria for FPHL were included.
Statistical Analysis Used:
Descriptive statistics, ANOVA, and Spearman's correlation test for fitness of good, using Microsoft Excel data analysis tools.
Results:
Increase in disease severity from grade one to grade three positively correlated with a decrease in hair density over the frontal scalp (P < 0.001) and the occipital scalp (P < 0.001), decrease in average hair shaft diameter over both frontal and occipital scalp (P < 0.001).
Conclusion:
Trichoscopic tools, particularly hair density and hair diameter variance over both frontal and occipital scalp can be useful to help determine FPHL disease severity and its progression.
Keywords: Alopecia, female pattern hair loss, hair density, hair diameter, trichoscopy
INTRODUCTION
Female pattern hair loss (FPHL) has been defined as a nonscarring progressive miniaturization of hair follicles, occurring in a characteristic pattern in genetically predisposed women.[1] It is characterized by a decrease in hair density over the crown and frontal scalp, while the frontal hair line is retained.[2]
Trichoscopy allows visualization of the perifollicular epidermis and hair shafts at high magnification.[3] It reveals contrasting hair density between mid-frontal and occipital scalp.[4]
No clear data are available regarding the exact prevalence of FPHL from India.[2] Data pertaining to the hair density and diameter variance in FPHL among Indian women are scarce.
Hence, this study was undertaken to study the hair density and hair diameter variance in relation with severity grading of FPHL.
MATERIALS AND METHODS
Based on the prevalence rate from previous studies, a sample size of 90 was calculated for this cross-sectional study conducted at the dermatology department of Bangalore Medical College and Research Institute from January, 2017 to March, 2018.
Ninety adult females presenting with a chief complaint of hair loss were included in the study. Adults were selected according to inclusion and exclusion criteria. Written and informed consent was taken before their participation in the study.
The study was approved by the Institutional Ethical Committee.
Inclusion criteria
Female adults meeting the trichoscopic criteria for the diagnosis of FPHL
Age 18 years and above
Adult female willing to give consent for trichoscopic examination.
Exclusion criteria
Pregnant and lactating women
Female adults who do not meet the trichoscopic criteria for FPHL
Age below 18 years
Clinically suspicious patients with possible hair diagnoses mimicking FPHL such as chronic telogen effluvium
Patients who have received any food and drug administration approved treatment for FPHL in the past 3 months
Subjects unwilling to give consent for trichoscopic examination.
Patients were clinically examined and graded according to the Ludwig Scale as Grade One, Two, and Three.[5]
Trichoscopy was performed using a videodermoscope (Firefly DE300). Images of the scalp were taken at 20-fold magnification which allows high-quality enlargement of one cm2 of scalp area and at 70-fold magnification, which magnifies an area of nine mm2. In each patient, one image was taken at 20-fold magnification and four images at 70-fold magnification over the frontal and occipital areas. The average of four fields of view at 70-fold magnification was taken.
Images were analyzed and measurements were done manually using the imageJ software.
The following trichoscopic criteria proposed by Rakowska et al. were applied to diagnose patients with FPHL.[3] Females who did not meet these criteria were excluded from the study.
Major criteria
More than four yellow dots in four images at a 70-fold magnification in the frontal area
Lower average hair thickness in the frontal area in comparison with the occiput (calculated from not <50 hairs from each area)
More the 10% of thin hairs (below 0.03 mm) in the frontal area.
Minor criteria
Ratio of single-hair unit percentage, frontal area to occiput >2:1
Ratio of number of vellus hairs, frontal area to occiput >1.5:1
Ratio of hair follicles with perifollicular discoloration, frontal area to occiput >3:1.
Fulfillment of two major criteria or one major and two minor criteria are required to diagnose FPHL.[3]
Hair thickness was measured as close to the scalp as possible. Hairs were classified as thin hairs (below 0.03 mm), medium-size hairs (0.03–0.05 mm), and thick hairs (above 0.05 mm).
The data were analyzed by various statistical tools, such as descriptive statistics, ANOVA, and Spearman's correlation test for fitness of good, using Microsoft Excel data analysis tools.
RESULTS
Demography
Ninety patients, thirty each with grade-one, grade-two and grade-three FPHL were included in this study Figure 1.
Figure 1.
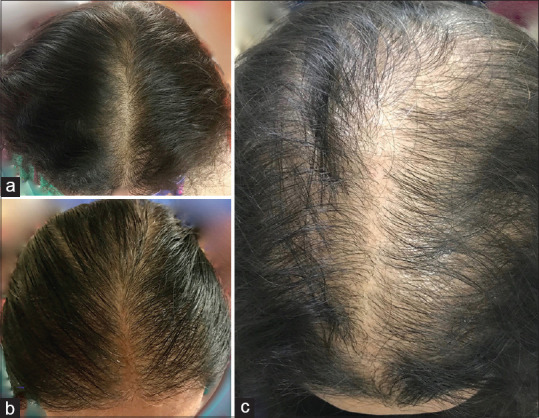
Clinical photographs of Female Pattern Hair Loss (a) Grade-one (b) Grade-two (c) Grade-three
The mean age of participants with grade-one, grade-two, and grade-three FPHL was found to be 36.70 ± 12.02, 38.27 ± 14.17, and 38.10 ± 13.93 years, respectively.
The mean duration of disease was 4.33 years, 6.77 years, and 11.40 years, respectively.
Hair density
Frontal area
In grade 1, the mean hair density was 114.13 ± 17.39 hairs/cm2, the minimum being 99 and maximum 196 hairs/cm2. In grade two, the mean hair density was 97.13 ± 6.66 hairs/cm2, the minimum being 86 and maximum 114 hairs/cm2. In grade three, the mean hair density was 73.83 ± 5.89 hairs/cm2, the minimum being 62 and maximum 85 hair/cm2 [Figure 2a and 3, Annexure Table 1].
Figure 2.
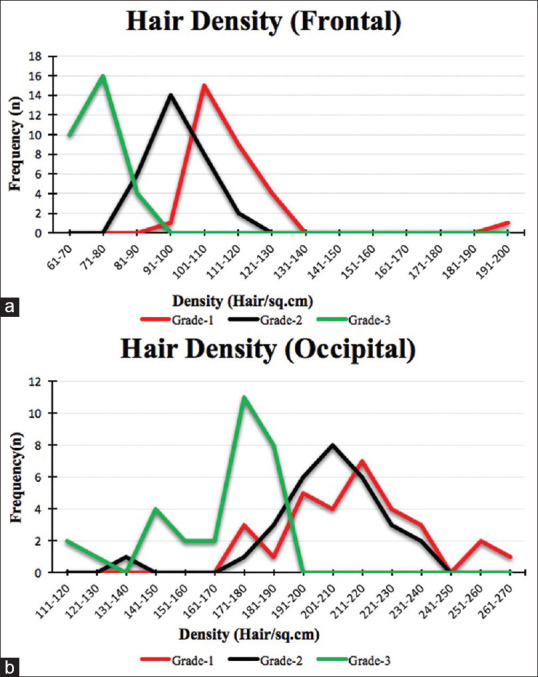
Frequency distribution (line diagram) of hair density over (a) Frontal and (b) Occipital scalp
Figure 3.
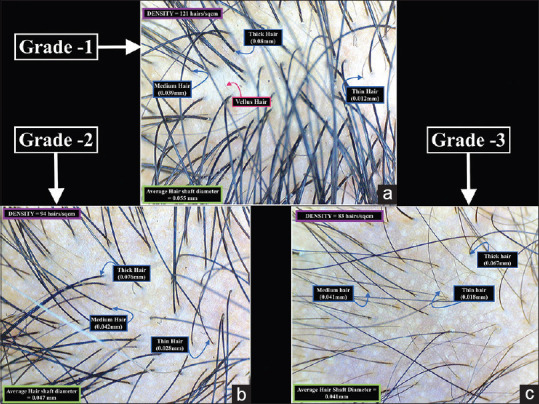
Trichoscopy image of the frontal scalp in (a) Grade-one (b) Grade-two and (c) Grade-three Female Pattern Hair loss (20X magnification)
Occipital area
In grade one, the mean hair density was 215.20 ± 22.27 hairs/cm2, the minimum being 176 and maximum 266 hairs/cm2. In grade two, the mean hair density was 205.87 ± 18.84 hairs/cm2, the minimum being 140 and maximum 238 hairs/cm2. In grade three, the mean hair density was 167.77 ± 20.69 hairs/cm2, the minimum being 119 and maximum 190 hairs/cm2. An 89% higher hair density was observed over the occipital area when compared to the frontal area [Figures 2b and 4, Annexure Table 1].
Figure 4.
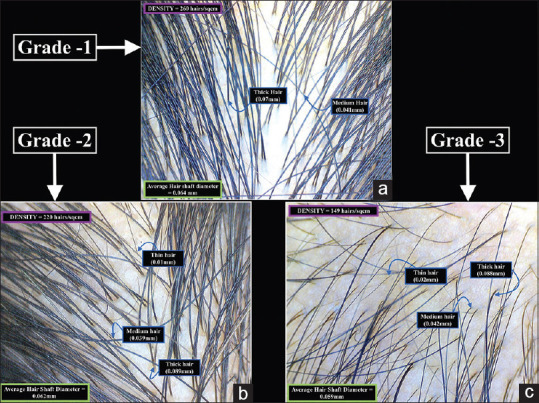
Trichoscopy image of the occipital scalp in (a) Grade-one (b) Grade-two and (c) Grade-three Female Pattern Hair loss (20X magnification)
Comparison and variance
In the frontal area, there was a 14.89% decrease in hair density between grade one and two and 23.99% between grades two and three. In the occipital area, the decrease was 4.34% and 18.51%, respectively [Figure 5].
Figure 5.
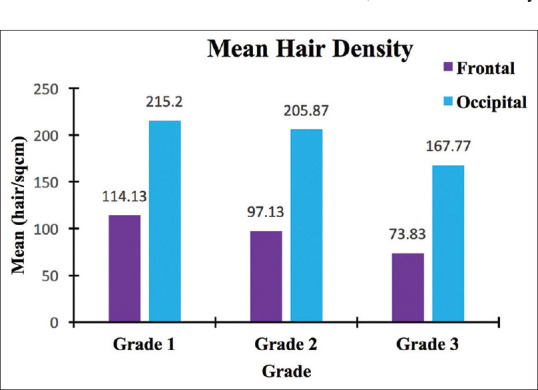
Comparison of mean hair density over frontal and occipital scalp (bar diagram)
Spearman's correlation rho values are highly significant among all different grades (rho = 0.99, P < 0.001). ANOVA indicates the mean hair density of different grades are highly significantly different (P < 0.001) from one another, except between grade one and grade two in occiput area (P = 0.0850) [Table 1].
Table 1.
Spearman’s correlation and ANOVA of hair density
| Spearman’ Area | Grade 1 versus Grade 2 | Grade 2 versus Grade 3 | Grade 1 versus Grade 3 | |||
|---|---|---|---|---|---|---|
|
|
|
|
||||
| Rho | P | Rho | P | Rho | P | |
| Frontal | 0.9961 | <0.001 | 0.9963 | <0.001 | 0.9962 | <0.001 |
| Occiput | 0.9949 | <0.001 | 0.9960 | <0.001 | 0.9968 | <0.001 |
|
| ||||||
| ANOVA Area | Grade 1 versus Grade 2 | Grade 2 versus Grade 3 | Grade 1 versus Grade 3 | |||
|
|
|
|
||||
| P | Significance | P | Significance | P | Significance | |
|
| ||||||
| Frontal | <0.001 | HS | <0.001 | HS | <0.001 | HS |
| Occiput | 0.0850 | NS | <0.001 | HS | <0.001 | HS |
NS – Nonsignificant, HS – Highly significant
Hair diameter
Frontal area
In grade one, the mean hair diameter was 52.77 ± 2.25 μm, the minimum being 49 μm and the maximum was 58 μm. There was a 9.63% variance in diameter. In grade two, the mean hair diameter was 46.37 ± 1.90 μm, the minimum being 42 μm and the maximum was 51 μm. There was a 7.81% variance in diameter. In grade three, the mean hair diameter was 42.30 ± 1.90 μm, the minimum being 38 μm and the maximum was 46 μm. There was an 8.5% variance in diameter [Figures 3 and 6a].
Figure 6.
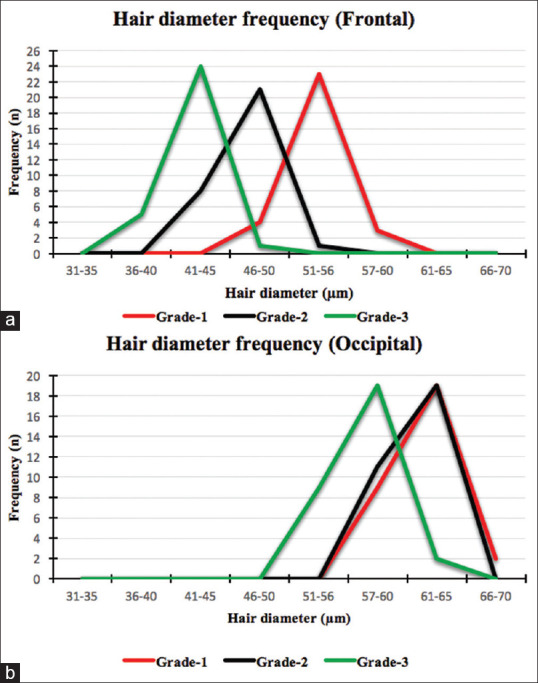
Hair diameter frequency distribution (line diagram) over (a) frontal and (b) occipital scalp
Occiput
In grade one, the mean hair diameter was 61.80 ± 2.59 μm, the minimum being 56 μm and the maximum was 66 μm. There was a 10.87% variance in diameter. In grade two, the mean hair diameter was 61.73 ± 2.03 μm, the minimum being 58 μm and the maximum was 65 μm. There was a 6.7% variance in diameter. In grade three, the mean hair diameter was 56.60 ± 2.79 μm, the minimum being 51 μm and the maximum was 61 μm. There was a 13.72% variance in diameter [Figures 4 and 6b].
Percentage decrease in mean diameter through different grades
With increase in disease severity, the mean diameter decreases. In the frontal area, the decrease was 12.13% from grade one to two and 8.77% from grade two to three. In the occipital area, the diameter decreased only by 0.11% from grade one to two. However, from grade two to three, the decrease was 8.32% [Figure 7].
Figure 7.
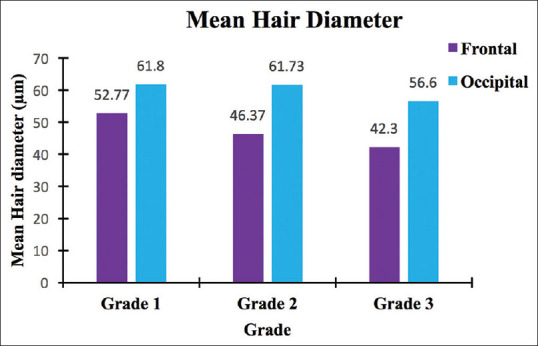
Comparison of mean hair diameters over frontal and occipital scalp (bar diagram)
Correlation and variance
Spearman's correlation and ANOVA closely resemble the relationship as in hair density. Spearman's correlation indicates that the trend in each grade, are similar with rho values between 0.96 and 0.99, which is highly significant (P < 0.001). ANOVA indicates that the means in different grades are distinctly different from one another (P < 0.001), except between grade one and grade two in occiput, where both the means are similar (P = 0.9121) [Table 2].
Table 2.
Spearman’s correlation and ANOVA of hair diameter
| Spearman’s correlation Area | Grade 1 versus Grade 2 | Grade 2 versus Grade 3 | Grade 1 versus Grade 3 | |||
|---|---|---|---|---|---|---|
|
|
|
|
||||
| Rho | P | Rho | P | Rho | P | |
| Frontal | 0.9608 | <0.001 | 0.9723 | <0.001 | 0.9740 | <0.001 |
| Occiput | 0.9833 | <0.001 | 0.9854 | <0.001 | 0.9892 | <0.001 |
|
| ||||||
| ANOVA Area | Grade 1 versus Grade 2 | Grade 2 versus Grade 3 | Grade 1 versus Grade 3 | |||
|
|
|
|
||||
| P | Significance | P | Significance | P | Significance | |
|
| ||||||
| Frontal | <0.001 | HS | <0.001 | HS | <0.001 | HS |
| Occiput | 0.9121 | NS | <0.001 | HS | <0.001 | HS |
NS – Nonsignificant, HS – Highly significant
DISCUSSION
Hair density
Hair density of the scalp has been worked by many investigators in normal and diseased populations. Birch et al. conducted a study on 377 women with other complaints, aged between 18 and 99 years, and 47 women with FPHL. Their results showed that the hair density was 293 ± 61.3 hairs/cm2 at 35 years, which fell to 211 ± 55.1 hairs/cm2 at 70 years. Most women who were classified as having FPHL had a hair density within the lower half of the normal distribution. The perception of hair loss was determined by the presence of a low density (P < 0·001), but there was overlap in the densities between the Ludwig grade one group and the no hair loss group, which was partly accounted for by the differences in hair shaft diameters (P < 0·001). A lower hair density was associated with lesser hairs of all diameters. They showed that hair density is distributed as a normal variable and is thereby determined as a multifactorial trait. Women with FPHL have a low hair density, falling below the mean. However, it lies within the spectrum of a normal distribution.[6]
Kim et al. on a study in the Chinese population showed that there was an 18% decrease between women in their twenties (159.6 ± 35.9 N/cm2) compared to those in their sixties (130.7 ± 38.4 N/cm2).[7] Kim et al. in a study on Korean women showed that hair density decreased by about 25% in women in their sixties versus the twenties. They inferred that, there are differences in hair loss parameters with age in Asian populations.[8]
Jimenez and Ruifernández investigated 50 patients in a European Hospital. In the occipital scalp, the number of follicular units per cm2 ranged between 65 and 85. They also opined that the hair density ranged between 124 and 200.[9]
Yaprohm et al. reported that in 20 cases studied, the density of hair was statistically lower in Caucasians (P = 0.002), but more than those in African-Americans (P = 0.004) and Koreans (P < 0.001). They concluded that the density of hair in Caucasians, Koreans, African-Americans, and Thai population were authentically different depending on their ethnic backgrounds. Hence, a universal standard may lead to a misdiagnosis of disease.[10]
Loussouarn studied 38 young adults, 19 women and 19 men aged 27 ± 10 years, in Central and West Africa. The hair density varied between 90 and 290 hairs/cm2, with more number over the vertex. There was no significant difference between men and women. The hair density among the African volunteers was lesser than the Caucasian (190 ± 40 and 227 ± 55 hairs/cm2, respectively).[11]
In the present study, in the frontal area, where the disease affects severely, the minimum hair density was 62/cm2 in grade three and maximum was 196/cm2 in grade one. Whereas, in occiput, the minimum was 179/cm2 in grade three and maximum was 266/cm2 in grade one. In the present study, it is inferred that FPHL involves the occipital area as well. It was seen that an 89% more density was observed in the occipital area, compared to the frontal area (Occiput: 215; Frontal: 114). Between grade two and grade three, the reduction of hair density was 23.99%, while it was 18.51% in the occiput. The point of emphasis here is that the occiput is also involved in hair loss, where hair density is concerned.
Along similar lines, as the disease progressed, the frequency of patients with lesser hair density increased. In the frontal area, 50% of the patients had a range of 101–110 hairs/cm2 in grade one. As the disease severity increased to grade three, 53% of the patients had a range of 71–80 hairs/cm2 only. Similarly, in the occiput, 23% of patients had 211–220 hairs/cm2 in grade one, while in grade three, 37% of patients had a density range of 171–180 hairs/cm2 only [Figures 2-5], Annexure Tables 1 and 2].
Spearman's correlation indicated that the relationship of hair density between different grades is not random but highly significantly positively correlated (Rho = 0.99; P < 0.001). ANOVA shows that in the frontal area, all the three grades of FPHL are distinctly different from one another (P < 0.001). In Rakowska's criteria for disease classification, hair density is not included.[3]
However, in the present study, it was found that hair density shows significant variation between grades. Table 3 shows the summary of hair density results of studies conducted by different investigators.
Table 3.
Summary of hair density results of various studies
| Investigator | Mean Age (Years) | Density (/sq cm) | Population |
|---|---|---|---|
| Birch et al[6] | 35 | 293±61·3 | European |
| Birch et al[6] | 70 | 211±55·1 | European |
| Kim et al[7] | 20 | 159.6±35.9 | Chinese |
| Kim et al[7] | 60 | 130.7±38.4 | Chinese |
| Loussouarn[11] | 27 | 190±40 | African |
| Loussouarn[11] | - | 227±55 | Caucasian |
| Present study | 37 | 74-114 (Frontal) | Indian |
| Present study | 37 | 168-215 (Occiput) | Indian |
Hair diameter
There are two kinds of hairs on the scalp. Vellus and Terminal. Vellus hairs are small hairs, <0.03 mm in diameter and <2 cm long. They lack melanin and medulla.[12] Long, coarse, pigmented hairs with a larger and varied diameter are called “terminal hairs.” Terminal hairs are classified into three groups as Thin hairs with hair shaft diameter of below 30 μm, Medium hairs with diameter of 30–50 μm and Thick hairs with diameter of >50 μm.[3] In the present study, vellus hairs are not considered for calculating diameter. From each patient, 50 terminal hairs were taken at random in the image, separately in the frontal and occipital area, and the diameter of the hair almost at the base of the shaft was calculated. The average of 50 readings is considered as the average hair diameter of the particular patient.
Robbins et al. have shown that the parietal scalp hair diameter increases from the age of 20-40-45 years, and then decreases.[13] Cottington et al., studied 20 women aged between 24 and 59 years and found that the average hair diameter was 70 μm (ranging from under 60 to around 90 μm).[14]
Rakowska et al. reported that, both in healthy controls and in patients with Chronic Telogen Effluvium, the thickest hairs were over the frontal area and the thinnest over the occipital area. In the healthy controls, the mean hair thickness over the frontal area was 0.061 mm ± 0.008 mm versus 0.058 ± 0.007 mm over the occipital area (P < 0.001). In FPHL, the frontal area showed the smallest mean thickness of hair roots at 0.047 ± 0.007 mm, compared to 0.052 ± 0.008 mm in the occipital area (P < 0.001).[3]
Kim et al. claimed that the average hair diameter peaked in the mid-40 age range (89.0 ± 12.8 μm), and then reduced.[7] Kim et al. showed that in Korean women, the average hair diameter was the highest in the twenties and decreased from the fifties to sixties.[8]
In the present study, the data indicated that the average diameter of the occipital hair (51–66 μm) is bigger than that of frontal area (38–58 μm). As the disease progresses, the diameter of hair reduces. In the frontal area, from grade one to grade two, there was 12.13% reduction, and from grade two to grade three, the reduction in hair diameter was 8.77%. Cumulatively from grade one to grade three, the reduction was 19.84%. In the occipital area, from grade one to grade two, there was not much reduction in diameter (0.11%) but from grade two to grade three, the reduction in hair diameter was 8.32%. Cumulatively from grade one to grade three the reduction was 8.41%. This infers that the hair diameter variance is more in frontal area than the occipital area, through the disease severity. As the disease progresses, the higher frequency of patients fall under the groups of lower diameter range. Spearman's rho value for the correlation of hair diameters between any two groups is more than 0.96 indicating strong similarities in the trends of diameter variance within each group. ANOVA indicates that each grade is distinctly different from one another (P < 0.001) with an exception of difference of means between occipital grade one and grade two (P = 0.9121). Therefore, hair diameter can be one of the parameters for disease severity prognosis [Figures 3, 4 and 6, Figure 7, Annexure Table 3 and 4].
Table 4 shows the hair diameter data available from different investigators.
Table 4.
Summary of hair diameter data from various studies
| Investigator | Diameter (µm) | Range (µm) | Particulars | Population |
|---|---|---|---|---|
| Rakowska et al[3] | 47±0.7 | - | Frontal | Polish |
| Rakowska et al[3] | 52±0.8 | - | Occiput | Polish |
| Cottington et al[14] | 70 | 60-90 | - | European |
| Present study | 52.77±2.25 | 49-58 | Grade 1 Frontal | Indian |
| Present study | 46.37±1.90 | 42-51 | Grade 2 Frontal | Indian |
| Present study | 42.30±1.90 | 38-46 | Grade 3 Frontal | Indian |
| Present study | 61.80±2.59 | 56-66 | Grade 1 Occiput | Indian |
| Present study | 61.73±2.03 | 58-65 | Grade 2 Occiput | Indian |
| Present study | 56.60±2.79 | 51-61 | Grade 3 Occiput | Indian |
Limitations of the study
We consider that our study is limited by the absence of histopathology to confirm the diagnosis of FPHL. A scalp biopsy would have been ideal but requires multiple samples and can be disfiguring. Hence, a trichoscopic criteria were used for diagnosis.
We also consider that recruiting healthy controls for comparison would have been ideal.
CONCLUSION
Average hair density and the pattern during hair loss vary in different ethnic populations. Therefore, a universal standard may mislead the disease diagnosis.
With regard to hair density, as the disease progressed, the hair density over the frontal scalp reduced. Interestingly, it was also found that there was a decrease in density over the occipital area as well with increasing grade of disease.
When hair diameters were measured and compared, the hair over the occipital scalp was of a higher diameter than the frontal hair. The frontal scalp showed a reduction in average hair diameter from grade one to grade three severity of disease. Similar findings, albeit, to a lesser extent, was also found over the occipital scalp.
Hence, the present study indicates that hair density and hair diameter variance could also be the parameters for FPHL disease classification.
Although more studies on Indian women with FPHL are required, trichoscopy can be a useful device for the diagnosis of FPHL among Indian women, determination of grade of disease and progression of severity.
Financial support and sponsorship
Nil.
Conflicts of interest
There are no conflicts of interest.
ANNEXURE
Annexure 1: Source tables for graphs
Table 1.
(a) Frequency distribution of hair density in the frontal area, and (b) Frequency distribution of hair density in the occipital area
| Range | Frequency (%) | ||
|---|---|---|---|
|
| |||
| Grade-1 | Grade-2 | Grade-3 | |
|
| |||
| a. Hair density in frontal area (per sq.cm) | |||
| 61-70 | 0 | 0 | 10 (33) |
| 71-80 | 0 | 0 | 16 (53) |
| 81-90 | 0 | 6 (20) | 4 (13) |
| 91-100 | 1 (3) | 14 (47) | 0 |
| 101-110 | 15 (50) | 8 (27) | 0 |
| 111-120 | 9 (30) | 2 (7) | 0 |
| 121-130 | 4 (13) | 0 | 0 |
| 131-140 | 0 | 0 | 0 |
| 141-150 | 0 | 0 | 0 |
| 151-160 | 0 | 0 | 0 |
| 161-170 | 0 | 0 | 0 |
| 171-180 | 0 | 0 | 0 |
| 181-190 | 0 | 0 | 0 |
| 191-200 | 1 (3) | 0 | 0 |
|
| |||
| b. Hair density in occiput (per sq.cm) | |||
|
| |||
| 111-120 | 0 | 0 | 2 (7) |
| 121-130 | 0 | 0 | 1 (3) |
| 131-140 | 0 | 1 (3) | 0 |
| 141-150 | 0 | 0 | 4 (13) |
| 151-160 | 0 | 0 | 2 (7) |
| 161-170 | 0 | 0 | 2 (7) |
| 171-180 | 3 (10) | 1 (3) | 11 (37) |
| 181-190 | 1 (3) | 3 (10) | 8 (27) |
| 191-200 | 5 (17) | 6 (20) | 0 |
| 201-210 | 4 (13) | 8 (27) | 0 |
| 211-220 | 7 (23) | 6 (20) | 0 |
| 221-230 | 4 (13) | 3 (10) | 0 |
| 231-240 | 3 (10) | 2 (7) | 0 |
| 241-250 | 0 | 0 | 0 |
| 251-260 | 2 (7) | 0 | 0 |
| 261-270 | 1 (3) | 0 | 0 |
Table 2.
Mean statistical parameters of hair density in FPHL
| Particulars | Frontal | Occipital | ||||
|---|---|---|---|---|---|---|
|
|
|
|||||
| Grade-1 | Grade-2 | Grade-3 | Grade-1 | Grade-2 | Grade-3 | |
| Mean±SD | 114.13±17.39 | 97.13±6.66 | 73.83±5.89 | 215.20±22.27 | 205.87±18.84 | 167.77±20.69 |
| Minimum–maximum | 99–196 | 86–114 | 62–85 | 176–266 | 140–238 | 119–190 |
| Mode | 104 | 90 | 70 | 220 | 220 | 179 |
SD – Standard deviation
Table 3.
Frequency table of hair diameter
| Range | Frontal | Occipital | ||||
|---|---|---|---|---|---|---|
|
|
|
|||||
| Grade-1 | Grade-2 | Grade-3 | Grade-1 | Grade-2 | Grade-3 | |
| 31-35 | 0 | 0 | 0 | 0 | 0 | 0 |
| 36-40 | 0 | 0 | 5 | 0 | 0 | 0 |
| 41-45 | 0 | 8 | 24 | 0 | 0 | 0 |
| 46-50 | 4 | 21 | 1 | 0 | 0 | 0 |
| 51-56 | 23 | 1 | 0 | 0 | 0 | 9 |
| 57-60 | 3 | 0 | 0 | 9 | 11 | 19 |
| 61-65 | 0 | 0 | 0 | 19 | 19 | 2 |
| 66-70 | 0 | 0 | 0 | 2 | 0 | 0 |
Table 4.
Comparison of mean hair diameters over frontal and occipital scalp, in FPHL
| Parameters | Frontal | Occipital | ||||
|---|---|---|---|---|---|---|
|
|
|
|||||
| Grade-1 | Grade-2 | Grade-3 | Grade-1 | Grade-2 | Grade-3 | |
| Mean±SD | 52.77±2.25 | 46.37±1.90 | 42.30±1.90 | 61.80±2.59 | 61.73±2.03 | 56.60±2.79 |
| Variance | 5.08 | 3.62 | 3.60 | 6.72 | 4.13 | 7.77 |
| Variance (%) | 9.63 | 7.81 | 8.50 | 10.87 | 6.70 | 13.72 |
| Mode | 51.00 | 46.00 | 43.00 | 64.00 | 60.00 | 58.00 |
| Minimum–maximum | 49.00-58.00 | 42.00-51.00 | 38.00-46.00 | 56.00-66.00 | 58.00-65.00 | 51.00-61.00 |
SD – Standard deviation
REFERENCES
- 1.Herskovitz I, Tosti A. Female pattern hair loss. Int J Endocrinol Metab. 2013;11:e9860. doi: 10.5812/ijem.9860. [DOI] [PMC free article] [PubMed] [Google Scholar]
- 2.Singal A, Sonthalia S, Verma P. Female pattern hair loss. Indian J Dermatol Venereol Leprol. 2013;79:626–40. doi: 10.4103/0378-6323.116732. [DOI] [PubMed] [Google Scholar]
- 3.Rakowska A, Slowinska M, Kowalska-Oledzka E, Olszewska M, Rudnicka L. Dermoscopy in female androgenic alopecia: Method standardization and diagnostic criteria. Int J Trichology. 2009;1:123–30. doi: 10.4103/0974-7753.58555. [DOI] [PMC free article] [PubMed] [Google Scholar]
- 4.Messenger AG, Sinclair RD, Farrant P, de Berker DA. Acquired disorders of hair. In: Griffiths CE, Barker J, Bleiker T, Chalmers R, Creamer D, editors. Rook's Textbok of Dermatology. 9th. Vol. 3. Chichester, West Sussex UK: Wiley Blackwell; 2016. pp. 89–21. [Google Scholar]
- 5.Ludwig E. Classification of the types of androgenetic alopecia (common baldness) occurring in the female sex. Br J Dermatol. 1977;97:247–54. doi: 10.1111/j.1365-2133.1977.tb15179.x. [DOI] [PubMed] [Google Scholar]
- 6.Birch MP, Messenger JF, Messenger AG. Hair density, hair diameter and the prevalence of female pattern hair loss. Br J Dermatol. 2001;144:297–304. doi: 10.1046/j.1365-2133.2001.04018.x. [DOI] [PubMed] [Google Scholar]
- 7.Kim S, Kim SN, An S, Yeon JH, Wang X, Li L, et al. Ageing-related features of hair and scalp in chinese women by clinical evaluation study. J Cosmet Dermatol Sci Appl. 2017;07:245–57. [Google Scholar]
- 8.Kim S, Lee S, Choi M, Joo K, Kim S, Koh J, et al. Characteristic features of ageing in Korean women's hair and scalp. Br J Dermatol. 2013;168:1215–23. doi: 10.1111/bjd.12185. [DOI] [PubMed] [Google Scholar]
- 9.Jimenez F, Ruifernández JM. Distribution of human hair in follicular units. A mathematical model for estimating the donor size in follicular unit transplantation. Dermatol Surg. 1999;25:294–8. doi: 10.1046/j.1524-4725.1999.08114.x. [DOI] [PubMed] [Google Scholar]
- 10.Yaprohm P, Manonukul J, Sontichai V, Pooliam J, Srettabunjong S. Hair follicle counts in Thai population: A study on the vertex scalp area. J Med Assoc Thai. 2013;96:1578–82. [PubMed] [Google Scholar]
- 11.Loussouarn G. African hair growth parameters. Br J Dermatol. 2001;145:294–7. doi: 10.1046/j.1365-2133.2001.04350.x. [DOI] [PubMed] [Google Scholar]
- 12.Headington JT. Transverse microscopic anatomy of the human scalp. A basis for a morphometric approach to disorders of the hair follicle. Arch Dermatol. 1984;120:449–56. [PubMed] [Google Scholar]
- 13.Robbins C, Mirmirani P, Messenger AG, Birch MP, Youngquist RS, Tamura M, et al. What women want – Quantifying the perception of hair amount: An analysis of hair diameter and density changes with age in caucasian women. Br J Dermatol. 2012;167:324–32. doi: 10.1111/j.1365-2133.2012.11010.x. [DOI] [PubMed] [Google Scholar]
- 14.Cottington EM, Kissinger RH, Tolgyesi WS. Observations on female scalp hair population, distribution, and diameter. J Soc Cosmet Chem. 1977;28:219–30. [Google Scholar]


