
Figure 3. Mammalian 8-hour transcriptome and metabolome are prevalent.
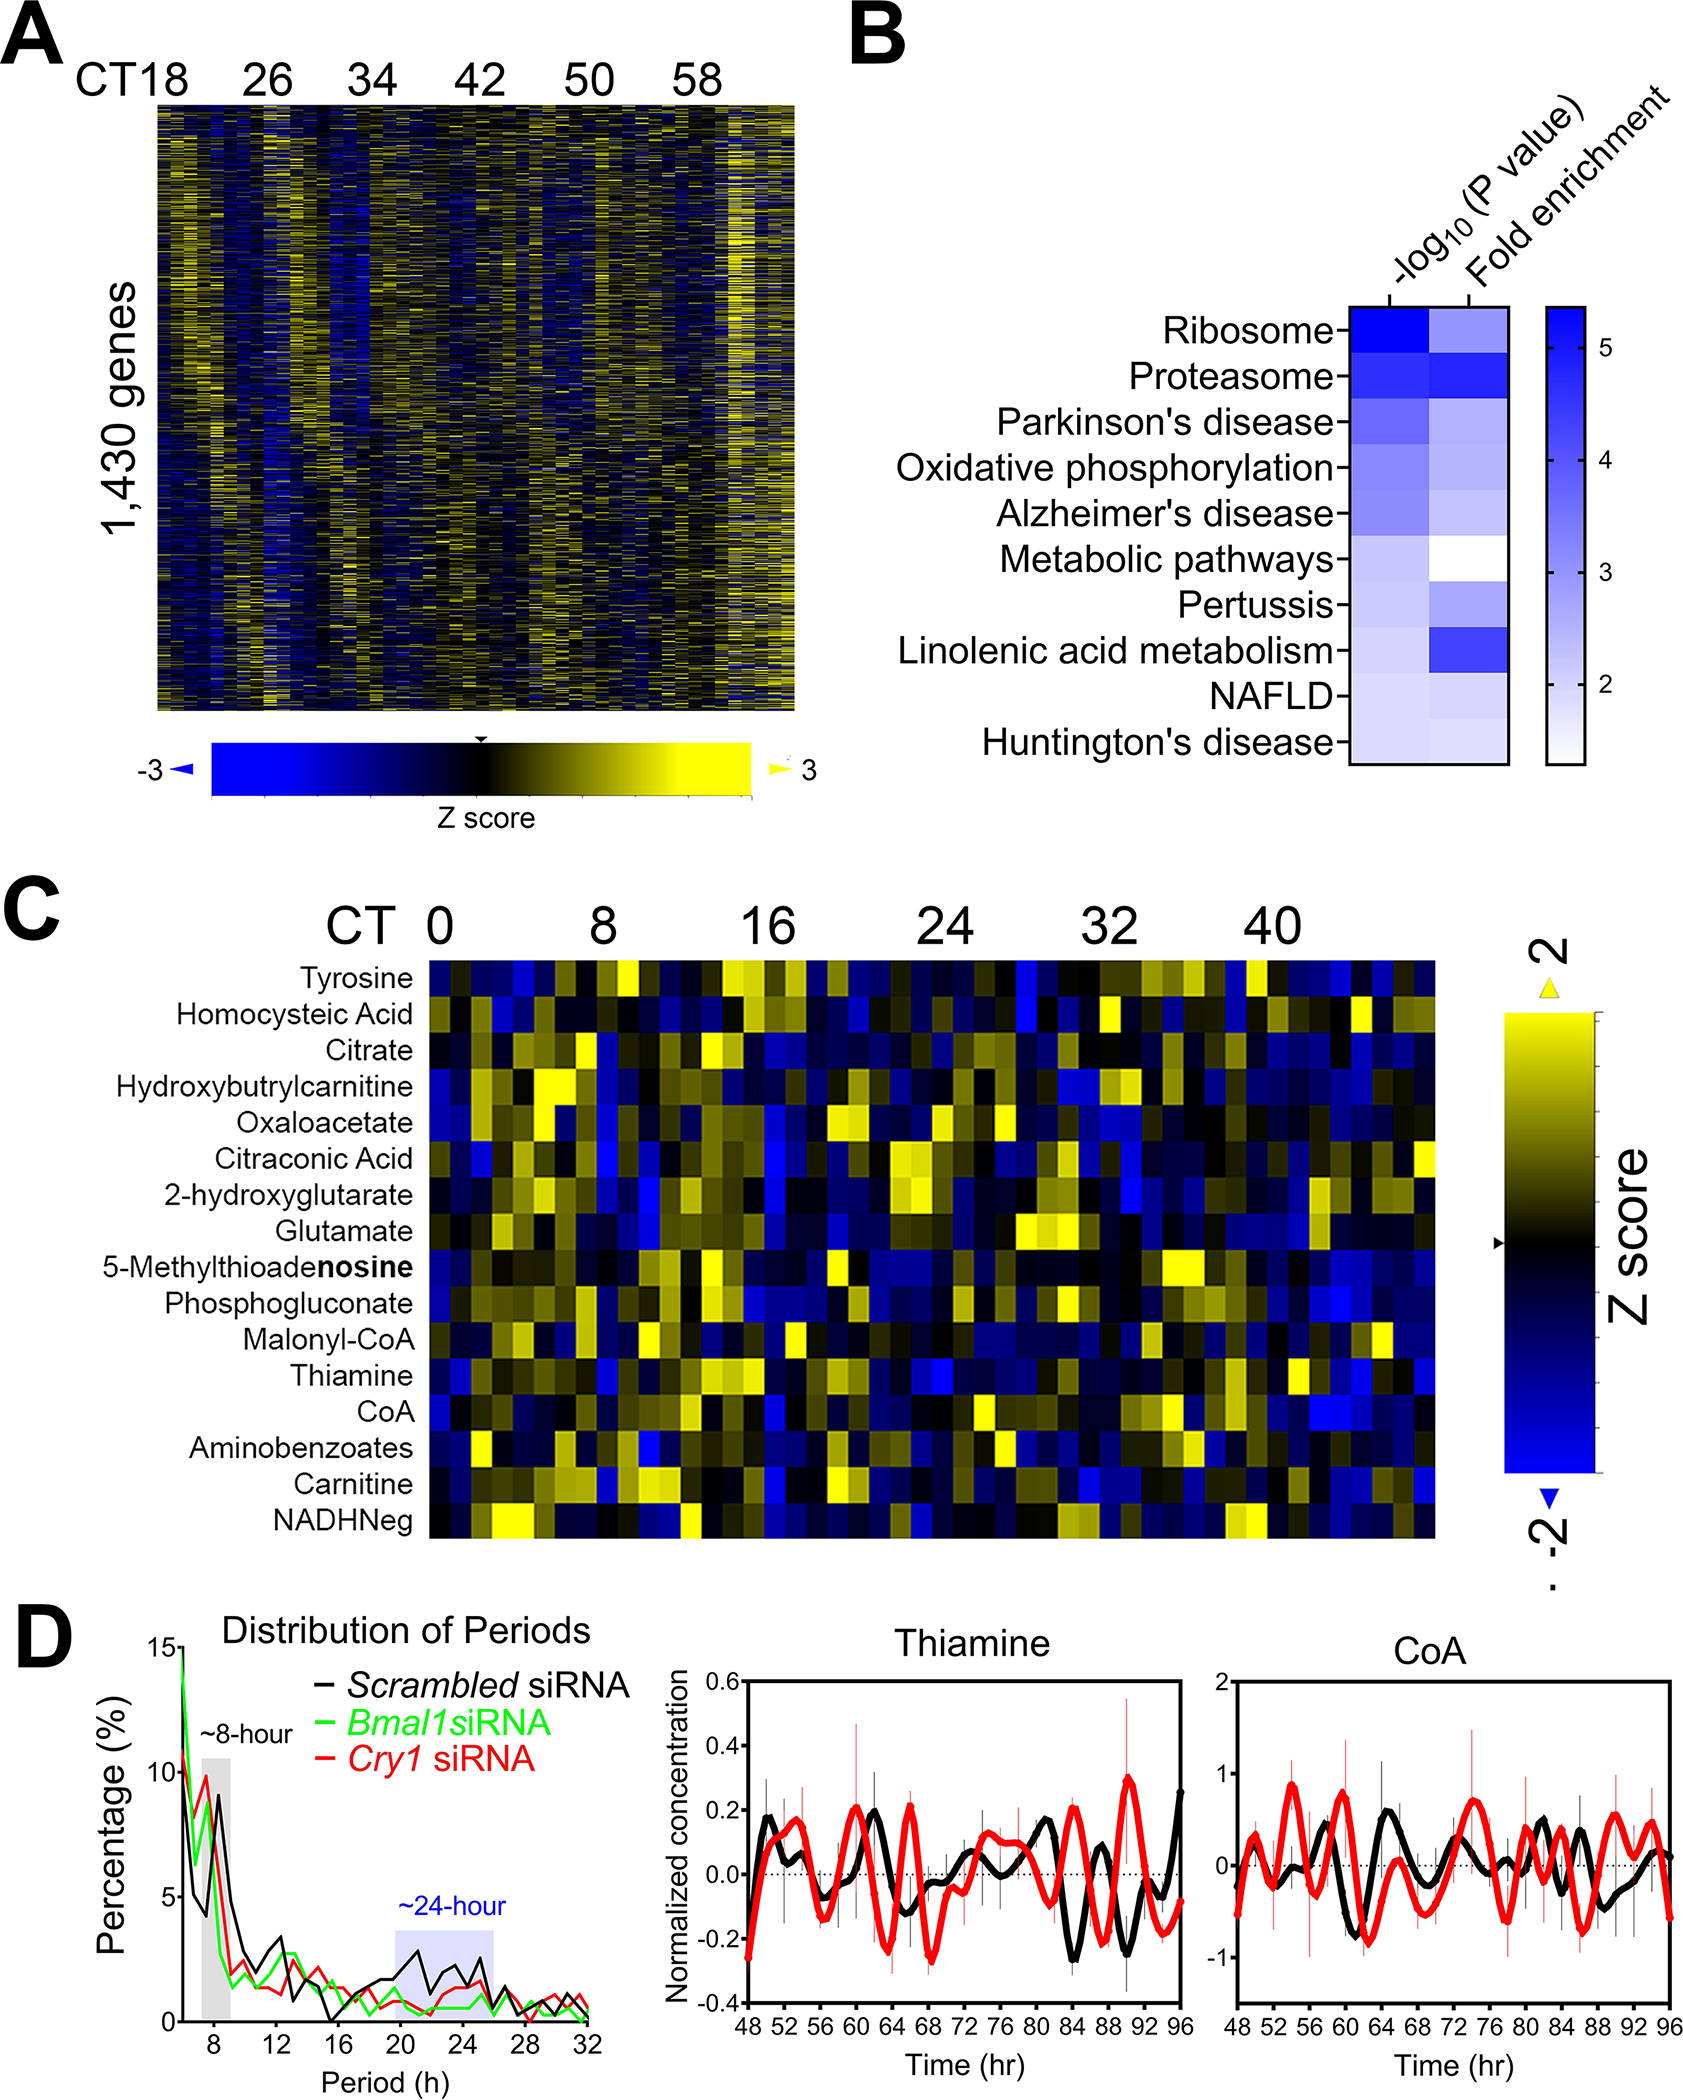
(A) Heat map of hepatic mRNA exhibiting dominant 8-hour oscillation ranked by phase. (B) GO analysis of top enriched KEGG pathways with p value and fold enrichment revealed by David analysis. (C) Heat map of hepatic metabolite exhibiting dominant 8-hour oscillation ranked by phase. (D) U2OS cells are transfected with different siRNAs and synchronized by dexamethasone. Distribution of periods of oscillations revealed by eigenvalue/pencil method under different condition (left) and representative level of thiamine and coenzyme A in cells with scrambled (black) or Cry1 (red) siRNAs.