

Abstract
The development of L858R/T790M/C797S mutations in EGFR is one of the main reasons for the emergence of resistance after third-generation treatment of non-small cell lung cancer (NSCLC). Therefore, the development of 4th generation drugs needs urgent attention. To overcome resistance, in silico drug discovery and Design approaches were employed on a library of 29 novel 9-heterocyclyl substituted 9H-purines derivatives with EGFRL858R/T790M/C797S inhibition for anticancer activity against NSCLC. The COMSIA/EHA model (Q2 = 0.584, R2 = 0.816, and = 0.73) showed a stable and reliable predictive ability of NSCLC activity, which was tested by several validation methods. Molecular docking studies reveal crucial interactions with EGFRL858R/T790M/C797S inhibition for NSCLC activity. Based on theoretical methods, we designed 10 new compounds with good activity potential, which were tested using ADMET properties. Next, the molecular docking results were examined by molecular dynamics simulations to verify the stability of hydrogen bonding interactions with important residues such as MET790, MET793 and SER797, which are essential for the design of 4th generation EGFR Inhibitors to combat drug-resistant NSCLC.
Keywords: Non-small cell lung cancer, 3D-QSAR, EGFRL858R/T790M/C797S inhibition, ADMET, Molecular docking, Molecular dynamics simulation
Non-small cell lung cancer; 3D-QSAR; EGFRL858R/T790M/C797S inhibition; ADMET; Molecular docking; Molecular dynamics simulation
1. Introduction
Lung cancer is responsible for the highest cancer mortality in men and women worldwide [1]. According to World Health Organization (WHO) estimates in 2020 [2], the number of lung cancer cases is expected to exceed 2.21 million and cause 1.80 million deaths worldwide. Thus, the cure rate for lung cancer is less than 20%, indicating that we need to strengthen our efforts to fight lung cancer. Non-small cell lung cancer (NSCLC) accounts for 85% of lung cancers [3]. The Epidermal Growth Factor Receptor (EGFR) is a receptor tyrosine kinase of the ErbB family, which plays a key role in the transmission of cell signalling that leads to proliferation, differentiation, apoptosis and migration [4], [5], [6]. The discovery of EGFR tyrosine kinase inhibitors (EGFR-TKIs) represents an important milestone in NSCLC treatment procedures [7]. However, mutations in the EGFR gene have had a considerable impact on these procedures, resulting in three generations of EGFR-TKIs.
First-generation EGFR-TKIs (Gefitinib and Erlotinib) have been shown to be effective in treating NSCLC in patients with the L858R mutation in EGFR [8], [9], [10]. However, the appearance of the T790M mutation in the EGFRT gene has led to the therapeutic failure of first-generation inhibitors [11]. To overcome the resistance to the T790M mutation, second-generation EGFR-TKIs, namely Afatinib and Dacomitinib, have been developed [12]. However, these inhibitors cause serious side effects [13]. To overcome the mutations and observed toxicity, the development of third-generation EGFR-TKIs (rociletinib, osimertinib) avoided these problems with acceptable side effects and improved action against the T790M mutation [14]. Despite the significant therapeutic success of third-generation EGFR-TKIs, the development of new resistance occurring on target is the C797S mutation, rendering osimertinib clinically ineffective [15]. Therefore, the discovery of new drugs to overcome the L858R/T790M/C797S mutants of the EGFR represents an urgent therapeutic need for the treatment of NSCLC.
In recent years, the use of molecular modeling techniques has yielded very impressive results in the new drug discovery process [16], [17], [18]. For this purpose, three-dimensional quantitative structure–activity relationship (3D-QSAR), molecular docking, pharmacokinetic parameters (ADMET) and Molecular dynamic (MD) simulation have been performed for the design of new molecule able to overcome the resistance of EGFRL858R/T790M/C797S mutation. In this study, 29 EGFRL858R/T790M/C797S inhibitors were studied using two methods, 3D-QSAR and molecular docking to identify key structural factors affecting inhibitory activity. In addition, it helps us to obtain recommendations for the design of new drug candidates from the ZINC database. To test their drug-like potential, all designed compound was evaluated by calculating the ADMET properties. Furthermore, Molecular dynamics simulations were performed for 100 ns to estimate the ligand stability within the protein under normal physiological conditions.
2. Material and methods
2.1. Data set collection and biological activities
In this work, a series of 29 novel 9-heterocyclyl substituted 9H-purines derivatives (Fig. 1) as EGFR-TKIs of the L858R/T790M/C797S mutants was collected from the recent literature [19]. Thus, the observed activity values (IC50) were converted to their negative logarithm pIC50 (−logIC50) values to build the 3D-QSAR models. To build construct the 3D-QSAR models (Table 1), the dataset containing 29 compounds was randomly divided into a training set containing 21 compounds to generate the 3D-QSAR models (Table 1), while the remaining 8 compounds 5 represented by the symbol “*” superscript were used as a test set to verify the performance and accuracy of the established models.
Figure 1.

Structures of 9-heterocyclyl substituted 9H-purines derivatives.
Table 1.
Observed and predicted anticancer activity against NSCLC of 9-heterocyclyl substituted 9H-purines derivatives.
| Compounds | R1 | R2 | IC50 (μM) | pIC50 (obs) | pIC50 (pred) | Residual |
|---|---|---|---|---|---|---|
| 1 | H |  |
0.11 | 6.958 | 6.726 | 0.231 |
| 2 | F |  |
0.58 | 6.236 | 6.124 | 0.112 |
| 3* | H |  |
0.012 | 7.921 | 7.607 | 0.313 |
| 4 | F |  |
0.027 | 7.568 | 7.48 | 0.087 |
| 5* | F |  |
0.12 | 6.921 | 7.222 | −0.301 |
| 6 | F |  |
0.28 | 6.553 | 6.709 | −0.156 |
| 7 | H |  |
0.53 | 6.276 | 6.919 | −0.643 |
| 8 | F |  |
1.22 | 5.914 | 6.332 | −0.418 |
| 9* | H |  |
0.065 | 7.187 | 6.875 | 0.311 |
| 10 | F |  |
0.3 | 6.523 | 6.319 | 0.204 |
| 11* | F |  |
0.038 | 7.421 | 6.98 | 0.441 |
| 12 | F |  |
0.12 | 6.921 | 6.784 | 0.136 |
| 13 | H |  |
0.17 | 6.769 | 6.221 | 0.547 |
| 14 | H |  |
0.26 | 6.585 | 7.068 | −0.483 |
| 15* | H |  |
0.017 | 7.769 | 7.696 | 0.072 |
| 16 | H |  |
0.0016 | 8.796 | 8.058 | 0.738 |
| 17 | F |  |
0.38 | 6.421 | 6.534 | −0.113 |
| 18 | F |  |
1.52 | 5.818 | 5.638 | 0.179 |
| 19 | F |  |
1.81 | 5.742 | 5.722 | 0.019 |
| 20* | F |  |
0.0075 | 8.125 | 7.892 | 0.232 |
| 21 | H |  |
0.00088 | 9.055 | 8.919 | 0.135 |
| 22 | F |  |
0.35 | 6.456 | 7.092 | −0.635 |
| 23 | F |  |
0.0025 | 8.602 | 8.345 | 0.256 |
| 24 | F |  |
0.0018 | 8.745 | 8.029 | 0.715 |
| 25 | F |  |
0.0086 | 8.065 | 8.759 | −0.694 |
| 26* | F |  |
0.066 | 7.181 | 6.959 | 0.221 |
| 27 | F |  |
0.01 | 8 | 8.163 | −0.163 |
| 28 | F |  |
0.0075 | 8.125 | 8.179 | −0.054 |
| 29* | F |  |
0.05 | 7.301 | 7.023 | 0.278 |
2.2. Structural minimization and alignment
Molecular alignment is one of the most important parameters of 3D-QSAR studies, as this step is a determining factor of the successful model [20]. All ligands were constructed with the sketch module and optimized under the Tripos force field, using Gasteiger-Hückel charges [21]. The convergence criterion of the Powell gradient algorithm was set to 0.005 kcal/(mol Å) and a maximum iteration coefficient of 10,000 to obtain a stable conformation [22]. All optimized molecular structures were aligned to the most active compound 21 of the series, using the ALIGN DATABASE method available in SYBYL-X 2.0 software.
2.3. 3D-QSAR studies
Ligand-guided alignment was used to derive the CoMSIA models using SYBYL-X 2.1. The aligned inhibitors of the training set were placed inside a 3D cubic lattice with a grid spacing of 2 Å in all Cartesians directions. The CoMSIA descriptors, which includes five force fields (steric, electrostatic, hydrophobic, hydrogen bond donors and acceptors), were calculated using a sp3 hybridized carbon probe atom with a van der Waals radius of 1.52 Å and a net charge of +1.0. An energy cut-off value was set at 30 kcal/mol. The minimum column filtering and attenuation factor were set to 2.0 and 0.3 kcal/mol, respectively.
2.3.1. Partial least squares analysis
The partial least squares (PLS) analysis was used to build the CoMSIA models [23]. First, the leave-one-out (LOO) cross-validation method was applied to obtain the optimal number of components (ONC) with the highest cross-validation coefficient of determination (Q2) to validate this step. Second, after determining the ONC, CoMSIA models were built based on statistical parameters such as the coefficient of determination (R2), the standard error of estimate (SEE), the F-value (Fischer test) and the contributions of each field. In order to test the predictive ability and stability of the models, several validation strategies were also applied.
2.4. 3D-QSAR models validation
2.4.1. Y-randomization
The Y randomization technique is a widely used approach to ensure the robustness of a 3D-QSAR model [24]. In this test, only the values of the dependent variable (biological activity) are randomly shuffled several times, while the values of the independent variable (descriptors) remain unchanged. These random data are then used to generate new 3D-QSAR models, the and values of the random model are then tested against the Eriksson and Wold criteria [25] represented by the following rule:
-
•
< 0.2 and < 0.2, no chance correlation
-
•
any and 0.2 < < 0.3, negligible chance correlation
-
•
any and 0.3 < < 0.4, tolerable chance correlation
-
•
any and > 0.4, recognized chance correlation.
An additional criterion based on the parameter called which must be greater than 0.5, was calculated according to the following equation:
| (1) |
2.4.2. External validation of the CoMSIA model
To verify the predictive capabilities of the proposed models, the biological activities of the test set of 8 compounds were predicted. The predictive ability of the models is measured by the external validation coefficient of determination () calculated by the following formula:
| (2) |
The value of SD is the sum of the squared deviations between the biological activity of the compounds in the test set and the mean activity of the training set, and the predictive sum of squares (PRESS) is the sum of the squared deviations between the predicted and actual activities of the test set compounds. To test the reliability of 3D-QSAR models in predicting the activity of new compounds, external validation statistical criteria was introduced by Golbraikh and Tropsha [26] described by the following equations:
| (3) |
| (4) |
| (5) |
| (6) |
Where and indicate the squared correlation coefficients through origin between predicted and observed activity, as well as observed and predicted activity of the test set, respectively. k and k′ are the slopes for regression through origin.
Furthermore, according to Roy's statistical criteria [25] to validate the predictive ability of the model, it is important to calculate the difference between the values of r2, and according the following equation:
| (7) |
| (8) |
2.4.3. Applicability domain
The applicability domain (AD) [27] has been applied to determine the region of chemical space of a 3D QSAR model, which can be used to reliably predict new compounds. In this study, one of the simple approaches to determine the DA is the leverage approach. The leverage values (h) were calculated for each molecule for a graphical detection of outliers in the Williams diagram by the following relationship:
| (9) |
In this equation: xi: the descriptor vector of the tested compound, X: the matrix n*(k − 1) where n is the number of compounds and k the number of descriptors in the training set and the exponent t refers to the matrix/vector transposition. This diagram validates the reliability of the 3D-QSAR model if the value of h is lower than the critical value of the leverage (h*) (h* = 2.5 (k + 1)/n) [28], [29], where n is the number of compounds and k is the number of descriptors in the training set. The AD of the 3D-QSAR model is located to the left of the vertical line of h* = 0.47.
2.5. Molecular docking investigation
Molecular docking is a reliable computational method, which can be performed to analyze the interactions between potential drugs and the active site of the target protein, in order to better understand the key structural requirements of a geometric model as a function of binding energy. In the present work, we performed the molecular docking study of two compounds 4 and 2 with the same R1 and R2 substitution, but with different R and S enantiomers, with compound 4 having higher activity than compound 2, in the active site of EGFRL858R/T790M/C797S (PDB code 6lud), which is downloaded from the RCSB protein database [30]. Firstly, Discovery Studio software [31] was used to prepare the protein by removing all water molecules, ligands and non-protein parts. AutoDock Tools software version 1.5.6 was used to analyze ligand-protein interactions [32]. The 3D grid was created by the AUTOGRID algorithm to measure the energies of ligand-protein interactions [33]. The grid maps were generated using 60 Å in all Cartesian directions, with grid-spacing 0.375 Å, the grid center coordinates are approximately (−53.330 Å, −5.149 Å, and −17.579 Å) for the location of the ligand in the complex. The 2D and 3D visualizations and the analysis of the docked conformations according to the established interactions were performed using Discovery Studio [31].
2.5.1. Docking validation protocol
The molecular docking simulation was verified by re-docking the crystallized ligand (drug Osimertinib) into the protein (6lud.pdb). Therefore, the crystallised ligand was extracted from the protein and docked to the same protein. The lowest energy pose of the docked ligand and the crystallised ligand was superimposed, in order to calculate the root mean square deviation (RMSD). To validate the docking process, the RMSD must be less than 2 Å [34], [35], [36].
2.6. ADMET prediction studies
The development of computational technology in the pharmaceutical field has made it possible to identify new drug candidates, reducing the number of experimental tests and improving the success rate. With this in mind, the in silico study provides a pathway for ADMET (Absorption, Distribution, Metabolism, Excretion and Toxicity) pharmacokinetic parameters [37], [38], with drug absorption in the human gut, drug penetration into the central nervous system and the blood-brain barrier, metabolism is the chemical biotransformation of a drug by the body, excretion is the elimination of a drug by the body and the toxicity levels of a drug.
2.7. Molecular dynamic simulation studies
Molecular dynamics (MD) simulations were carried out using the NAMD (Nanoscale Molecular Dynamics) program [39]. We used the CHARMM-GUI server to generate the NAMD input files [40]. The CHARMM36 force field was applied to proteins and small molecules. Protein-ligand systems were solvated with the TIP3P water model in a 10 Å cubic box around and neutralised using the KCl salt at the 0.15 M ionic concentration [41]. The energy of all systems was minimised for 10,000 steps using the steepest descent method, and equilibrated under constant atom number, volume and temperature (NVT) at 310 K for 10 ns in an ensemble. Finally, the system was subjected to 100 ns of unconstrained MD simulations in a constant atomic number, pressure and temperature (NPT) ensemble with temperature (310 K) and pressure (1 atm) [42]. The analyses of the MD trajectories were used to generate the root mean square deviation (RMSD), root mean square fluctuation (RMSF) using Visual Molecular Dynamics (VMD) software [43] to check the stability of the systems.
3. Results and discussion
3.1. Molecular minimization and alignment
The compound-based molecular alignment method was performed using the available alignment rule to build a powerful 3D-QSAR model. The most active compound 20 of the series was chosen as the model molecule to align the data set and to visualise the CoMSIA model contour maps. Fig. 2 illustrates the minimisation and alignment of all 3D structures of the data sets to the common core based on compound 21.
Figure 2.

Alignment of all compounds.
3.2. CoMSIA studies
The statistical parameters of the CoMSIA models are presented in Table 2. For the CoMSIA analysis, the combination of the five molecular fields was used to develop the different CoMSIA models. However, the hydrogen bond donor field is zero for the molecules in the series. The results indicate that the best combination was the electrostatic field, the hydrophobic field and the hydrogen bond acceptor field (EHA), with The contribution rates were 24.7%, 11.7% and 63.6%, respectively. In the CoMSIA/EHA model, the Q2 was 0.571 with two as the optimal number of components, The R2 was 0.852 with a reliable SEE of 0.434 and the F-test value is 51.812, highest predictive value was obtained = 0.715 for the external validation of the test set.
Table 2.
The PLS statistical results.
| Q2 | R2 | RMSE | F | ONC | Fractions |
||||||
|---|---|---|---|---|---|---|---|---|---|---|---|
| Ster | Elec | Hyd | Don | Acc | |||||||
| CoMSIA/SEA | 0.584 | 0.844 | 0.445 | 48.687 | 2 | 0.603 | 0.121 | 0.216 | - | 0.663 | |
| CoMSIA/SEH | 0.386 | 0.816 | 0.497 | 25.198 | 3 | 0.408 | 0.249 | 0.432 | 0.319 | - | |
| CoMSIA/SHA | 0.579 | 0.849 | 0.437 | 50.773 | 3 | 0.676 | 0.170 | 0.132 | - | 0.698 | |
| CoMSIA/EHA | 0.571 | 0.852 | 0.434 | 51.812 | 2 | 0.715 | 0.247 | 0.117 | - | 0.636 | |
| CoMSIA/SEHA | 0.567 | 0.846 | 0.442 | 69.893 | 2 | 0.680 | 0.112 | 0.198 | 0.108 | - | 0.582 |
Overall, the proposed model is considered a reliable predictive model, if the Q2 and R2 values are greater than 0.5 and 0.6, respectively, with a prediction value of the new compound activity greater than 0.6. Thus, the CoMSIA/EHA model indicates statistical significance and good predictive quality, which was confirmed by the predictive ability of the external validation. For more precision concerning the stability and prediction of the CoMSIA/EHA model, several validation methods such as the Y-randomization test, the Tropsha and Golbraikh criteria and Roy criteria were used. Table 3 presents the results of the Y-randomization test of the CoMSIA/EHA model.
Table 3.
Statistical parameters of the COMSIA/EHA model after several Y-Randomization tests.
| Iteration | COMSIA/EHA |
||
|---|---|---|---|
| 1 | −0.22 | 0.340 | 0.66 |
| 2 | −0.239 | 0.388 | 0.628 |
| 3 | −0.176 | 0.330 | 0.666 |
| 4 | 0.060 | 0.360 | 0.647 |
| 5 | −0.143 | 0.404 | 0.617 |
In the results in Table 3, five random mixtures of the Y vector were performed, according to the criteria of the Y-randomization test by Eq. (1) described above. The values of , and indicate that the random correlation in the training set is tolerable. This revealed that the results obtained from the original CoMSIA/EHA model were not due to chance correlation. The results of the external validation test calculated by Eq. (3)-(8) with the Tropcha and Roy criteria for the CoMSIA/EHA model are listed in Table 4.
Table 4.
Statistical data from the external validation of CoMSIA/EHA model.
| Parameter | Validation Criteria | CoMSIA/EHA |
|---|---|---|
| Q2 | Q2 > 0.5 | 0.571 |
| r2 | r2 > 0.6 | 0.715 |
| 0.02 | ||
| k | 0.85 < k < 1.15 | 1.026 |
| 0.02 | ||
| K' | 0.85 < k′ < 1.15 | 0.973 |
| 0.084 | ||
| 0.628 | ||
| 0.581 |
The results in Table 4 reveal that the CoMSIA/EHA model is in perfect agreement with the Tropsha and Golbraikh as well as roy criteria. The CoMSIA/EHA model passed all validation tests, showing a better accuracy in predicting the activity of new compounds. Therefore, to determine the applicability domain of this model, we used William's graph presented in Fig. 3.
Figure 3.

The applicability domain of the CoMSIA/EHA model.
The DA of the CoMSIA/EHA model was assessed by a leverage analysis represented by a Williams diagram (Fig. 3). In the Williams diagrams, the results indicate that all leverage values of the training and test sets were below the critical leverage value (h* = 0.47), except for one outlier of compound 29, which was above the critical leverage, this compound belongs to the test set. The test set of the CoMSIA/EHA model was accurately predicted because there were no outliers for the training set. Therefore, we can reliably predict the anticancer activity of new compounds using this model. Thus, CoMSIA/EHA contour maps were used to analyse the structural requirements for the design of new active compounds.
3.3. CoMSIA model visualization
The CoMSIA/EHA model was used to visualise the three-dimensional equipotentiality map, using the compound 21 with the highest activity as a template. Fig. 4 shows the electrostatic, hydrophobic and hydrogen bond acceptor fields contour maps of the CoMSIA model.
Figure 4.

(a) Electrostatic, (b) hydrophobic and (c) Hydrogen bond acceptor for CoMSIA contour map analysis of compound 21.
In the CoMSIA electrostatic contour maps (Fig. 4(a)), we observed a red contour near the pyrrolidine and piperidine of the R2 indicating an electronegative substitution can improve the activity. This is consistent with the fact that all compounds with electronegative substituents at the R2 position show higher activity. Therefore, the presence of electronegative groups in R2 substitutions could have better activity.
In the CoMSIA hydrophobic contour map (Fig. 4(b)), we observed a gray contour near the pyrrolidine and piperidine of the R2 substitution, indicating that hydrophilic substitution is required in this region. This is consistent with the fact that compound 1-6 with tert-butyl formate as the hydrophilic group has a higher activity than compound 6-12, respectively. Thus, the presence of a hydrophilic group bound to pyrrolidines or piperidines can increase the biological activity.
In the hydrogen bond acceptor contour map (Fig. 4(c)), the red contours near the R2 substitution indicate that the substitution of the hydrogen bond acceptor in this position is unfavourable. Thus, the presence of hydrogen bond acceptor groups decreased the biological activity, which is due to the nature of the receptor in this region which can be a hydrogen bond acceptor. This can be explained by the fact that compounds 24 and 28 with hydrogen bond donor groups show better activities, and with the fact that compounds with hydrogen substitution in the R1 group are more active than compounds with fluorine substitution in the same position. However, a small magenta contour near the nitrogen atom of the pyrrolidine or piperidine substitution R2 is also observed indicating that the hydrogen bond acceptor atoms are favourable in this position only. This can be explained by the fact that compound 21 shows the best activities of the series. Generally, hydrogen bond acceptor groups are unfavorable to inhibitory activity. From Table 2, we notice that the hydrogen bond acceptor field plays a key role in predicting anticancer activity. In the case of the CoMSIA/EHA model, the hydrogen bond acceptor field explains 63.6% of the variance, which explains why hydrogen bond acceptor groups are essential for the inhibition of this process.
3.4. Molecular docking analysis
The molecular docking study was conducted to obtain information on key structural requirements and to analyze the established interaction with EGFRL858R/T790M/C797S protein. Fig. 5 presents the interaction modes obtained by molecular docking for compounds 2 (IC50 = 0.58) and 3 (IC50 = 0.012).
Figure 5.

3D and 2D presentation of the interactions of compounds 3 and 2 in the binding sites of EGFRL858R/T790M/C797S protein. (a) Compound 3 (binding energy −9.52 kcal/mol). (b) Compound 2: (binding energy −9.96 kcal/mol).
Molecular docking interaction of compound 3 with EGFRL858R/T790M/C797S, as observed in Fig. 5 (a), showed three hydrogen bonding interactions with MET790, MET793 and SER797 at distances of 3.07 Å, 1.65 Å and 2.52 Å, respectively. In addition, Pi-sulfur interactions are observed between the two purine rings with the amino acid MET792 (4.12 Å, 5.38 Å). However, compound 2 with EGFRL858R/T790M/C797S (Fig. 5 (b)) forms only two hydrogen bonding interactions with the amino acid with MET790 (2.19 Å) and MET793 (1.79 Å) and one halogen bonding interaction with the amino acid ASP855 (2.69 Å), as well as Two Pi-sulfur interactions are observed between the two purine rings with the amino acid MET790 (4.35 Å, 5.86 Å).
Compounds 3 and 2 formed two hydrogen bond and pi-sulfur interactions with the same residues and position for both ligands. However, the more active compound 3 formed an additional hydrogen bonding interaction with the most important mutated residue, Ser797, in the EGFR binding region, which enhanced the inhibitory activity. Interestingly, the presence of these hydrogen bonds strengthened the binding of the compounds to the protein and allowed the compounds to have strong inhibitory activity.
According to Table 1, the fluorine substituent in the R1 group decreased the inhibitory activity compared to the hydrogen substituent, this could be due to the formation of a halogen interaction with the fluorine substituent that blocks the ligand in the active site, thus decreasing the stability of the ligand-receptor complex. Furthermore, the CoMSIA/EHA hydrogen bond acceptor field contour map shows that ligands with hydrogen bond acceptor groups in are unfavourable for anticancer activity. This observation is fully consistent with the 3D docking results which clearly show that the EGFRL858R/T790M/C797S protein is a hydrogen bond acceptor at this position, validating our hypothesis in the CoMSIA contour map section.
3.4.1. Molecular docking validation
In order to validate the ability of docking algorithms to predict the conformation of the ligand (Osimertinib) bound to the EGFRL858R/T790M/C797S proteins, a self-docking of the crystal ligands was performed to test the accuracy of the docking procedure. Fig. 6 shows the superimposed view between the conformation of the docked ligand and native ligand, with an RMSD value of 0.869 Å less than 2 Å. To visualise the quality of the docking poses in the protein, a visual inspection of the interactions between the crystallized and docked ligand was performed (Fig. 7).
Figure 6.
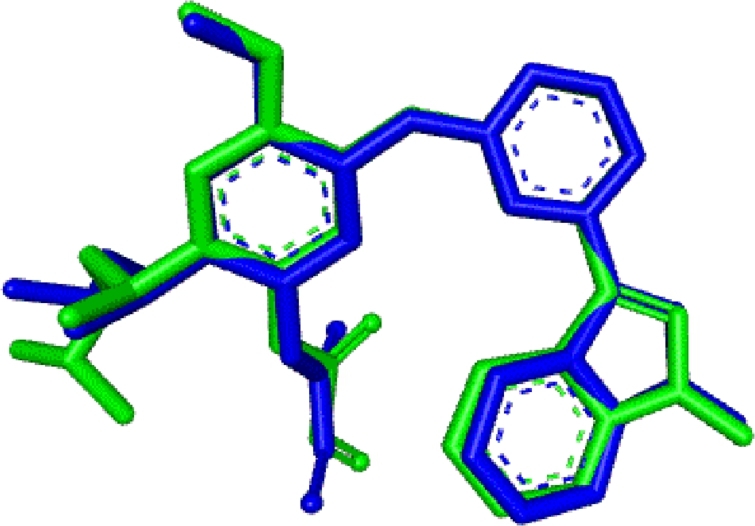
Re-docking pose with RMSD value of 0.869 Å (Original = Green, Docked = blue).
Figure 7.

(a) 2D visualization showing the interactions of the docked ligand. (b) 2D visualization showing the interactions of the native ligand.
The results of the visual inspection show that we obtained the same interaction modes as in the case of the experimental interaction of the drug Osimertinib, observed in Fig. 7(a, b), this indicates a high reliability of the docking protocols to produce the binding mode of the novel EGFRL858R/T790M/C797S inhibitors.
3.5. Drug molecular design
The main objective of this study is to design new EGFR protein inhibitors to overcome the L858R/T790M/C797S mutations. In this regard, new drug candidates are designed using recommendations from 3D-QSAR and molecular docking analysis (Fig. 8) on the structural characteristics of compound 21. In this study, ten 9H-purine derivatives (N1-N10) were designed to improve anticancer activity, the proposed substitutions were taken from the ZINC database. Thus, these newly designed compounds were aligned using compound 21 as a template. The previously established CoMSIA/EHA model and molecular docking with EGFRL858R/T790M/C797S protein were used to predict the activity of these new compounds. The structure of the newly designed molecules, the predicted pIC50 and IC50 values, the calculation of the leverage threshold h* as well as the molecular docking interactions are presented in Table 5.
Figure 8.

Summary of Structural requirements based on CoMSIA/EHA contour map and molecular docking analyses.
Table 5.
The leverage threshold h* and predicted IC50 based on CoMSIA/EHA model and Molecular Docking interactions for the newly designed compounds.
| Compounds | Structures of newly designed molecules | PIC50 (pred) | IC50 (pred) | leverage threshold h* | Interactions with EGFRL858R/T790M/C797S protein |
||
|---|---|---|---|---|---|---|---|
| Binding affinity (kcal/mol) | Number of Hydrogen bonds | Amino acid residues with hydrogen bonding (distances) | |||||
| N1 |  |
7.5432 | 0.0286 | 0.8065 | −10.3 | 2 | MET793 (1.81 Å, 2.54 Å) |
| N2 |  |
9.1590 | 0.0007 | 0.3717 | −10.55 | 4 | SER797 (2.35 Å, 2.73 Å) MET793 (1.71 Å) MET790 (2.57 Å) |
| N3 |  |
8.8819 | 0.0013 | 0.3486 | −9.17 | 4 | ASP800 (2.92 Å) SER797 (2.27 Å) MET793 (1.81 Å) LEU718 (2.19 Å) |
| N4 |  |
7.0516 | 0.0887 | 0.4616 | −9.95 | 2 | GLU804 (2.31 Å) SER797 (2.41 Å) |
| N5 |  |
8.6883 | 0.002 | 0.4160 | −9.3 | 3 | SER797 (2.22Å) MET793 (2.04 Å, 2.71 Å) |
| N6 |  |
7.0456 | 0.09 | 0.2360 | −10.69 | 2 | MET790 (2.73 Å) MET793 (1.78 Å) |
| N7 |  |
7.2338 | 0.058 | 0.4589 | −10.57 | 2 | SER797 (2.35 Å) Met793 (1.91 Å) |
| N8 |  |
8.0158 | 0.0096 | 0.1332 | −9.3 | 3 | SER797 (2.38Å) MET793 (2.05 Å, 2.53 Å) |
| N9 |  |
7.5243 | 0.0299 | 0.2335 | −9.2 | 3 | SER797 (1.96 Å) MET793 (2.31 Å, 2.49 Å) |
| N10 |  |
7.3045 | 0.0496 | 0.6577 | −10.38 | 5 | SER797 (2.24 Å, 2.90 Å) MET793 (2.21 Å, 2.16 Å) MET790 (2.37 Å) |
The first step of a reliable prediction is to verify that all predicted new molecules belong to the application domain of the proposed model. The CoMSIA/EHA model has a critical leverage value h* = 0.47, all the designed novel compounds have a threshold leverage value h* lower than the critical leverage value, except for compounds N1 and N10 which could belong to another chemical family, this result shows that N2-N9 compounds were reliably predicted anticancer activity. Using the CoMSIA/EHA model, the compound T2 also showed better activity than all compounds in the data set. Furthermore, we carried out molecular docking for ten new compounds designed with the EGFRL858R/T790M/C797S protein. The results indicate that almost all compounds formed hydrogen bonding interactions with the amino acids at positions 797 and 790 of the protein, both of which play an important role in the therapeutic failure of the anticancer drug. However, the inhibitory activity of compounds N1 and N10 cannot be reliably predicted, but the molecular docking results are encouraging and may lead to a new inhibitor family. Overall, all compounds show a good level of inhibitory activity and can theoretically overcome the problem of drug resistance in lung cancer.
3.6. ADMET prediction
To verify that the designed compounds can become drugs, we use the ADMET pharmacokinetic parameters by the online tool pkCSM [44]. The ADMET parameters of the newly designed compounds are listed in Table 6.
Table 6.
In silico ADMET prediction of newly designed inhibitors.
| Compounds | Absorption |
Distribution |
Metabolism |
Excretion |
Toxicity |
||||||||
|---|---|---|---|---|---|---|---|---|---|---|---|---|---|
| Intestinal absorption (human) |
VDss (human) |
BBB permeability |
CNS permeability |
Substrate |
Inhib itor |
Total Clearance | AMES toxicity | ||||||
| CYP |
|||||||||||||
| 2D6 |
3A4 |
1A2 |
2C19 |
2C9 |
2D6 |
3A4 |
|||||||
| Numeric (% Absorbed) | Numeric (Log L/kg) | Numeric (Log BB) | Numeric (Log PS) | Categorical (Yes/No) | Numeric (Log ml/min/kg) | Categorical (Yes/No) | |||||||
| N1 | 90.063 | 0.556 | −1.608 | −2.823 | No | No | No | Yes | Yes | No | Yes | 0.758 | No |
| N2 | 87.61 | 0.623 | −1.43 | −2.525 | No | Yes | No | Yes | Yes | No | Yes | 0.229 | No |
| N3 | 67.671 | 0.432 | −1.492 | −3.755 | No | No | No | No | Yes | No | Yes | 0.485 | Yes |
| N4 | 78.808 | 0.585 | −1.709 | −2.826 | No | No | No | Yes | Yes | No | Yes | 0.221 | Yes |
| N5 | 82.792 | −0.197 | −1.252 | −2.146 | No | Yes | Yes | Yes | Yes | No | Yes | 0.302 | Yes |
| N6 | 97.823 | −0.039 | −1.485 | −3.391 | No | Yes | No | Yes | Yes | No | Yes | 0.638 | No |
| N7 | 78.764 | 0.036 | −1.775 | −3.944 | No | No | No | No | Yes | No | Yes | 0.149 | Yes |
| N8 | 81.253 | 0.058 | −1.917 | −4.339 | No | No | No | No | Yes | No | Yes | 0.089 | No |
| N9 | 90.08 | 0.063 | −1.697 | −4.004 | No | No | No | No | Yes | No | Yes | 0.328 | No |
| N10 | 94.626 | 0.079 | −1.489 | −3.844 | No | No | No | Yes | Yes | No | Yes | 0.5 | No |
An absorption value of less than 30% is considered poor intestinal absorption, the ten compounds designed showed a value between (67.671% and 97.823%) indicating good intestinal absorption, volume of distribution (VDss) is considered low if logVDss < −0.15 and high if logVDss > 0.45, central nervous system (CNS) and blood-brain barrier (BBB) permeability standard values (>−2 to <−3 LogPS and >0.3 to <−1 Log BB), respectively, for a given compound a LogBB < −1 corresponds to poor distribution to the brain, while LogBB >0.3 are likely to cross the BBB and LogPS >3, to cross the BBB and LogPS > −2 considered to penetrate the CNS, while LogPS < −3 are difficult to move into the CNS [45]. Thus, the compounds N1, N2, N6 and N8-N10 have an excellent potential to cross the barriers.
The enzymatic metabolism refers to the chemical biotransformation of drugs in the human body, which plays a crucial role in the metabolic stability of drugs in the body [46]. The cytochrome P450 enzymes (CYP1A2, CYP3A4, CYP2C19, CYP2D6 and CYP2C9) found in the liver are the main enzymes of drug metabolism, being responsible for the biotransformation of more than 90% of drugs. Inhibition of these metabolising enzymes can increase the concentration of the active drug in the body. In this study, CYP3A4 was the main human enzyme responsible for the metabolism of the third-generation drug for treating NSCLC [47], [48], [49]. The results show that all newly designed compounds appear to be CYP3A4 inhibitors, but only compounds N2, N5 and N6 appear to be CYP3A4 substrates. All newly designed compounds showed a low total clearance value, which means accumulation and persistence of the drugs in the body. Finally, compounds N1, N2, N6 and N8-N10 showed negative toxicity. Overall, the newly designed compounds N1, N2, N6 and N8-N10 exhibit good pharmacokinetic properties. The results of this study may represent excellent drug candidates for the treatment of NSCLC to overcome the L858R/T790M/C797S mutations in EGFR-TKIs. Fig. 9 shows the 2D visualization of the molecular docking results of the best predicted compounds, which were then subjected to a molecular dynamics study
Figure 9.

2D interactions of the best ligands N1, N2, N6 and N8-N10 in the binding sites of EGFRL858R/T790M/C797S protein.
3.7. Molecular dynamic simulation results
After performing molecular docking studies and ADMET properties of the predicted compounds, MD simulation of the best candidates N1, N2, N6 and N8-N10 was carried out, with RMSD and RMSF parameters to analyse the stability of the target protein. The RMSD and RMSF plots of the EGFRL858R/T790M/C797S complex by Osimertinib and with the best predicted compounds are shown in Fig. 10 (a) and (b), respectively.
Figure 10.

a) The RMSD values of the EGFRL858R/T790M/C797S protein in complex with Osimertinib and six best ligands at 100 ns, and b) The RMSF values of the EGFRL858R/T790M/C797S protein residues in complex with Osimertinib and six best.
According to the RMSD plot analysis, all systems experienced a rapid increase in RMSD values from 0.53 Å to 1.2 Å within 40 ns, which is largely due to the initial kinetic shock experienced by all systems in the molecular dynamics studies. Subsequently, the RMSD values of all systems fluctuated within a similar distance range of 1.2 Å and 1.5 Å, indicating that all systems reached stability and equilibrium. The most stable complexation was the experimental crystallographic structure of the EGFRL858R/T790M/C797S protein in combination with the drug Osimertinib (6lud) obtained from the RCSB protein database with an RMSD value of 1.082 Å. Osimertinib serves as the reference ligand in this study. From the RMSD plot, it can be seen that all the proposed ligands have a similar trajectory to the reference ligand with a slight difference, the RMSD values of ligands N1, N2, N6, N8, N9 and N10 complexed with EGFRL858R/T790M/C797S were 1.231 Å, 1.137 Å, 1.173 Å, 1.169 Å, 1.159 Å and 1.251 Å, respectively. All ligands had a value of about 1.3 Å and the N2 ligand had the best stability. A study by Beura et al. [50] showed that an RMSD value of less than 3 Å is an indicator of the conformational stability of protein-ligand complexes. Therefore, the docking results of all predicted ligand complexations with the EGFRL858R/T790M/C797S show higher conformational stability of ligand-receptor complexes.
The RMSF trajectories assess the effect of ligand binding on the flexibility of the protein during the MD simulation, which shows the stability of the protein per residue during the simulation. The higher the RMSF value, the more flexible the residue, while the lower the RMSF value, the more stable the residue. In general, the majority of the residuals have the same RMSF values, with higher fluctuations in the different ranges, such as LYS754 (1.35 Å), LEU782 (1.14 Å), GLY874 (1.20 Å), SER921 (1.12 Å) and GLU1005 (1.11 Å), these residues are not involved as they are located in the inactive regions of the EGFRL858R/T790M/C797S protein. However, crucial residues in the active site such as LEU718, ASP800, GLU804, MET790, MET793, SER797 and ARG858 show smaller RMSF fluctuations of less than 0.4 Å, which could be related to the generation of more hydrogen bonding interactions for greater stability of the ligands with the EGFRL858R/T790M/C797S protein. These results confirm the RMSD analysis that all predicted candidates with the EGFRL858R/T790M/C797S protein show greater conformational stability.
4. Conclusion
In summary, 3D-QSAR, docking, ADMET and MD simulation methods were performed for the design of new drug candidates capable of overcoming drug resistance in third generation NSCLC. In the 3D-QSAR study, the best selected model (CoMSIA/EHA) has high stability and predictive ability, which were assessed using external validation, Y-randomisation test and applicability domain. The CoMSIA/SEHA contour map analyses provided a better understanding of the relationship between structure and activity, which was a progression in guiding the design of new potent compounds. The molecular docking analysis shows the importance of hydrogen bonds established with key residues, which also confirmed the importance of residues such as MET790, MET793 and SER797 for the active site of EGFR protein. Based on the precise recommendation provided by 3D-QSAR and molecular docking analysis, 10 new compounds with considerable activity were designed using the virtual zinc base. The ADMET properties were used to select the best pharmacokinetic profile of the proposed compounds. Finally, MD simulations verified the accuracy of the molecular docking results in terms of reliability and stability, in which essential residues formed hydrogens between the proposed compounds and the EGFR protein. The newly designed compounds N1, N2, N6 and N8-N10 could be good drug candidates to overcome resistance to third generation drugs against NSCLC.
Declarations
Author contribution statement
Hanine Hadni: Conceived and designed the experiments; Analyzed and interpreted the data; Wrote the paper.
Menana Elhallaoui: Contributed reagents, materials, analysis tools or data; Wrote the paper.
Funding statement
This research did not receive any specific grant from funding agencies in the public, commercial, or not-for-profit sectors.
Data availability statement
Data will be made available on request.
Declaration of interests statement
The authors declare no conflict of interest.
Additional information
No additional information is available for this paper.
References
- 1.Sung H., Ferlay J., Siegel R.L., Laversanne M., Soerjomataram I., Jemal A., Bray F. Global cancer statistics 2020: GLOBOCAN estimates of incidence and mortality worldwide for 36 cancers in 185 countries. CA Cancer J. Clin. 2021;71:209–249. doi: 10.3322/caac.21660. [DOI] [PubMed] [Google Scholar]
- 2.https://www.who.int/news-room/fact-sheets/detail/cancer Cancer, (n.d.)
- 3.Seegobin K., Majeed U., Wiest N., Manochakian R., Lou Y., Zhao Y. Immunotherapy in non-small cell lung cancer with actionable mutations other than EGFR. Front. Oncol. 2021;11:5040. doi: 10.3389/fonc.2021.750657. [DOI] [PMC free article] [PubMed] [Google Scholar]
- 4.Ciardiello F., Tortora G. EGFR antagonists in cancer treatment. N. Engl. J. Med. 2008;358:1160–1174. doi: 10.1056/NEJMra0707704. [DOI] [PubMed] [Google Scholar]
- 5.Harandi A., Zaidi A.S., Stocker A.M., Laber D.A. Clinical efficacy and toxicity of anti-EGFR therapy in common cancers. J. Oncol. 2009 doi: 10.1155/2009/567486. [DOI] [PMC free article] [PubMed] [Google Scholar]
- 6.Sharma S.V., Bell D.W., Settleman J., Haber D.A. Epidermal growth factor receptor mutations in lung cancer. Nat. Rev. Cancer. 2007;7:169–181. doi: 10.1038/nrc2088. [DOI] [PubMed] [Google Scholar]
- 7.Solassol I., Pinguet F., Quantin X. FDA- and EMA-approved tyrosine kinase inhibitors in advanced EGFR-mutated non-small cell lung cancer: safety, tolerability, plasma concentration monitoring, and management. Biomolecules. 2019;9:668. doi: 10.3390/biom9110668. [DOI] [PMC free article] [PubMed] [Google Scholar]
- 8.Cohen M.H., Williams G.A., Sridhara R., Chen G., McGuinn W.D., Morse D., Abraham S., Rahman A., Liang C., Lostritto R., Baird A., Pazdur R. United States food and drug administration drug approval summary: gefitinib (ZD1839; Iressa) tablets. Clin. Cancer Res. 2004;10:1212–1218. doi: 10.1158/1078-0432.ccr-03-0564. [DOI] [PubMed] [Google Scholar]
- 9.Gazdar A.F. Activating and resistance mutations of EGFR in non-small-cell lung cancer: role in clinical response to EGFR tyrosine kinase inhibitors. Oncogene. 2009;28(Suppl 1):S24–S31. doi: 10.1038/onc.2009.198. [DOI] [PMC free article] [PubMed] [Google Scholar]
- 10.Tiseo M., Bartolotti M., Gelsomino F., Bordi P. Emerging role of gefitinib in the treatment of non-small-cell lung cancer (NSCLC) Drug Des. Devel. Ther. 2010;4:98. doi: 10.2147/dddt.s6594. [DOI] [PMC free article] [PubMed] [Google Scholar]
- 11.Pao W., Miller V., Zakowski M., Doherty J., Politi K., Sarkaria I., Singh B., Heelan R., Rusch V., Fulton L., Mardis E., Kupfer D., Wilson R., Kris M., Varmus H. EGF receptor gene mutations are common in lung cancers from “never smokers” and are associated with sensitivity of tumors to gefitinib and erlotinib. Proc. Natl. Acad. Sci. 2004;101:13306–13311. doi: 10.1073/pnas.0405220101. [DOI] [PMC free article] [PubMed] [Google Scholar]
- 12.Singh M., Jadhav H.R. Targeting non-small cell lung cancer with small-molecule EGFR tyrosine kinase inhibitors. Drug Discov. Today. 2018;23:745–753. doi: 10.1016/j.drudis.2017.10.004. [DOI] [PubMed] [Google Scholar]
- 13.Westover D., Zugazagoitia J., Cho B.C., Lovly C.M., Paz-Ares L. Mechanisms of acquired resistance to first- and second-generation EGFR tyrosine kinase inhibitors. Ann. Oncol. 2018;29:i10–i19. doi: 10.1093/annonc/mdx703. [DOI] [PMC free article] [PubMed] [Google Scholar]
- 14.Finlay M.R.V., Anderton M., Ashton S., Ballard P., Bethel P.A., Box M.R., Bradbury R.H., Brown S.J., Butterworth S., Campbell A., Chorley C., Colclough N., Cross D.A.E., Currie G.S., Grist M., Hassall L., Hill G.B., James D., James M., Kemmitt P., Klinowska T., Lamont G., Lamont S.G., Martin N., McFarland H.L., Mellor M.J., Orme J.P., Perkins D., Perkins P., Richmond G., Smith P., Ward R.A., Waring M.J., Whittaker D., Wells S., Wrigley G.L. Discovery of a potent and selective EGFR inhibitor (AZD9291) of both sensitizing and T790M resistance mutations that spares the wild type form of the receptor. J. Med. Chem. 2014;57:8249–8267. doi: 10.1021/jm500973a. [DOI] [PubMed] [Google Scholar]
- 15.Chabon J.J., Simmons A.D., Lovejoy A.F., Esfahani M.S., Newman A.M., Haringsma H.J., Kurtz D.M., Stehr H., Scherer F., Karlovich C.A., Harding T.C., Durkin K.A., Otterson G.A., Purcell W.T., Camidge D.R., Goldman J.W., Sequist L.V., Piotrowska Z., Wakelee H.A., Neal J.W., Alizadeh A.A., Diehn M. Circulating tumour DNA profiling reveals heterogeneity of EGFR inhibitor resistance mechanisms in lung cancer patients. Nat. Commun. 2016;7 doi: 10.1038/ncomms11815. [DOI] [PMC free article] [PubMed] [Google Scholar]
- 16.Hadni H., Bakhouch M., Elhallaoui M. 3D-QSAR, molecular docking, DFT and ADMET studies on quinazoline derivatives to explore novel DHFR inhibitors. J. Biomol. Struct. Dyn. 2021:1–15. doi: 10.1080/07391102.2021.2004233. [DOI] [PubMed] [Google Scholar]
- 17.Sarvagalla S., Syed S.B., Coumar M.S. Silico Drug Des. Elsevier; 2019. An overview of computational methods, tools, servers, and databases for drug repurposing; pp. 743–780. [Google Scholar]
- 18.Hadni H., Elhallaoui M. 3D-QSAR, docking and ADMET properties of aurone analogues as antimalarial agents. Heliyon. 2020;6 doi: 10.1016/j.heliyon.2020.e03580. [DOI] [PMC free article] [PubMed] [Google Scholar]
- 19.Lei H., Fan S., Zhang H., Liu Y.J., Hei Y.Y., Zhang J.J., Zheng A.Q., Xin M., Zhang S.Q. Discovery of novel 9-heterocyclyl substituted 9H-purines as L858R/T790M/C797S mutant EGFR tyrosine kinase inhibitors. Eur. J. Med. Chem. 2020;186 doi: 10.1016/j.ejmech.2019.111888. [DOI] [PubMed] [Google Scholar]
- 20.Klebe G., Abraham U., Mietzner T. Molecular similarity indices in a comparative analysis (CoMSIA) of drug molecules to correlate and predict their biological activity. J. Med. Chem. 1994;37:4130–4146. doi: 10.1021/jm00050a010. [DOI] [PubMed] [Google Scholar]
- 21.Mittal R.R., Harris L., McKinnon R.A., Sorich M.J. Partial charge calculation method affects CoMFA QSAR prediction accuracy. J. Chem. Inf. Model. 2009;49:704–709. doi: 10.1021/ci800390m. [DOI] [PubMed] [Google Scholar]
- 22.Powell M.J.D. Restart procedures for the conjugate gradient method. Math. Program. 1977;12:241–254. [Google Scholar]
- 23.Wold S., Ruhe A., Wold H., Dunn W.J., III The collinearity problem in linear regression. The partial least squares (PLS) approach to generalized inverses. SIAM J. Sci. Stat. Comput. 1984;5:735–743. [Google Scholar]
- 24.Roy K. On some aspects of validation of predictive quantitative structure-activity relationship models. Expert Opin. Drug Discov. 2007;2:1567–1577. doi: 10.1517/17460441.2.12.1567. [DOI] [PubMed] [Google Scholar]
- 25.Roy K., Mitra I. On various metrics used for validation of predictive QSAR models with applications in virtual screening and focused library design. Comb. Chem. High Throughput Screen. 2011;14:450–474. doi: 10.2174/138620711795767893. [DOI] [PubMed] [Google Scholar]
- 26.Golbraikh A., Tropsha A. Beware of q2! J. Mol. Graph. Model. 2002;20:269–276. doi: 10.1016/s1093-3263(01)00123-1. [DOI] [PubMed] [Google Scholar]
- 27.Roy K., Kar S., Ambure P. On a simple approach for determining applicability domain of QSAR models. Chemom. Intell. Lab. Syst. 2015;145:22–29. [Google Scholar]
- 28.Netzeva T.I., Worth A.P., Aldenberg T., Benigni R., Cronin M.T.D., Gramatica P., Jaworska J.S., Kahn S., Klopman G., Marchant C.A., Myatt G., Nikolova-Jeliazkova N., Patlewicz G.Y., Perkins R., Roberts D.W., Schultz T.W., Stanton D.T., van de Sandt J.J.M., Tong W., Veith G., Yang C. Current status of methods for defining the applicability domain of (quantitative) structure-activity relationships. Altern. Lab. Anim. 2005;33:155–173. doi: 10.1177/026119290503300209. [DOI] [PubMed] [Google Scholar]
- 29.Kar S., Roy K., Leszczynski J. Applicability domain: a step toward confident predictions and decidability for QSAR modeling. Methods Mol. Biol. 2018;1800:141–169. doi: 10.1007/978-1-4939-7899-1_6. [DOI] [PubMed] [Google Scholar]
- 30.Kashima K., Kawauchi H., Tanimura H., Tachibana Y., Chiba T., Torizawa T., Sakamoto H. CH7233163 overcomes osimertinib-resistant EGFR-Del19/T790M/C797S mutation. Mol. Cancer Ther. 2020;19:2288–2297. doi: 10.1158/1535-7163.MCT-20-0229. [DOI] [PubMed] [Google Scholar]
- 31.D.S. BIOvIA . 2015. Discovery studio modeling environment. San Diego, Dassault Syst. Release, 4. [Google Scholar]
- 32.Morris G.M., Huey R., Lindstrom W., Sanner M.F., Belew R.K., Goodsell D.S., Olson A.J. AutoDock4 and AutoDockTools4: automated docking with selective receptor flexibility. J. Comput. Chem. 2009;30:2785–2791. doi: 10.1002/jcc.21256. [DOI] [PMC free article] [PubMed] [Google Scholar]
- 33.Morris G.M., Goodsell D.S., Halliday R.S., Huey R., Hart W.E., Belew R.K., Olson A.J. AutoDock-related material automated docking using a Lamarckian genetic algorithm and an empirical binding free energy function. J. Comput. Chem. 1998;19:1639–1662. [Google Scholar]
- 34.Onodera K., Satou K., Hirota H. Evaluations of molecular docking programs for virtual screening. J. Chem. Inf. Model. 2007;47:1609–1618. doi: 10.1021/ci7000378. [DOI] [PubMed] [Google Scholar]
- 35.Warren G.L., Andrews C.W., Capelli A.-M., Clarke B., LaLonde J., Lambert M.H., Lindvall M., Nevins N., Semus S.F., Senger S., Tedesco G., Wall I.D., Woolven J.M., Peishoff C.E., Head M.S. A critical assessment of docking programs and scoring functions. J. Med. Chem. 2006;49:5912–5931. doi: 10.1021/jm050362n. [DOI] [PubMed] [Google Scholar]
- 36.Hadni Hanine, Elhallaoui Menana. 2D and 3D-QSAR, molecular docking and ADMET properties in silico studies of azaaurones as antimalarial agents. New J. Chem. 2020 doi: 10.1016/j.heliyon.2020.e03580. [DOI] [PMC free article] [PubMed] [Google Scholar]
- 37.Ferreira L.L.G., Andricopulo A.D. ADMET modeling approaches in drug discovery. Drug Discov. Today. 2019;24:1157–1165. doi: 10.1016/j.drudis.2019.03.015. [DOI] [PubMed] [Google Scholar]
- 38.Jia C.Y., Li J.Y., Hao G.F., Yang G.F. A drug-likeness toolbox facilitates ADMET study in drug discovery. Drug Discov. Today. 2020;25:248–258. doi: 10.1016/j.drudis.2019.10.014. [DOI] [PubMed] [Google Scholar]
- 39.Phillips J.C., Braun R., Wang W., Gumbart J., Tajkhorshid E., Villa E., Chipot C., Skeel R.D., Kalé L., Schulten K. Scalable molecular dynamics with NAMD. J. Comput. Chem. 2005;26:1781–1802. doi: 10.1002/jcc.20289. [DOI] [PMC free article] [PubMed] [Google Scholar]
- 40.Jo S., Kim T., Iyer V.G., Im W. CHARMM-GUI: a web-based graphical user interface for CHARMM. J. Comput. Chem. 2008;29:1859–1865. doi: 10.1002/jcc.20945. [DOI] [PubMed] [Google Scholar]
- 41.Im W., Seefeld S., Roux B. A grand canonical Monte Carlo–Brownian dynamics algorithm for simulating ion channels. Biophys. J. 2000;79:788–801. doi: 10.1016/S0006-3495(00)76336-3. [DOI] [PMC free article] [PubMed] [Google Scholar]
- 42.Hadni H., Fitri A., Benjelloun A.T., Benzakour M., Mcharfi M. Evaluation of flavonoids as potential inhibitors of the SARS-CoV-2 main protease and spike RBD: molecular docking, ADMET evaluation and molecular dynamics simulations. J. Indian Chem. Soc. 2022;99 [Google Scholar]
- 43.Humphrey W., Dalke A., Schulten K. VMD: visual molecular dynamics. J. Mol. Graph. 1996;14:33–38. doi: 10.1016/0263-7855(96)00018-5. [DOI] [PubMed] [Google Scholar]
- 44.Pires D.E.V., Blundell T.L., Ascher D.B. pkCSM: predicting small-molecule pharmacokinetic and toxicity properties using graph-based signatures. J. Med. Chem. 2015;58:4066–4072. doi: 10.1021/acs.jmedchem.5b00104. [DOI] [PMC free article] [PubMed] [Google Scholar]
- 45.Clark D.E. In silico prediction of blood–brain barrier permeation. Drug Discov. Today. 2003;8:927–933. doi: 10.1016/s1359-6446(03)02827-7. [DOI] [PubMed] [Google Scholar]
- 46.Kok-Yong S., Lawrence L. Basic Pharmacokinet. Concepts Some Clin. Appl. InTech; 2015. Drug distribution and drug elimination. [Google Scholar]
- 47.Duckett D.R., Cameron M.D. Metabolism considerations for kinase inhibitors in cancer treatment. Expert Opin. Drug Metab. Toxicol. 2010;6:1193. doi: 10.1517/17425255.2010.506873. [DOI] [PMC free article] [PubMed] [Google Scholar]
- 48.Bollinger M.K., Agnew A.S., Mascara G.P. Osimertinib: a third-generation tyrosine kinase inhibitor for treatment of epidermal growth factor receptor-mutated non-small cell lung cancer with the acquired Thr790Met mutation. J. Oncol. Pharm. Pract. 2018;24:379–388. doi: 10.1177/1078155217712401. [DOI] [PubMed] [Google Scholar]
- 49.Kenneth MacLeod A., Lin D., Huang J.T.J., McLaughlin L.A., Henderson C.J., Wolf C. Roland. Identification of novel pathways of osimertinib disposition and potential implications for the outcome of lung cancer therapy. Clin. Cancer Res. 2018;24:2138–2147. doi: 10.1158/1078-0432.CCR-17-3555. [DOI] [PubMed] [Google Scholar]
- 50.Beura S., Chetti P. In-silico strategies for probing chloroquine based inhibitors against SARS-CoV-2. J. Biomol. Struct. Dyn. 2021;39:3747–3759. doi: 10.1080/07391102.2020.1772111. [DOI] [PMC free article] [PubMed] [Google Scholar]
Associated Data
This section collects any data citations, data availability statements, or supplementary materials included in this article.
Data Availability Statement
Data will be made available on request.