

Summary
Point mutations and structural variants that directly disrupt the coding sequence of MEF2C have been associated with a spectrum of neurodevelopmental disorders (NDDs). However, the impact of MEF2C haploinsufficiency on neurodevelopmental pathways and synaptic processes is not well understood, nor are the complex mechanisms that govern its regulation. To explore the functional changes associated with structural variants that alter MEF2C expression and/or regulation, we generated an allelic series of 204 isogenic human induced pluripotent stem cell (hiPSC)-derived neural stem cells and glutamatergic induced neurons. These neuronal models harbored CRISPR-engineered mutations that involved direct deletion of MEF2C or deletion of the boundary points for topologically associating domains (TADs) and chromatin loops encompassing MEF2C. Systematic profiling of mutation-specific alterations, contrasted to unedited controls that were exposed to the same guide RNAs for each edit, revealed that deletion of MEF2C caused differential expression of genes associated with neurodevelopmental pathways and synaptic function. We also discovered significant reduction in synaptic activity measured by multielectrode arrays (MEAs) in neuronal cells. By contrast, we observed robust buffering against MEF2C regulatory disruption following deletion of a distal 5q14.3 TAD and loop boundary, whereas homozygous loss of a proximal loop boundary resulted in down-regulation of MEF2C expression and reduced electrophysiological activity on MEA that was comparable to direct gene disruption. Collectively, these studies highlight the considerable functional impact of MEF2C deletion in neuronal cells and systematically characterize the complex interactions that challenge a priori predictions of regulatory consequences from structural variants that disrupt three-dimensional genome organization.
Keywords: neurodevelopmental disorders, topological associating domain, TAD, MEF2C, chromatin, CRISPR, transcriptional regulation, genomics, iPSC, induced neurons
Graphical abstract
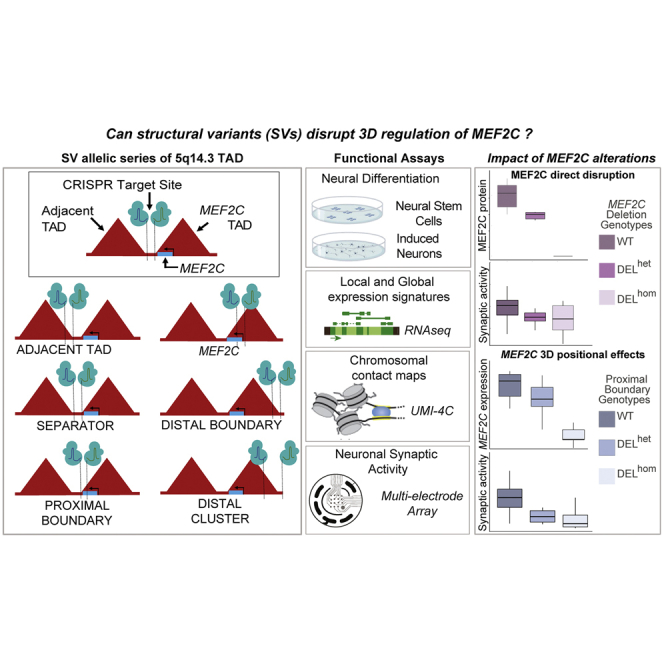
The authors present functional characterization of a CRISPR-engineered allelic series of deletions altering MEF2C and the 3D regulatory architecture encompassing the 5q14.3 microdeletion syndrome region. They find that direct deletion of MEF2C and some, but not all, 3D regulatory interactions result in shared transcriptional and electrophysiological deficits in early neurodevelopment.
Introduction
Over the last decade, genetic studies have established haploinsufficiency of MEF2C (MIM: 600662) as a cause of neurodevelopmental disorders (NDDs).1 Microarray and sequencing studies have repeatedly implicated loss-of-function (LoF) mutations in MEF2C etiological factors across numerous syndromic and isolated NDD phenotypes.2,3,4,5,6,7 To date, these mutational mechanisms have included protein-truncating variants (PTVs), structural variants (SVs) involving deletions and balanced chromosomal abnormalities (BCAs), and broader microdeletion of the 5q14.3 locus.2,8,9,10 Mouse models with conditionally modulated Mef2c expression1,3,4,5,11,12 in neural tissue also display fundamentally altered brain development and neuronal activity.13,14,15,16,17 The extensive complementary data from human affected individuals and mouse models suggests that MEF2C LoF mutations underlie aberrant neurodevelopment with varied consequences that include developmental delay, intellectual disability, autism spectrum disorder (ASD), hypotonia, and epilepsy.1,6,11,18,19,20,21,22 To date, the mechanisms associated with haploinsufficiency of MEF2C that contribute to these phenotypic presentations have not been explored in human neuronal models, which can provide insights into signatures of MEF2C-specific changes as well as evidence of transcriptional or functional convergence across NDDs.
In contrast to the abundant molecular studies of direct gene disruption in NDDs, functional interpretation of noncoding variation remains a considerable challenge.23,24 Multiple recent studies have described highly penetrant noncoding mutations across rare NDDs and Mendelian disorders,25,26,27 and one emerging mutational mechanism not captured by exome and genome sequencing is regulatory changes associated with three-dimensional (3D) genome reorganization.28,29,30 Early glimpses into the intricacies of 3D genome architecture demonstrated the partitioning of chromatin into topologically associating domains (TADs) and the smaller loops within them. It is presently understood that TADs demarcate neighborhoods of long-range regulatory interaction, while loops facilitate punctate enhancer and promoter connections.31,32 Some prior studies have discovered pathogenic consequences from positional effects through the disruption of TADs and loops,31,33,34,35 while others suggest an uncoupling of topological rewiring and gene expression.29,32,36,37 These studies collectively underscore the complexity of long-range regulatory mechanisms and suggest that functional alterations associated with structural variants of 3D organization are likely to be context specific and require extensive experimental modeling to dissect the diverse regulatory mechanisms of individual loci.
We previously demonstrated through whole-genome sequencing of NDD cases that chromosome 5q14.3 harbored an unusual and genome-wide significant excess of noncoding BCA breakpoints that did not directly disrupt MEF2C but that all occurred within the TAD boundaries encompassing MEF2C.38 This distribution of breakpoints in proximity to MEF2C was further supported by microdeletions in NDD cases reported in DECIPHER that apparently did not directly alter the locus (at the available resolution of chromosomal microarray).39 In considering the landscape of de novo SVs across the 5q14.3 locus in NDD cases, the unifying thread appears to be recurrent distal boundary disruption. Taken together, these data suggest that direct disruption of MEF2C and alterations to its 3D regulatory architecture may result in comparable molecular mechanisms in NDD cases. Motivated by these findings, we performed a systematic molecular dissection of the 5q14.3 locus to quantify the transcriptomic and electrophysiological effects of MEF2C LoF in human neural derivatives. Through the generation of an allelic series of CRISPR-engineered human induced pluripotent stem cell (hiPSC)-derived neural stem cells (NSCs) and glutamatergic induced neurons (iNs), we interrogated the impact of enhancer, TAD boundary, and loop boundary deletion on local genome organization, local expression effects on MEF2C, and global transcriptional signatures. Our analyses revealed that direct MEF2C alteration results in both transcriptional and functional changes to the synapse. These studies further revealed that disruption of the distal boundary of the MEF2C-containing loop was insufficient to produce indirect dysregulation of MEF2C expression, whereas disruption of the proximal boundary of the same 3D structure resulted in reduced expression of MEF2C with functional consequences that were comparable to direct gene deletion. Overall, these data suggest that the effects of direct and indirect disruption of MEF2C contributes to cell-type-specific alterations on neuronal functions that converge on synaptic deficits in neurodevelopment.
Material and methods
hiPSC culture
All studies involved secondary use of publicly available cell lines and/or data and were approved by the Institutional Review Board of Mass General Brigham. The GM08330 hiPSCs were grown in feeder-free culture via Matrigel with Essential 8 media. Cells were passaged with ReLeS. mFreSR was used for cryopreservation. Y-27632 dihydrochloride was added to media at 1 mg/mL for up to 24 h for initial plating and at various points in the engineering protocol as indicated below.
In silico CRISPR guide selection
Dual guides were designed with multiple considerations to maximize on-target cutting efficiency for deletion generation while minimizing both off-target effects. Guides with NGG PAM for Cas9 were identified with the MIT CRISPR design tool.40 Off-target characterization was conducted per guide with Off-Spotter.41 We restricted to guides without identified coding, long noncoding RNAs (lncRNAs), ribosomal RNA (rRNA), or transfer RNA (tRNA) off-target hits with ≤4 mismatches between the guide and the off-target position (Table S1).
CRISPR-Cas9 transfection
To generate CRISPR-edited lines, hiPSCs were transiently transfected with breakpoint targeting guides and SpCas9 ribonuclear protein as ribonuclear proteins (RNP). Alt-R SpCas9 Nuclease was diluted to 25 μM in 20 mM HEPES Buffer and 150 mM KCl. We diluted custom designed Alt-R CRISPR RNAs (crRNAs; IDT) and Alt-R trans-activating CRISPR RNA (tracrRNA; IDT, 1072532) to 25 μM and annealed them by using manufacturer recommendations to create crRNA::tracrRNA duplexes. We generated single-cell hiPSC suspension of Y-27632 dihydrochloride-treated cells by using and filtering them through a 40 μM mesh (1 μg), and we combined annealed guides (37.5 μM total) with 1 μg pmaxGFP plasmid and nucleofected them into hiPSCs (5 × 10⁵ cells per transfection). Nucleofections were conducted with an Amaxa Nucleofector II, program A-033, with Human Stem Cell Nucleofector Kit 1 following manufacturer’s instructions. Nucleofected cells were plated onto Matrigel-coated 12-well plates and maintained in E8 media supplemented with Y-27632 dihydrochloride at 1 mg/mL for 24 h. Cell-containing wells were replenished with E8 media daily with subsequent fluorescence-activated cell sorting (FACS) 36–48 h after transfection. The transfected cells were FACS sorted and consolidated for clonal isolates.
Genotyping was conducted with custom designed PCR primers (IDT) with Taq polymerase. PCR products were run on 2% Agarose 96-well E-Gels for visualization. Positive products were cleaned up with ExoSAP-IT and submitted for Sanger sequencing (Table S2). As an orthogonal method of genotyping and for confirmation of clonality, edited lines and a subset of wild-type lines identified by Sanger were also genotyped with droplet digital PCR (ddPCR) with DNA copy number probes. When possible, we required six independent clonal lines per genotype at each target locus in the interest of maximizing the number of biological replicates in each experiment. We were unable to generate homozygous deletions for some target regions, and in some instances when CRISPR editing did not yield the desired number of independent clonal replicates, we split single lines in two to differentiate six lines per genotype and capture technical variation attributable to differentiation as outlined in Table S7.
Selection of TRA-1-60-positive hiPSC CRISPR lines
3–5 passages following FACS, hiPSC lines selected for differentiation underwent magnetic-activated cell sorting (MACS) for expression of the TRA-1-60 cell surface marker to select pluripotent cells for differentiation. Cells were separated with MiniMACS Separator with Anti-TRA-1-60 microbeads following manufacturer instructions (∼2 × 10⁶ cells per line). TRA-1-60-positive cells were plated with Y-27632 dihydrochloride (1 mg/mL), expanded, and cryopreserved with mFreSR. Cells within three passages of TRA-1-60 selection were used for differentiation.
Differentiation of hiPSCs into iNs
All cell preparations for lentiviral transduction and subsequent iN differentiation were conducted in parallel in a single batch for all lines representing a given locus. To minimize technical artifacts, TRA-1-60 positive hiPSCs were plated as single cells at 80% confluence on a Matrigel-coated 6-well plate with Y-27632 dihydrochloride (1 mg/mL). Polybrene was added at 8 mg/mL 1 h after re-plating. Cells were incubated with polybrene for 10–15 min prior to the addition of lentivirus. Lentiviral constructs for directed differentiation of hiPSCs into iNs were made as described previously.42
Differentiation of hiPSCs into neural stem cells
We conducted all preparations for NSC differentiation with all lines for a given locus in the same batch to minimize technical artifacts. 12–18 lines per batch were differentiated, depending on the locus. TRA-1-60-positive lines were differentiated into NSCs with the protocol detailed by Thermo Fisher (MAN0008031). For all target regions, passage 7 (P7) stage NSCs were harvested for RNA extraction, conformation capture crosslinking, or fixation for staining, as described below.
RNA extraction
iNs were harvested on day 24 of differentiation, 5 × 10⁵ cells per 1 mL TRIzol Reagent. NSCs were harvested at the completion of differentiation at P7. Media was aspirated completely from cells with subsequent direct addition of TRIzol Reagent. We had TRIzol-extracted RNA from iNs undergo subsequent RNeasy cleanup with on-column digest to ensure removal of residual DNA that we often observe carrying over in phenol-chloroform-extracted RNA from this cell type. RNA concentration and quality was assessed by TapeStation with RNA integrity number (RIN) ≥ 8 required for downstream use for RNA sequencing (RNA-seq) or qPCR.
RNA-seq library preparation
RNA-seq libraries were prepared by the Genomic and Technology Core (GTC) of Massachusetts General Hospital (MGH) with TruSeq Stranded mRNA Library Kit and prepared according to manufacturer’s instructions. In brief, RNA sample quality (based on RIN) and quantity was determined on the basis of TapeStation, and between 100 and 500 ng of total RNA was used to prepare libraries. PolyA bead capture was used to enrich for mRNA, followed by stranded reverse transcription and chemical shearing to make appropriate stranded cDNA inserts for library construction. Libraries are finished by adding sample-specific, dual-barcoded adapters for Illumina sequencing followed by 15 rounds of PCR amplification. Final concentration and size distribution of libraries were evaluated by TapeStation and qPCR with Library Quantification Kit. Libraries were sequenced on an Illumina NovaSeq to an average depth of 30 M paired-end (PE, 60 M total) 150 base-pair (bp) reads.
RNA-seq data processing
We used FastQC to determine the data quality of the sequencing data. The read pairs were then aligned to the human reference genome (GRCh37, Ensembl release 75, v = 47) by STAR 2.5.343 with the following parameters “--outFilterMultimapNmax 1 --outFilterMismatchNoverLmax 0.1 --alignEndsType local.” We also used STAR aligner to quantify gene-level read counts on the basis of gene annotations inhuman reference genome (GRCh37, Ensembl release 75). Picard (http://broadinstitute.github.io/picard/) and RNAseqQC44 were used for quality control of the data. Samples with less than 20 M estimated library size as annotated by Picard were removed. We tested a set of neuronal marker genes to confirm the cellular stage of the cell cultures. Samples with failed quality control (QC) were removed from subsequent analyses. Genes with 0.5 counts per million (CPM) cut-off in 50% of samples in at least one condition in a particular comparison were analyzed in differential expression and correlation analyses.
Differential gene expression
Differential expression (DE) analysis was performed with R package DESeq2 version 1.16.1.45 DE was performed within each cell and edit type and edited samples (heterozygous [DELhet] and homozygous [DELhom]) were compared to corresponding wild-type (WT) samples. To account for unknown sources of variation in the expression data, surrogate variables (SVs) were estimated with surrogate variable analysis (SVAseq)46 package with ∼ genotype as full model and ∼1 as reduced model. We incorporated the estimated SVs into the DESeq2 model as ∼ genotype + SVs to identify differentially expressed genes (DEGs) on the basis of the Wald test and corrected p values for multiple testing by using Benjamini-Hochberg-adjusted p values (false discovery rate; FDR). The significant DEGs were identified at FDR < 0.1.
Co-expression analysis
We performed co-expression network analysis by using R package weighted gene co-expression network analysis (WGCNA)47 for each cell type separately with the signed network type for which we used log-transformed CPM-filtered and SVA-corrected counts. Soft power was selected such that the scale-free topology fit R2 > 0.8. and the smallest module size was set to 50. Merge of the modules with similar eigengene profiles was performed (similarity > 70%). Module membership for each gene was re-evaluated on the basis of the module membership p value; genes with p value > 0.01 were marked as unassigned (module 0).
Functional enrichment analysis
We tested enrichments of DEGs and co-expression module genes by using one-tailed Fisher’s exact test for the curated lists of Gene Ontology terms, canonical pathways, Human Phenotype Ontology terms, and transcription factor targets from mSigDB (v7.4)48,49 and phenotype-informed literature data including gene sets and modules previously published with functional associations with neurological phenotype, synaptic activity, and MEF2C function. These gene sets are mouse model RNA-seq DEG validation;50 Synaptic genes: Syngo v1.1;51 MEF2C targets: ENCODE LCLs ChIP-seq;52 DNA-binding and transcription modules;53 synaptic activity modules;53 and neuroepithelial precursor and neuron expression modules.54 The resulting p values were corrected for multiple tests with Benjamini-Hochberg correction. The protein-protein interactions (PPIs) network was generated and annotated for functional association with stringApp55 in Cytoscape.
ATAC-seq sample and library preparation from WT iNs and NSCs
ATAC-seq was applied to WT NSC clones (n = 6) and WT iN clones (n = 6), and cell lines were independently differentiated for each cell type as described above. ATAC-seq was performed as previously described with minor modifications (details in supplemental methods).56 The size-selected libraries were run on the Agilent TapeStation tape to determine fragment size profile. Libraries were multiplexed, pooled, and sequenced on an Illumina NovaSeq, generating an average depth of 100 M PE 150 bp reads.
ATAC-seq peak calling from WT NSCs and iNs
ATAC-seq peak calling followed ENCODE guidance.52 The paired-end reads were aligned to the human reference genome GRCh38 with Bowtie2 version 2.3.1,57 allowing up to four multiple maps. Alignments were first de-duplicated and the coordinates were adjusted according to TN5 transposase cut. Pseudo-replicates are pooled replicates were generated. Narrow peaks were called by MACS2 version 2.2.7.1,58 with shift size of 75, smooth window size of 150, and p value < 0.01. Only the top 300,000 peaks were kept for the downstream analyses. We then used the IDR package59 to cross validate samples and generate conservative and optimal peaks. The genomic coordinates of peak regions were then transferred to the coordinates against GRCh37 with the UCSC tool LiftOver.60 It is worth noting that all peak regions were successfully transferred to GRCh37 with the same peak length.
Multi-electrode array analysis
48-well multi-electrode array (MEA) plates (Axion Biosystems) were prepared by coating wells with 50 μL 0.1% polyethylenimine (PEI) dissolved in Borate Buffer and sterile filtered with a 0.2 μm filter prior to use. Coated wells were incubated at 37°C for 1 h, followed by a wash to remove PEI and left on room temperature (RT) overnight to dry out. To prepare iNs for electrophysiology readings, we largely followed manufacturer protocol with a few modifications. Briefly, TRA1+ hiPSC lines underwent one post-thaw passage prior to further manipulation. All hiPSC lines for MEA underwent Ngn2 transduction as a single batch to eliminate viral transduction batch effect with the same transduction and selection steps described in “differentiation of hiPSCs into iNs” above. The neurons (27–60 days) continued to undergo half media change every 3 days, but media was changed to BrainPhys to promote spiking activity on the basis of the manufacturer protocol (Axion Biosystems protocol: Culturing Human hiPSC-derived Excitatory Neurons on Microelectrode Arrays: Maestro Pro MEA). MEA plate readings were conducted every 3 days, 18–24 h following each media change. Readings were conducted at 37°C with 0% CO2 for 15 min with an Axion Biosystems Maestro Pro. Manufacturer-set thresholds for spike and network burst calling were used.
UMI-4C sample preparation, library preparation, and sequencing
We performed UMI-4C according to the protocol by Schwartzman et al.61 In brief, cells were detached with Accutase, neutralized with PBS and pelleted, resuspended in a PBS/10% FBS solution, and crosslinked using formaldehyde. After centrifugation, pellets were washed, snap-frozen in liquid nitrogen, and stored at −80°C until further processing.
Frozen pellets were resuspended in a 500 μL pre-diluted DpnII buffer, 15 μL pre-heated 10% SDS and incubated on a thermomixer for 1 h at 37°C, shaking at 900 RPM. After adding 150 μL 10% Triton X-100, the solution was incubated again (1 h, 37°C, 900 RPM). We digested the chromatin by using 600 U in three stages (200 U for 2 h, 200 U overnight, 200 U for 2 h) at 37°C and 900 RPM. We incubated the solution at 65°C for 20 min to inactivate the restriction enzyme and put it on ice. Next, we ligated the chromatin by adding 4,000 U of T4 DNA and 10× T4 DNA ligase buffer to a total volume of 1,300 μL and incubating the solution overnight at 16°C and 300 RPM. Ligated chromatin was de-crosslinked by incubation with 8 μL proteinase K (20 mg/mL) (overnight, 65°C, 300 RPM). A 3C template was then purified with 1× Ampure XP beads. Up to 4 μg 3C template per sample was sheared with Covaris to an average fragment length of 300 bp. UMI-4C sequencing libraries were generated with the NEBNext Ultra II library prep kit. For each sample, library included a size selection targeting fragments with a length of 300–400 bp and 4–8 cycles of PCR enrichment. Next, we performed two nested PCR reactions to enrich for fragments captured by the viewpoint of interest, both by using 2 μL 10 mM Illumina enrichment primer 2 and either a viewpoint-specific “upstream” (reaction 1, 2 μL 10 mM) or “downstream” (reaction 2, 2 μL 10 mM) primer. For each sample, we performed up to eight nested PCR reactions in parallel. Between PCR reactions, the product was cleaned up with 1× AmpureXP beads and eluted in 21 μL. The final PCR product was cleaned up with 0.7× AmpureXP beads and eluted in 25 μL. Reactions per sample were pooled and library concentration was quantified via qPCR with the KAPA SYBR FAST qPCR Master Mix. UMI-4C libraries were pooled and sequenced on an Illumina HiSeq or NovaSeq (paired-end, 2 × 150 cycles).
UMI-4C data processing—Delta map generation
Reads were mapped to the GRCh37 human reference genome and filtered on the basis of the presence of the downstream primer sequence (20% mismatch allowed). We used two primer sequences/viewpoints within the MEF2C promoter to capture the phasing SNP (details in supplemental methods). We split the sequenced fastq files on the basis of the presence of this SNP and analyzed them separately, and we used them as input to the UMI-4C R package62 to generate genomic interaction tracks representing UMI counts (i.e., unique interactions) per genomic restriction fragment. We then used the package to generate smoothed, viewpoint-specific interaction profiles for the region of interest. For each profile, interaction counts were normalized to the total UMI count within the profile and the adaptive smoothing parameter (win_cov) was scaled to this statistic as well (with a minimum of 10 and maximum of 180).
UMI-4C data processing—FDR-corrected differential contact annotation
Differential contacts were investigated within chr5: 86,750,000–90,25,0000. A sliding window with size of 5,000 bp and step of 200 bp were applied to this region, which quantified the 4C signals in the sub-regions from each contact track. Generalized linear regression was fit under a negative binomial (NB) distribution with DESeq2 v1.24.0,45 and Wald test was applied to examine whether there was a significant difference between WT samples and each type of CRISPR samples. The subregions with FDR < 0.1 were considered as significantly differential contacts (details in supplemental methods).
Results
Haploinsufficiency of MEF2C is associated with altered expression of highly constrained genes in NSCs and synaptic genes in iNs
There is strong evidence for association between microdeletions and LoF point mutations that disrupt MEF2C and a spectrum of NDDs. We therefore first sought to determine the transcriptional changes in early neuronal development stem cells and fully differentiated neurons caused by direct disruption of MEF2C. We generated targeted DELhet and DELhom deletions of MEF2C in hiPSCs by using dual-guide CRISPR-Cas9 genome editing. Following single-cell isolation and screening, we retained both edited clones and matched controls, clones that were exposed to all experimental conditions but did not demonstrate evidence of on-target editing. Six replicates per genotype then underwent differentiation to NSCs and iNs for transcriptional profiling with RNA-seq (Figure 1A). MEF2C protein accumulation was confirmed to be commensurate with zygosity via immunoblot quantification (supplemental methods, section 1; Figures S1–S4).
Figure 1.

MEF2C deletion results in differential expression of genes enriched for neurodevelopmental and synaptic processes
(A) Schematic representation of MEF2C transcripts and location of CRISPR guide RNAs that introduced two independent deletions (type I and type II) into human induced pluripotent stem cells (hiPSCs). Fluorescence-activated cell sorting (FACS) was performed, followed by screening of individual clones that identified both heterozygous (DELhet) and homozygous (DELhom) deletions of MEF2C and unedited wild-type (WT) clones that were exposed to identical CRISPR targeting. Neural differentiation was then conducted followed by RNA-seq. CRISPR deletion breakpoints of MEF2C are shown relative to transcripts with >1TPM expression in ≥1 GTEx tissue. Arrows represent positions of canonical transcription start sites of MEF2C.
(B) Differentially expressed genes (DEGs) per cell type and genotype.
(C) DEG concordance analysis by cell type and genotype group with statistical significance (p value) of shared directionality calculated with Fisher’s exact test.
(D) DEG enrichment for gene sets and modules associated with neurological phenotypes, synaptic activity, and MEF2C function in prior studies. Mouse model RNA-seq DEG validation from Harrington et al.;50 biological processes gene sets and TF-binding motif gene sets from GSEA msigDB;48,63 synaptic genes from Syngo v1.1;51MEF2C targets from ENCODE project (ChIPseq in Epstein-Barr virus [EBV]-transformed lymphoblastoid B-cell lines [LCLs]);52 LoF-constrained genes from gnomAD;64 genes associated with neurodevelopmental disorders (NDDs) from analyses in Fu et al.;22 DNA-binding and transcription modules and synaptic activity modules from Parikshak et al.53 (‡); neuroepithelial precursor and neuron expression modules (§) from Li et al.54
We performed differential expression analysis by using DESeq2 and SVAseq to account for unknown sources of variation in expression data. In this analysis, differentially expressed genes (DEGs) were selected at Benjamini-Hochberg-corrected p values (FDR) < 0.1. In NSCs, we observed a strong zygosity-dependent transcriptional response to MEF2C disruption with 371 and 2,196 DEGs in DELhet and DELhom, respectively (Figure 1B). By contrast, in iNs we observed 742 DEGs following DELhet that were notable for a predominance of upregulated genes and 292 DEGs in DELhom cells. Nonetheless, we found highly significant overlap and directionally concordant DEGs between DELhet and DELhom genotypes in both NSCs (p = 1.31 × 10−39) and iNs (p = 3.69 × 10−36) (Figure 1C).
Gene set enrichment analysis highlighted differential molecular consequences to MEF2C deletion in NSCs and iNs. Haploinsufficiency of MEF2C in NSCs led to dysregulation of genes involved in developmental processes including developmental pattern specification, organ morphogenesis, neurogenesis, and neuron differentiation (Figure 1D). Additionally, DEGs resulting from homozygous loss of MEF2C in NSCs were enriched for LoF-constrained genes and gene sets associated with NDDs from exome sequencing.22 These LoF and NDD-associated genes are heavily weighted toward genes that display high levels of expression during early neurodevelopment and experience strong negative selection against gene disruptive mutations (Figure 1D). In contrast to NSCs, DEGs identified in iNs were significantly enriched for DEGs observed in forebrain excitatory neurons of an Mef2c knockout mouse model published by Harrington et al.50 (Figure 1D). Additionally, DEGs observed in DELhet iNs were enriched for functional terms such as neurogenesis and neuronal differentiation. Homozygous loss of MEF2C in iNs also yielded DEGs that were enriched for synaptic genes (Figure 1D). When comparing these results to data from the BrainSpan project,53 which identified neural-activity-defining gene co-expression modules with 146 samples from 21 fetal to infant developing brains, iN DEGs were enriched for BrainSpan modules associated with synaptic transmission, synaptic maturation, and genes defined as MEF2C-binding targets53 (modules M13 and M17; Figure 1D). These findings replicated with co-expression modules from a more recent and larger study of 1,230 samples from 48 brains in psychENCODE.54 We observed the module from Li et al.54 (ME37), which includes MEF2C, was enriched for DEGs from DELhet iNs (Figure 1D). This module from the psychENCODE study demonstrated expression patterns associated with neuron development and was enriched for genes that converged on associations with neurodevelopmental and neuropsychiatric disorders.
Overall, the biological pathways and processes shared across DEGs from NSCs and iNs were strongly enriched for neuronal terms including neurogenesis, neuron differentiation, and regulation of cell differentiation and specifically neuron differentiation (FDR < 0.1). Intriguingly, we also observed that DEGs identified in both NSCs and iNs were enriched for AACTTT- and FOXJ2-binding motifs (FDR < 0.1). The AACTTT-binding motif has previously been associated with the promoter of MEF2C and enriched at the promoters of genes involved in neurodevelopment and muscle development.65,66 The FOXJ2-binding motif has similarly been shown to recruit transcriptional activators that function in early developmental stages.67 Taken together, these data suggest that the expression signatures associated with LoF mutations of MEF2C are consistent with perturbations to highly constrained genes broadly involved in transcriptional regulation during early neural development as well as genes that display distinct expression patterns in later developmental time points and impact neuronal communication and synaptic functions.
Altered co-expression of genes in neurodevelopmental and synaptic pathways associated with deletion of MEF2C
We next established modules of co-expressed genes in NSCs and iNs by using WGCNA (Figure 2). In NSCs, four co-expression modules had an eigengene that correlated significantly with MEF2C dosage: violet (p = 2.4 × 10⁻⁷), bisque4 (p = 1.4 × 10⁻⁶), yellow4 (p = 2.1 × 10⁻⁴), and darkslateblue (p = 2.9 × 10⁻⁵) (Figures 2A, 2B, and 2E). Yellow4 genes, which showed increased expression with MEF2C loss, were notably enriched for processes of heart morphogenesis13,68,69,70 and RHO GTPase activation71 (FDR < 0.1), both of which have been described previously in relation to MEF2C function. Furthermore, we also considered co-expression modules with an eigengene that correlated with DELhet MEF2C loss alone. Module navajowhite2 (p = 5.30 × 10⁻¹) contained genes significantly up-regulated only in DELhet NSCs and was enriched for terms related to synapse assembly and organization.
Figure 2.

Co-expression modules enriched for constrained genes and synaptic activity are correlated with MEF2C disruption in neuronal cells
(A–F) Dendrogram displaying all modules identified from weighted gene co-expression network analysis (WGCNA). Modules demonstrating statistically significant correlation with MEF2C genotype (i.e., allelic dosage) are bolded for neural stem cells (NSCs; A) and glutamatergic induced neurons (iNs; C), respectively, with p value of correlation significance indicated by color shade. Boxplots demonstrating each eigengene’s coefficient of correlation per genotype per co-expression module, and corresponding heatmaps, shown for NSCs (B) and iNs (D). (E) Associated terms with significant enrichment per highlighted module. (F) The PPI network of highly connected genes (n = 76) of the magenta module with functional annotations. The node colors indicate the functional classes for each protein and the edge represents interaction.
Co-expression analysis in iNs isolated two modules whose eigengenes significantly correlated with MEF2C dosage, lightcyan1 (p = 1.5 × 10⁻⁷) and magenta (p = 1.9 × 10⁻³), and one module, turquoise, with neuronal function and only affected by single copy edit of MEF2C (p = 7.9 × 10⁻¹) (Figures 2B, 2C, and 2E). Genes within module lightcyan1 were enriched for DNA damage repair-associated nucleotide patch replacement (FDR < 0.1). In addition to having an essential role in cardiac and neurodevelopment, previous reports have also described MEF2C as serving lineage-specific roles in regulation of DNA damage repair.72,73 The genes co-expressed in the magenta module revealed a far greater emphasis on alterations to synaptic functions, being enriched for synaptic membrane adhesion, synaptic signaling, and PPI at the synapse (FDR < 0.1). The encoded proteins (n = 513) were mapped to a PPI network via StringDB74,75 in Cytoscape,76,77,78 resulting in a network with 150 members (confidence score > 0.7, evidence = experimental/database, PPI enrichment p < 1 × 10⁻¹⁶). The proteins from 76 genes contained within module magenta formed a network associated with neuronal and synaptic terms (Figure 2F). Module magenta also included genes associated with monogenic forms of epilepsy and other NDDs, such as GRIN2A, SCN2A, and GRIA2, providing evidence of molecular convergence for these genotypically distinct but strongly synaptic-activity-associated disease genes.79,80,81
MEF2C direct disruption yields changes to synaptic firing and synchrony in human neural models as measured by MEA
Given the strong transcriptional changes associated with deletion of MEF2C in hiPSC-derived neurons that converged on synaptic activity, we sought to functionally validate this association by defining electrophysiological changes in neurons via MEA (Figure 3; supplemental methods, section 2.6; Figures S5–S7). We differentiated heterozygous and homozygous MEF2C lines and matched controls to iNs and observed a statistically significant (on the basis of t test) down-regulation of synaptic activity in iNs. We observed statistically significant reductions in firing rate relative to wild type for both DELhet (26%, p = 1.4 × 10⁻⁵) and DELhom (31%, p = 1.3 × 10⁻²) (Figure 3A). We also observed statistically significant reductions to spike count relative to wild type for both DELhet (17%, p = 6.7 × 10⁻³) and DELhom (48%, p = 5.1 × 10⁻⁵) (Figure 3B). Additionally, we observed statistically significant reductions to synchrony, a measure of uniformity of neuronal firing bursts, relative to wild type for both DELhet (32%, p = 7.1 × 10⁻³) and DELhom (73%, p = 9.6 × 10⁻⁹) (Figure 3C). While we observed clear changes in firing rate, neither DELhet (p = 0.68) nor DELhom (p = 0.30) loss of MEF2C resulted in significant changes to network burst oscillation (Figure 3D). These data provided a complementary measure of MEF2C direct disruption resulting in altered synaptic activity.
Figure 3.

Reduced synaptic activity and synchrony in heterozygous (DELhet) and homozygous (DELhom) deletions of MEF2C in neurons via multi-electrode array
Each datapoint represents a single replicate well. Each resultant measurement was normalized per well against the wild-type (WT) mean per plate and normalized data points from two replicate plates plotted.
(A) Normalized weighted mean firing rate (Hz) (firing rate).
(B) Normalized number of spikes (spike count).
(C) Normalized area under cross correlation (synchrony).
(D) Normalized ISI (interspike interval) coefficient of variation (oscillation). p values were calculated via t test against normalized wells per genotype.
Dissecting 3D chromatin topology and regulatory interactions within the 5q14.3 locus
Our prior analyses from whole-genome sequencing of individuals with NDDs harboring BCAs,38 and other recent studies,3,82,83,84,85,86,87 have suggested that cis-regulatory disruption by noncoding SVs may underlie NDD phenotype association within the 5q14.3 locus beyond direct LoF MEF2C mutation. Collectively, these seven studies have reported CNV and BCA breakpoints 200–500 kb distal to MEF2C in 13 distinct cases presenting with phenotypes consistent with MEF2C haploinsufficiency such as NDD, epilepsy, and hypotonia. As a result, enhancer-promoter decoupling by disruption to 3D chromatin organization has emerged as a mechanistic hypothesis for indirect MEF2C disruption. We therefore performed a comprehensive and systematic dissection of the TAD and loop organization of the 5q14.3 region in human neural models. From analyses of existing 2D enhancer elements, MEF2C chromatin interactions in NSC and iN models as determined via UMI-4C,88 as well as 3D elements such as boundaries and structural protein ChIP annotations (CTCF and SMC3) from published datasets,31,89 we defined both 2D and 3D elements with evidence for a role in MEF2C regulation (supplemental methods, section 3.1; Figures S8 and S9). We then sought to determine the overarching 3D chromatin architecture responsible for orchestrating gene-enhancer interactions by generating an allelic series of deletions targeting 2D and 3D functional elements within the 5q14.3 locus (Figure 4).
Figure 4.

Design of CRISPR deletion allelic series
(A) Depiction of CRISPR targets relative to MEF2C and local 3D structures.
(B) Knight-Ruiz normalized Hi-C map from GM12878 wild-type EBV-transformed lymphoblastoid B-cell lines (LCLs) shown.31 Local topologically associating domain (TAD) annotations89 and putative MEF2C enhancers88 denoted as grey and purple bars, respectively. Black arrow within the Hi-C map and vertical grey lines highlight the MEF2C-housing loop of focus targeted in this study.
(C) Open chromatin regions identified by ATAC-seq in wild-type neural stem cells (NSCs) and glutamatergic induced neurons (iNs).
(D) Aggregate contacts from UMI-4C in wild-type NSCs and iNs shown relative to the viewpoint within the MEF2C promoter.
(E) Deletion positions of 3D topology boundaries guided by ChIP-seq for structural proteins CTCF and SMC3 in GM12878 LCLs.
We annotated topological structures from Epstein-Barr virus (EBV)-transformed lymphoblastoid B-cell lines (LCLs) by using Hi-C data and integrated CTCF- and SMC3-binding sites indicated by LCL ChIP-seq.31,89 We confirmed the presence of MEF2C in the loop structure identified in LCLs in our NSC and iN models by profiling interactions from the MEF2C promoter by using UMI-4C (Figures 4 and S11). Dual guide CRISPR-Cas9-based genome editing guides were then designed to engineer a series of deletions of the candidate 3D elements as outlined in Figure 4. We targeted deletion of four genomic sites, including the proximal and distal boundaries of the MEF2C-containing loop as the key experimental edits (referred to as “proximal boundary” and “distal boundary,” respectively), and two “negative control” edits, namely the boundary of the TAD adjacent to MEF2C (“adjacent TAD”), and the genomic sequence spanning the MEF2C-containing and adjacent TAD with no occupied CTCF-binding sites in 133 cell/tissue samples from ENCODE (“separator”). We focused on this MEF2C loop structure as opposed to the larger TAD given that it was largely cell type invariant in both the above resources and additional cell types as well as the strength of contact with MEF2C and its higher resolution map of the 3D organization encompassing the MEF2C-relevant enhancers (supplemental methods, section 3.1; Figures S8–S10). Differentiated hiPSC-derived iN and NSC CRISPR models were generated for each of these four deletion models with six replicates per DELhet and DELhom genotype as well as six control clones that were exposed to the CRISPR conditions but not edited (as described in material and methods). Differentiation of these hiPSCs established 204 individual neuronal lines representing systematic disruption to functional elements within the 5q14.3 locus (supplemental methods, section 3; Figures S15–S22).
Distal boundary deletion does not result in marked change to MEF2C expression
We observed that DELhet and DELhom of the separator and adjacent TAD boundary deletions resulted in no substantial changes in MEF2C expression or to contacts between the MEF2C promoter and published enhancers of MEF2C88 based on UMI-4C, as expected (Figure 5; supplemental methods, section 3.8; Figures S23, S24, S27, and S28).
Figure 5.

MEF2C expression and long-range contact changes following CRISPR allelic series
(A–E) In (A)–(E), the Y axis displays log2 fold change of differential expression for MEF2C. We also show 15 genes with detectable expression that are localized to either the topologically associating domain (TAD) encompassing MEF2C or one of the proximal or distal TADs. The significantly differentially expressed genes (locally corrected false discovery rate [FDR] < 0.1) in neural stem cells (NSCs) and glutamatergic induced neurons (iNs) are shown in red and the genes that are not differentially expressed are outlined in grey. Differential expression of each gene is annotated by a circle for heterozygous deletions (DELhet) and a diamond for homozygous deletions (DELhom). Position of CRISPR deletion annotated by vertical line. Differential contacts with the MEF2C promoter in each CRISPR line relative to matched wild type indicated by curved lines (Figures S26–S31). Lines included for significant contact changes with FDR < 0.1 based on a sliding window of 5 kb with 200 bp step. (A)–(E) represent individual CRISPR edits as labeled in the figure.
The distal boundary deletion served to directly test the necessity of 3D chromatin topology for robust expression of MEF2C.3,38,82,83,84,85 Surprisingly, deletion of this site resulted in no change in MEF2C protein accumulation and a slight increase (25% compared to wild type) in mRNA expression for DELhet in NSCs (log2FC = 0.33; FDR < 0.1 when correcting for multiple testing within the TAD, Figures 5 and S24). Aside from MEF2C, we also considered expression of genes expressed in NSCs or iNs that were located within either the MEF2C-containing TAD, the TAD directly proximal, or the TAD directly distal, which we refer to herein as “local genes,” by using TADs as defined by Dixon et al.89 Fifteen genes (not including MEF2C) met this criterion for local gene inclusion in NSCs, while 14 were considered in iNs given that MEF2C-AS1 was not expressed in this cell type. We observed no altered expression of any local genes aside from MEF2C in distal boundary deletion NSCs. To further explore this finding, we employed allele-specific UMI-4C anchored at the MEF2C promoter (Figure 5; supplemental methods, Section 3.8; Figure S30). These analyses identified an increase in significant (FDR < 0.1) contacts between the MEF2C promoter and two separate 6 kb windows harboring CTCF-binding sites immediately distal to the deletion position, suggesting CTCF motif redundancy may buffer deletions to canonical 3D boundary elements, preventing strong dysregulatory effects. In DELhet-matched iNs with distal boundary deletions, no significant expression or contact changes were observed for MEF2C or any other local genes. We note that we only considered DELhet disruption of the distal boundary given that DELhom lines were not recovered from our editing workflow.
To further evaluate this largely negative result, we tested the hypothesis of regulatory element redundancy buffering against pronounced expression effects on MEF2C. We did so by deleting what we referred to as the distal cluster, a 354 kb region that includes six annotated enhancers (e11–e16), five directly oriented CTCF-binding site motifs, the distal boundary, and one local gene, CETN3 (Figure 4). We note that the generation of this large CRISPR deletion was performed directly in NSCs (by comparison to the hiPSC stage prior to differentiation for all other models) and is thus a technically distinct validation experiment rather than directly comparable to the models in the initial hypothesis test. Nonetheless, in these analyses we observed no significant differential expression of MEF2C upon DELhet deletion of the distal cluster region when compared to matched wild types in either NSCs or NSC-derived iNs (Figures S24 and S25). Considering UMI-4C data from the viewpoint of the MEF2C promoter in these lines, we observed a significant (FDR < 0.1) increase in contacts with four sites within 5q14.3 alongside a contiguous increase with the 320 kb region immediately distal to the deleted region in NSCs (Figures 5 and S31). Considering local genes not directly disrupted by the deletion, we observed a cascade of significant (FDR < 0.1) dysregulation of 8/15 genes in 5q14.3 locus in iNs, with no genes significantly dysregulated in matched NSCs. Together, these analyses suggest that deletion of the distal boundary of the MEF2C-encompassing loop is insufficient to indirectly dysregulate this NDD-associated gene.
Proximal boundary deletion yields reduction of MEF2C expression and synaptic activity in iNs
In contrast to the weak or largely negative results observed for deletion of the distal boundary, deletion of the proximal boundary, which is located in an intron of MEF2C, had marked effects on the gene’s expression that appeared to be genotype and cell type dependent. NSCs harboring DELhet or DELhom of the proximal boundary did not display differential expression of MEF2C, though protein accumulation was significantly reduced in DELhom (49% relative to controls; p = 5.7 × 10⁻⁴, Figures S23 and S24). These DELhom NSCs also displayed differential contacts with the MEF2C promoter at four sites, three of which were significantly increased and one significantly decreased (locally corrected FDR < 0.1) (Figures 5 and S29). Moreover, homozygous deletion of the proximal boundary in iNs resulted in pronounced down-regulation of MEF2C, five genes localized to the MEF2C-containing TAD, and three genes within the TAD proximal to the MEF2C-containing TAD (locally corrected FDR < 0.1; Figure 5). This consistent down-regulation thus extended up to 3 Mb from the site of the deletion and was also dosage dependent, as DELhom deletion resulted in significantly reduced expression compared to unedited and DELhet cells (Figure 5). These positional effects were particularly strong for MEF2C, and DELhom deletion largely recapitulated the reduction observed with heterozygous direct gene deletion (i.e., 45% reduction, locally corrected FDR = 1.9 × 10⁻⁹, genome-wide FDR = 6.3 × 10⁻⁸) (Figure 5).
We next explored transcriptional and functional commonalities between direct MEF2C disruption and indirect expression reduction by proximal boundary deletion. We observed shared DEGs from direct MEF2C disruption in both NSCs and iNs with proximal boundary deletion (Figure 6). We also observed shared functional pathways in iNs related to synaptic activity, neurodevelopment, and neural differentiation between these distinct coding and noncoding functional mutations (Figure 6). The proximal boundary DELhom and direct MEF2C deletion iN DEGs also shared significant enrichment of terms such as axon development alongside sharing an enrichment for genes with promoter containing the sequence motif AACTTT, a binding motif in genes involved in neurodevelopment and muscle development.65,66 Given our demonstration of shared neuronal pathways between direct MEF2C deletion and proximal boundary deletion lines, we next tested whether this noncoding regulatory proximal boundary deletion replicated the synaptic deficits observed with MEF2C deletions. From these analyses, we observed a similarly strong reduction in synaptic activity for both DELhet and DELhom iNs when compared to matched wild-type clones over the differentiation time course measurements (Figure 6; Day 31–day 43). The pattern and significance detected for spike number and number of bursts over time was also consistent with the MEF2C deletion MEA time course experiment, suggesting a reproducible synaptic phenotype associated with both direct deletion and noncoding regulatory alterations to the MEF2C locus (supplemental methods, section 3.8; Figures S32–S34).
Figure 6.

Proximal boundary disruption yields disruption of genes involved in neuron differentiation and alters synaptic activity
(A) Differentially expressed genes (DEGs) comparison between lines harboring deletion of MEF2C and the proximal boundary deletion in neural stem cells (NSCs) and glutamatergic induced neurons (iNs)(top: both NSCs and iNs, bottom: iNs only).
(B) Functional enrichment of proximal boundary DEGs. Terms that are shared in iNs and NSCs harboring heterozygous and homozygous MEF2C deletions are also noted. Normalized weighted mean firing rate over time as measured by multi-electrode array (MEA) shown for iNs harboring MEF2C deletions (C) and iNs with proximal boundary deletions (D), respectively. The p values were calculated via t test against the wild types (WTs).
Discussion
We present an initial survey of the transcriptional and electrophysiological consequences of MEF2C gene deletion and indirect regulatory changes introduced by alterations to 5q14.3 TAD and chromatin loop topology in human-derived in vitro neural models. Direct LoF mutations (PTVs, deletions, translocations) within MEF2C have repeatedly been associated with NDD risk.1,2,6,8,9,83,84,90,91,92,93 A variety of murine knockout models, including conditional knockout of MEF2C in varying neural cell types and developmental time points, have collectively suggested a role for MEF2C in neuronal function,13,14,16,50 but no studies have evaluated MEF2C LoF mutations in human-derived cell lineages. In the study presented here, we engineered an allelic series of CRISPR-generated mutations within MEF2C and its putatively regulatory 3D functional elements and demonstrated that both direct and indirect alterations to MEF2C expression converge on themes related to neurodevelopment and synaptic activity.
Recently, specific studies that have focused on the knockout of SMC3 in human cell models,29 genome rearrangements in Drosophila,36 and TAD disruption at the Shh locus94 have demonstrated the uncoupling of regulatory changes associated with gene expression and alterations to long-range chromatin contacts. Our data further support those studies, as we observed alterations to 3D topological organization that occur without concomitant changes in gene expression. These demonstrations are in contrast to the hallmark examples of TAD disruption underlying dysregulation of a gene associated with a human disease phenotype.31,33,34,35 Most of the CRISPR models targeting 2D and 3D noncoding element deletions generated in this study demonstrated modest or no functional impact on expression of MEF2C and genes encompassed within the adjacent TADs. Furthermore, most CRISPR models also did not result in major changes to long-range contacts with the MEF2C promoter. We did note some robust changes in contact patterns from UMI-4C conducted in our NSC CRISPR lines, but most observed differential contacts did not engage previously validated enhancers of MEF2C. These findings further illustrate the complexity associated with the dynamic interactions that result from SV alterations of 3D topology and regulation of gene function.
Our approach weighted elements contributing to 3D genome organization given the previous reports highlighting TAD disruption as a putative indirect cause of MEF2C haploinsufficiency.38,83 In our most recent WGS study of 406 individuals with developmental disorders that harbored a BCA, as well as 304 BCAs from control individuals, the 5q14.3 locus continues to display a genome-wide significant enrichment of noncoding SV breakpoints that localize distal to MEF2C. The homozygous proximal boundary deletion caused a 2-fold reduction of MEF2C expression that was comparable to haploinsufficiency resulting from heterozygous deletion. The absence of a coding SNP within MEF2C prevented the determination of whether up-regulation of MEF2C on the wild-type allele prevented observed differential expression in heterozygous deletion of proximal boundary lines. This region has been recently reported as a cis-regulatory site that was demonstrated to reduce MEF2C expression following CRISPR interference (CRISPRi) in K562 cells.95 The shared enrichment of gene sets related to neurogenesis and neuronal differentiation between both proximal boundary and MEF2C DEGs demonstrates transcriptome dysregulation by both direct and indirect MEF2C disruption that converge upon biological processes of relevance to NDDs. We also observe significant overlap between indirect disruption of MEF2C by proximal boundary deletion in NSCs and direct MEF2C disruption in iNs, suggesting dysregulatory effects may involve temporal or cell-type-specific dysregulation. Furthermore, the shared enrichment of genes with AATCCC-binding motifs within their promoters, which was previously associated with genes involved in neuronal differentiation, including MEF2C, alongside the comparable reductions in synaptic activity as measured by MEA, suggest shared functional consequences from direct and indirect MEF2C disruption. However, the deletion of the distal boundary did not recapitulate these results. While the data are therefore unambiguous of a localized enrichment of disease-associated noncoding SV breakpoints spanning the MEF2C-containing 3D organization, the models that displayed the greatest transcriptional and functional consequences were not those that were predicted a priori on the basis of the localization of the SV breakpoints alone. The noncoding regulatory mechanisms that govern NDD risk in this region thus remain elusive and appear to be cell type and genotype specific. The deletions introduced here do not result in the same degree of genome topological rewiring as would be predicted from the translocations and inversions observed in the BCA cases, and the functional changes observed are not consistent across cell types. Similarly, in an NDD-affected individual with a de novo inversion upstream of MEF2C, the TAD structure is disrupted in LCL without any expression change for MEF2C.96 These analyses illustrate the highly complex regulatory architecture of alterations to chromatin topology and emphasize the significant challenges for computational prediction of the regulatory features of SVs.97,98,99
We present a comprehensive CRISPR-engineered isogenic allelic series of MEF2C disruption in human-derived in vitro models and functional characterization of resultant transcriptional and electrophysiological effects. These studies also uniquely dissect the parallel consequences of direct and indirect alterations to MEF2C by cis-regulatory disruption, revealing that some noncoding mutations can recapitulate synaptic deficits and transcriptional signatures observed from direct deletion of this gene underlying the well-established 5q14.3 microdeletion syndrome. While direct deletion of MEF2C revealed functional changes in human neurons that were consistent with previous studies in mouse models,14,15,16,17,50 our results following SV alteration to 3D organization of 5q14.3 underscore the complexity of regulatory interactions at this locus and more broadly in defining the features associated with the functional impact of noncoding SVs genome wide. These data clearly demonstrate that alteration to annotated boundaries of 3D regulatory architecture encompassing established human disease genes is insufficient evidence to presume alterations to gene regulation or phenotypic impact. Future in silico, in vitro, and in vivo studies targeting more loci and classes of SVs with designs that either recapitulate case rearrangements or are agnostic to regulatory element type will be necessary to further expand these findings into systematic analysis of the features associated with 3D genome architecture and noncoding disease association.
Acknowledgments
We would like to thank Maris Handley and the staff of the Harvard Stem Cell Institute FACS core at Massachusetts General Hospital for helpful discussion and technical assistance with cell sorting for hiPSC clone generation. We would also like to thank Lies Vantomme for excellent technical assistance. This research was supported by grants from the National Institutes of Health: P01GM061354, R01HD096326, R01MH115957, R01MH123155, U01HG011755, R03HD099547, R01NS093200, K08NS117891, and T32GM007748. Support was also provided by the Simons Foundation for Autism Research Initiative, USA (#573206) and by the grants G044615N and 1520518N of the Research Foundation Flanders (FWO). K.M. was supported by the National Science Foundation Graduate Research Fellowship Program (NSF GRFP), USA doctoral fellowship. R.Y. was supported by the Mass General Hospital Fund for Medical Discovery, USA. E.D. and S.V. were respectively supported by a doctoral and postdoctoral fellowship of the Research Foundation Flanders (FWO), Belgium. P.M.B. was supported by 1K08NS117891 and T32GM007748. M.M.O. was supported by the Autism Speaks Postdoctoral Fellowship.
Author contributions
Study design: K.M., R.Y., E.D., B.M., J.F.G., S.V., M.E.T. Experiments: K.M., E.D., P.M.B., M.M.O., R.B., B.C., K.O., N.D.B., D.J.C.T., M.S., M.L. Data analysis: K.M., R.Y., E.D., S.E., D.G., C.L., S.V.; Data interpretation: K.M., R.Y., E.D., S.E., S.V., M.E.T.; Manuscript writing: K.M., R.Y., E.D., S.E., J.F.G., S.V., M.E.T. All authors have reviewed and accepted final version of the manuscript.
Declaration of interests
M.E.T. receives research funding and/or reagents from Levo Therapeutics, Microsoft Inc, and Illumina Inc. K.M. initiated employment with Tornado Bio during the writing of this manuscript and is at present an employee of the company. J.F.G. is a founder and member of the scientific advisory board of Triplet Therapeutics, Inc., and has been a paid consultant to Biogen, Inc., Pfizer, Inc., and Wave Biosciences, Inc.
Published: October 24, 2022
Footnotes
Supplemental information can be found online at https://doi.org/10.1016/j.ajhg.2022.09.015.
Supplemental information
Data and code availability
Data for the study are available at NCBI GEO database with accession number GEO: GSE204778. Codes for specific analyses are available upon request.
References
- 1.Engels H., Wohlleber E., Zink A., Hoyer J., Ludwig K.U., Brockschmidt F.F., Wieczorek D., Moog U., Hellmann-Mersch B., Weber R.G., et al. A novel microdeletion syndrome involving 5q14.3-q15: clinical and molecular cytogenetic characterization of three patients. Eur. J. Hum. Genet. 2009;17:1592–1599. doi: 10.1038/ejhg.2009.90. [DOI] [PMC free article] [PubMed] [Google Scholar]
- 2.Cardoso C., Boys A., Parrini E., Mignon-Ravix C., McMahon J.M., Khantane S., Bertini E., Pallesi E., Missirian C., Zuffardi O., et al. Periventricular heterotopia, mental retardation, and epilepsy associated with 5q14.3-q15 deletion. Neurology. 2009;72:784–792. doi: 10.1212/01.wnl.0000336339.08878.2d. [DOI] [PubMed] [Google Scholar]
- 3.Zweier M., Gregor A., Zweier C., Engels H., Sticht H., Wohlleber E., Bijlsma E.K., Holder S.E., Zenker M., Rossier E., et al. Mutations in MEF2C from the 5q14.3q15 microdeletion syndrome region are a frequent cause of severe mental retardation and diminish MECP2 and CDKL5 expression. Hum. Mutat. 2010;31:722–733. doi: 10.1002/humu.21253. [DOI] [PubMed] [Google Scholar]
- 4.Le Meur N., Holder-Espinasse M., Jaillard S., Goldenberg A., Joriot S., Amati-Bonneau P., Guichet A., Barth M., Charollais A., Journel H., et al. MEF2C haploinsufficiency caused by either microdeletion of the 5q14.3 region or mutation is responsible for severe mental retardation with stereotypic movements, epilepsy and/or cerebral malformations. J. Med. Genet. 2010;47:22–29. doi: 10.1136/jmg.2009.069732. [DOI] [PMC free article] [PubMed] [Google Scholar]
- 5.Carr C.W., Zimmerman H.H., Martin C.L., Vikkula M., Byrd A.C., Abdul-Rahman O.A. 5q14.3 neurocutaneous syndrome: a novel continguous gene syndrome caused by simultaneous deletion of RASA1 and MEF2C. Am. J. Med. Genet. 2011;155A:1640–1645. doi: 10.1002/ajmg.a.34059. [DOI] [PubMed] [Google Scholar]
- 6.Bienvenu T., Diebold B., Chelly J., Isidor B. Refining the phenotype associated with MEF2C point mutations. Neurogenetics. 2013;14:71–75. doi: 10.1007/s10048-012-0344-7. [DOI] [PubMed] [Google Scholar]
- 7.Wang J., Zhang Q., Chen Y., Yu S., Wu X., Bao X., Wen Y. Novel MEF2C point mutations in Chinese patients with Rett (-like) syndrome or non-syndromic intellectual disability: insights into genotype-phenotype correlation. BMC Med. Genet. 2018;19:191. doi: 10.1186/s12881-018-0699-1. [DOI] [PMC free article] [PubMed] [Google Scholar]
- 8.Novara F., Rizzo A., Bedini G., Girgenti V., Esposito S., Pantaleoni C., Ciccone R., Sciacca F.L., Achille V., Della Mina E., et al. MEF2C deletions and mutations versus duplications: a clinical comparison. Eur. J. Med. Genet. 2013;56:260–265. doi: 10.1016/j.ejmg.2013.01.011. [DOI] [PubMed] [Google Scholar]
- 9.Nowakowska B.A., Obersztyn E., Szymańska K., Bekiesińska-Figatowska M., Xia Z., Ricks C.B., Bocian E., Stockton D.W., Szczałuba K., Nawara M., et al. Severe mental retardation, seizures, and hypotonia due to deletions of MEF2C. Am. J. Med. Genet. B Neuropsychiatr. Genet. 2010;153B:1042–1051. doi: 10.1002/ajmg.b.31071. [DOI] [PubMed] [Google Scholar]
- 10.Cesaretti C., Spaccini L., Righini A., Parazzini C., Conte G., Crosti F., Redaelli S., Bulfamante G., Avagliano L., Rustico M. Prenatal detection of 5q14.3 duplication including MEF2C and brain phenotype. Am. J. Med. Genet. 2016;170A:1352–1357. doi: 10.1002/ajmg.a.37594. [DOI] [PubMed] [Google Scholar]
- 11.Novara F., Beri S., Giorda R., Ortibus E., Nageshappa S., Darra F., Dalla Bernardina B., Zuffardi O., Van Esch H. Refining the phenotype associated withMEF2Chaploinsufficiency. Clin. Genet. 2010;78:471–477. doi: 10.1111/j.1399-0004.2010.01413.x. [DOI] [PubMed] [Google Scholar]
- 12.Tonk V., Kyhm J.H., Gibson C.E., Wilson G.N. Interstitial deletion 5q14.3q21.3 with MEF2C haploinsufficiency and mild phenotype: When more is less. Am. J. Med. Genet. 2011;155A:1437–1441. doi: 10.1002/ajmg.a.34012. [DOI] [PubMed] [Google Scholar]
- 13.Lin Q., Schwarz J., Bucana C., Olson E.N. Control of mouse cardiac morphogenesis and myogenesis by transcription factor MEF2C. Science. 1997;276:1404–1407. doi: 10.1126/science.276.5317.1404. [DOI] [PMC free article] [PubMed] [Google Scholar]
- 14.Flavell S.W., Cowan C.W., Kim T.K., Greer P.L., Lin Y., Paradis S., Griffith E.C., Hu L.S., Chen C., Greenberg M.E. Activity-dependent regulation of MEF2 transcription factors suppresses excitatory synapse number. Science. 2006;311:1008–1012. doi: 10.1126/science.1122511. [DOI] [PubMed] [Google Scholar]
- 15.Li Z., McKercher S.R., Cui J., Nie Z., Soussou W., Roberts A.J., Sallmen T., Lipton J.H., Talantova M., Okamoto S.-I., Lipton S.A. Myocyte enhancer factor 2C as a neurogenic and antiapoptotic transcription factor in murine embryonic stem cells. J. Neurosci. 2008;28:6557–6568. doi: 10.1523/JNEUROSCI.0134-08.2008. [DOI] [PMC free article] [PubMed] [Google Scholar]
- 16.Barbosa A.C., Kim M.-S., Ertunc M., Adachi M., Nelson E.D., McAnally J., Richardson J.A., Kavalali E.T., Monteggia L.M., Bassel-Duby R., Olson E.N. MEF2C, a transcription factor that facilitates learning and memory by negative regulation of synapse numbers and function. Proc. Natl. Acad. Sci. USA. 2008;105:9391–9396. doi: 10.1073/pnas.0802679105. [DOI] [PMC free article] [PubMed] [Google Scholar]
- 17.Harrington A.J., Bridges C.M., Berto S., Blankenship K., Cho J.Y., Assali A., Siemsen B.M., Moore H.W., Tsvetkov E., Thielking A., et al. MEF2C hypofunction in neuronal and neuroimmune populations produces MEF2C haploinsufficiency syndrome–like behaviors in mice. Biol. Psychiatry. 2020;88:488–499. doi: 10.1016/j.biopsych.2020.03.011. [DOI] [PMC free article] [PubMed] [Google Scholar]
- 18.Neale B.M., Kou Y., Liu L., Ma’ayan A., Samocha K.E., Sabo A., Lin C.-F., Stevens C., Wang L.-S., Makarov V., et al. Patterns and rates of exonic de novo mutations in autism spectrum disorders. Nature. 2012;485:242–245. doi: 10.1038/nature11011. [DOI] [PMC free article] [PubMed] [Google Scholar]
- 19.Hamdan F.F., Myers C.T., Cossette P., Lemay P., Spiegelman D., Laporte A.D., Nassif C., Diallo O., Monlong J., Cadieux-Dion M., et al. High rate of recurrent de novo mutations in developmental and epileptic encephalopathies. Am. J. Hum. Genet. 2017;101:664–685. doi: 10.1016/j.ajhg.2017.09.008. [DOI] [PMC free article] [PubMed] [Google Scholar]
- 20.Coe B.P., Witherspoon K., Rosenfeld J.A., van Bon B.W.M., Vulto-van Silfhout A.T., Bosco P., Friend K.L., Baker C., Buono S., Vissers L.E.L.M., et al. Refining analyses of copy number variation identifies specific genes associated with developmental delay. Nat. Genet. 2014;46:1063–1071. doi: 10.1038/ng.3092. [DOI] [PMC free article] [PubMed] [Google Scholar]
- 21.Deciphering Developmental Disorders Study Large-scale discovery of novel genetic causes of developmental disorders. Nature. 2015;519:223–228. doi: 10.1038/nature14135. [DOI] [PMC free article] [PubMed] [Google Scholar]
- 22.Fu J.M., Satterstrom F.K., Peng M., Brand H., Collins R.L., Dong S., Wamsley B., Klei L., Wang L., Hao S.P., et al. Rare coding variation provides insight into the genetic architecture and phenotypic context of autism. Nat. Genet. 2022;54:1320–1331. doi: 10.1038/s41588-022-01104-0. [DOI] [PMC free article] [PubMed] [Google Scholar]
- 23.Werling D.M., Brand H., An J.-Y., Stone M.R., Zhu L., Glessner J.T., Collins R.L., Dong S., Layer R.M., Markenscoff-Papadimitriou E., et al. An analytical framework for whole-genome sequence association studies and its implications for autism spectrum disorder. Nat. Genet. 2018;50:727–736. doi: 10.1038/s41588-018-0107-y. [DOI] [PMC free article] [PubMed] [Google Scholar]
- 24.An J.-Y., Lin K., Zhu L., Werling D.M., Dong S., Brand H., Wang H.Z., Zhao X., Schwartz G.B., Collins R.L., et al. Genome-wide de novo risk score implicates promoter variation in autism spectrum disorder. Science. 2018;362:eaat6576. doi: 10.1126/science.aat6576. [DOI] [PMC free article] [PubMed] [Google Scholar]
- 25.Aneichyk T., Hendriks W.T., Yadav R., Shin D., Gao D., Vaine C.A., Collins R.L., Domingo A., Currall B., Stortchevoi A., et al. Dissecting the causal mechanism of X-linked dystonia-parkinsonism by integrating genome and transcriptome assembly. Cell. 2018;172:897–909.e21. doi: 10.1016/j.cell.2018.02.011. [DOI] [PMC free article] [PubMed] [Google Scholar]
- 26.Padhi E.M., Hayeck T.J., Cheng Z., Chatterjee S., Mannion B.J., Byrska-Bishop M., Willems M., Pinson L., Redon S., Benech C., et al. Coding and noncoding variants in EBF3 are involved in HADDS and simplex autism. Hum. Genomics. 2021;15:44. doi: 10.1186/s40246-021-00342-3. [DOI] [PMC free article] [PubMed] [Google Scholar]
- 27.Oz-Levi D., Olender T., Bar-Joseph I., Zhu Y., Marek-Yagel D., Barozzi I., Osterwalder M., Alkelai A., Ruzzo E.K., Han Y., et al. Noncoding deletions reveal a gene that is critical for intestinal function. Nature. 2019;571:107–111. doi: 10.1038/s41586-019-1312-2. [DOI] [PMC free article] [PubMed] [Google Scholar]
- 28.Lieberman-Aiden E., van Berkum N.L., Williams L., Imakaev M., Ragoczy T., Telling A., Amit I., Lajoie B.R., Sabo P.J., Dorschner M.O., et al. Comprehensive mapping of long-range interactions reveals folding principles of the human genome. Science. 2009;326:289–293. doi: 10.1126/science.1181369. [DOI] [PMC free article] [PubMed] [Google Scholar]
- 29.Schwarzer W., Abdennur N., Goloborodko A., Pekowska A., Fudenberg G., Loe-Mie Y., Fonseca N.A., Huber W., Haering C.H., Mirny L., Spitz F. Two independent modes of chromatin organization revealed by cohesin removal. Nature. 2017;551:51–56. doi: 10.1038/nature24281. [DOI] [PMC free article] [PubMed] [Google Scholar]
- 30.Ruiz-Velasco M., Kumar M., Lai M.C., Bhat P., Solis-Pinson A.B., Reyes A., Kleinsorg S., Noh K.-M., Gibson T.J., Zaugg J.B. CTCF-mediated chromatin loops between promoter and gene body regulate alternative splicing across individuals. Cell Syst. 2017;5:628–637.e6. doi: 10.1016/j.cels.2017.10.018. [DOI] [PubMed] [Google Scholar]
- 31.Rao S.S.P., Huntley M.H., Durand N.C., Stamenova E.K., Bochkov I.D., Robinson J.T., Sanborn A.L., Machol I., Omer A.D., Lander E.S., Aiden E.L. A 3D map of the human genome at kilobase resolution reveals principles of chromatin looping. Cell. 2014;159:1665–1680. doi: 10.1016/j.cell.2014.11.021. [DOI] [PMC free article] [PubMed] [Google Scholar]
- 32.Rao S.S.P., Huang S.-C., Glenn St Hilaire B., Engreitz J.M., Perez E.M., Kieffer-Kwon K.-R., Sanborn A.L., Johnstone S.E., Bascom G.D., Bochkov I.D., et al. Cohesin loss eliminates all loop domains. Cell. 2017;171:305–320.e24. doi: 10.1016/j.cell.2017.09.026. [DOI] [PMC free article] [PubMed] [Google Scholar]
- 33.Franke M., Ibrahim D.M., Andrey G., Schwarzer W., Heinrich V., Schöpflin R., Kraft K., Kempfer R., Jerković I., Chan W.-L., et al. Formation of new chromatin domains determines pathogenicity of genomic duplications. Nature. 2016;538:265–269. doi: 10.1038/nature19800. [DOI] [PubMed] [Google Scholar]
- 34.Lupiáñez D.G., Kraft K., Heinrich V., Krawitz P., Brancati F., Klopocki E., Horn D., Kayserili H., Opitz J.M., Laxova R., et al. Disruptions of topological chromatin domains cause pathogenic rewiring of gene-enhancer interactions. Cell. 2015;161:1012–1025. doi: 10.1016/j.cell.2015.04.004. [DOI] [PMC free article] [PubMed] [Google Scholar]
- 35.Laugsch M., Bartusel M., Rehimi R., Alirzayeva H., Karaolidou A., Crispatzu G., Zentis P., Nikolic M., Bleckwehl T., Kolovos P., et al. Modeling the pathological long-range regulatory effects of human structural variation with patient-specific hiPSCs. Cell Stem Cell. 2019;24:736–752.e12. doi: 10.1016/j.stem.2019.03.004. [DOI] [PubMed] [Google Scholar]
- 36.Ghavi-Helm Y., Jankowski A., Meiers S., Viales R.R., Korbel J.O., Furlong E.E.M. Highly rearranged chromosomes reveal uncoupling between genome topology and gene expression. Nat. Genet. 2019;51:1272–1282. doi: 10.1038/s41588-019-0462-3. [DOI] [PMC free article] [PubMed] [Google Scholar]
- 37.Despang A., Schöpflin R., Franke M., Ali S., Jerković I. Functional dissection of the Sox9–Kcnj2 locus identifies nonessential and instructive roles of TAD architecture. Nature. 2019 doi: 10.1038/s41588-019-0466-z. [DOI] [PubMed] [Google Scholar]
- 38.Redin C., Brand H., Collins R.L., Kammin T., Mitchell E., Hodge J.C., Hanscom C., Pillalamarri V., Seabra C.M., Abbott M.-A., et al. The genomic landscape of balanced cytogenetic abnormalities associated with human congenital anomalies. Nat. Genet. 2017;49:36–45. doi: 10.1038/ng.3720. [DOI] [PMC free article] [PubMed] [Google Scholar]
- 39.Firth H.V., Richards S.M., Bevan aP., Clayton S., Corpas M., Rajan D., Van Vooren S., Moreau Y., Pettett R.M., Carter N.P. Decipher: database of chromosomal imbalance and phenotype in humans using ensembl resources. Am. J. Hum. Genet. 2009;84:524–533. doi: 10.1016/j.ajhg.2009.03.010. [DOI] [PMC free article] [PubMed] [Google Scholar]
- 40.Hsu P.D., Scott D.A., Weinstein J.A., Ran F.A., Konermann S., Agarwala V., Li Y., Fine E.J., Wu X., Shalem O., et al. DNA targeting specificity of RNA-guided Cas9 nucleases. Nat. Biotechnol. 2013;31:827–832. doi: 10.1038/nbt.2647. [DOI] [PMC free article] [PubMed] [Google Scholar]
- 41.Pliatsika V., Rigoutsos I. Off-Spotter”: very fast and exhaustive enumeration of genomic lookalikes for designing CRISPR/Cas guide RNAs. Biol. Direct. 2015;10:4. doi: 10.1186/s13062-015-0035-z. [DOI] [PMC free article] [PubMed] [Google Scholar]
- 42.Zhang Y., Pak C., Han Y., Ahlenius H., Zhang Z., Chanda S., Marro S., Patzke C., Acuna C., Covy J., et al. Rapid single-step induction of functional neurons from human pluripotent stem cells. Neuron. 2013;78:785–798. doi: 10.1016/j.neuron.2013.05.029. [DOI] [PMC free article] [PubMed] [Google Scholar]
- 43.Dobin A., Davis C.A., Schlesinger F., Drenkow J., Zaleski C., Jha S., Batut P., Chaisson M., Gingeras T.R. STAR: ultrafast universal RNA-seq aligner. Bioinformatics. 2013;29:15–21. doi: 10.1093/bioinformatics/bts635. [DOI] [PMC free article] [PubMed] [Google Scholar]
- 44.DeLuca D.S., Levin J.Z., Sivachenko A., Fennell T., Nazaire M.-D., Williams C., Reich M., Winckler W., Getz G. RNA-SeQC: RNA-seq metrics for quality control and process optimization. Bioinformatics. 2012;28:1530–1532. doi: 10.1093/bioinformatics/bts196. [DOI] [PMC free article] [PubMed] [Google Scholar]
- 45.Love M.I., Huber W., Anders S. Moderated estimation of fold change and dispersion for RNA-seq data with DESeq2. Genome Biol. 2014;15:550. doi: 10.1186/s13059-014-0550-8. [DOI] [PMC free article] [PubMed] [Google Scholar]
- 46.Leek J.T. svaseq: removing batch effects and other unwanted noise from sequencing data. Nucleic Acids Res. 2014;42:e161. doi: 10.1093/nar/gku864. [DOI] [PMC free article] [PubMed] [Google Scholar]
- 47.Langfelder P., Horvath S. WGCNA: an R package for weighted correlation network analysis. BMC Bioinf. 2008;9:559. doi: 10.1186/1471-2105-9-559. [DOI] [PMC free article] [PubMed] [Google Scholar]
- 48.Liberzon A., Subramanian A., Pinchback R., Thorvaldsdóttir H., Tamayo P., Mesirov J.P. Molecular signatures database (MSigDB) 3.0. Bioinformatics. 2011;27:1739–1740. doi: 10.1093/bioinformatics/btr260. [DOI] [PMC free article] [PubMed] [Google Scholar]
- 49.Liberzon A., Birger C., Thorvaldsdóttir H., Ghandi M., Mesirov J.P., Tamayo P. The molecular signatures database (MSigDB) hallmark gene set collection. Cell Syst. 2015;1:417–425. doi: 10.1016/j.cels.2015.12.004. [DOI] [PMC free article] [PubMed] [Google Scholar]
- 50.Harrington A.J., Raissi A., Rajkovich K., Berto S., Kumar J., Molinaro G., Raduazzo J., Guo Y., Loerwald K., Konopka G., et al. MEF2C regulates cortical inhibitory and excitatory synapses and behaviors relevant to neurodevelopmental disorders. Elife. 2016;5:e20059. doi: 10.7554/eLife.20059. [DOI] [PMC free article] [PubMed] [Google Scholar]
- 51.Koopmans F., van Nierop P., Andres-Alonso M., Byrnes A., Cijsouw T., Coba M.P., Cornelisse L.N., Farrell R.J., Goldschmidt H.L., Howrigan D.P., et al. SynGO: an evidence-based, expert-curated knowledge base for the synapse. Neuron. 2019;103:217–234.e4. doi: 10.1016/j.neuron.2019.05.002. [DOI] [PMC free article] [PubMed] [Google Scholar]
- 52.ENCODE Project Consortium An integrated encyclopedia of DNA elements in the human genome. Nature. 2012;489:57–74. doi: 10.1038/nature11247. [DOI] [PMC free article] [PubMed] [Google Scholar]
- 53.Parikshak N.N., Luo R., Zhang A., Won H., Lowe J.K., Chandran V., Horvath S., Geschwind D.H. Integrative functional genomic analyses implicate specific molecular pathways and circuits in autism. Cell. 2013;155:1008–1021. doi: 10.1016/j.cell.2013.10.031. [DOI] [PMC free article] [PubMed] [Google Scholar]
- 54.Li M., Santpere G., Imamura Kawasawa Y., Evgrafov O.V., Gulden F.O., Pochareddy S., Sunkin S.M., Li Z., Shin Y., Zhu Y., et al. Integrative functional genomic analysis of human brain development and neuropsychiatric risks. Science. 2018;362:eaat7615. doi: 10.1126/science.aat7615. [DOI] [PMC free article] [PubMed] [Google Scholar]
- 55.Doncheva N.T., Morris J.H., Gorodkin J., Jensen L.J. Cytoscape stringapp: network analysis and visualization of proteomics data. J. Proteome Res. 2019;18:623–632. doi: 10.1021/acs.jproteome.8b00702. [DOI] [PMC free article] [PubMed] [Google Scholar]
- 56.Buenrostro J.D., Wu B., Chang H.Y., Greenleaf W.J. ATAC-seq: A method for assaying chromatin accessibility genome-wide. Curr. Protoc. Mol. Biol. 2015;109:21–29. doi: 10.1002/0471142727.mb2129s109. [DOI] [PMC free article] [PubMed] [Google Scholar]
- 57.Langmead B., Salzberg S.L. Fast gapped-read alignment with Bowtie 2. Nat. Methods. 2012;9:357–359. doi: 10.1038/nmeth.1923. [DOI] [PMC free article] [PubMed] [Google Scholar]
- 58.Zhang Y., Liu T., Meyer C.A., Eeckhoute J., Johnson D.S., Bernstein B.E., Nusbaum C., Myers R.M., Brown M., Li W., Liu X.S. Model-based analysis of ChIP-Seq (MACS) Genome Biol. 2008;9:R137. doi: 10.1186/gb-2008-9-9-r137. [DOI] [PMC free article] [PubMed] [Google Scholar]
- 59.Li Q., Brown J.B., Huang H., Bickel P.J. Measuring reproducibility of high-throughput experiments. Ann. Appl. Stat. 2011;5:1752–1779. [Google Scholar]
- 60.Hinrichs A.S., Karolchik D., Baertsch R., Barber G.P., Bejerano G., Clawson H., Diekhans M., Furey T.S., Harte R.A., Hsu F., et al. The UCSC /Genome browser database: update 2006. Nucleic Acids Res. 2006;34:D590–D598. doi: 10.1093/nar/gkj144. [DOI] [PMC free article] [PubMed] [Google Scholar]
- 61.Schwartzman O., Mukamel Z., Oded-Elkayam N., Olivares-Chauvet P., Lubling Y., Landan G., Izraeli S., Tanay A. UMI-4C for quantitative and targeted chromosomal contact profiling. Nat. Methods. 2016;13:685–691. doi: 10.1038/nmeth.3922. [DOI] [PubMed] [Google Scholar]
- 62.Ramos-Rodríguez M., Subirana-Granés M., Pasquali L. UMI4Cats: an R package to analyze chromatin contact profiles obtained by UMI-4C. Bioinformatics. 2021 doi: 10.1093/bioinformatics/btab392. [DOI] [PMC free article] [PubMed] [Google Scholar]
- 63.Subramanian A., Tamayo P., Mootha V.K., Mukherjee S., Ebert B.L., Gillette M.A., Paulovich A., Pomeroy S.L., Golub T.R., Lander E.S., Mesirov J.P. Gene set enrichment analysis: a knowledge-based approach for interpreting genome-wide expression profiles. Proc. Natl. Acad. Sci. USA. 2005;102:15545–15550. doi: 10.1073/pnas.0506580102. [DOI] [PMC free article] [PubMed] [Google Scholar]
- 64.Karczewski K.J., Francioli L.C., Tiao G., Cummings B.B., Alföldi J., Wang Q., Collins R.L., Laricchia K.M., Ganna A., Birnbaum D.P., et al. The mutational constraint spectrum quantified from variation in 141, 456 humans. Nature. 2020;581:434–443. doi: 10.1038/s41586-020-2308-7. [DOI] [PMC free article] [PubMed] [Google Scholar]
- 65.Byrne K., Vuocolo T., Gondro C., White J.D., Cockett N.E., Hadfield T., Bidwell C.A., Waddell J.N., Tellam R.L. A gene network switch enhances the oxidative capacity of ovine skeletal muscle during late fetal development. BMC Genom. 2010;11:378. doi: 10.1186/1471-2164-11-378. [DOI] [PMC free article] [PubMed] [Google Scholar]
- 66.Bartlett T.E., Müller S., Diaz A. Single-cell Co-expression subnetwork analysis. Sci. Rep. 2017;7:15066. doi: 10.1038/s41598-017-15525-z. [DOI] [PMC free article] [PubMed] [Google Scholar]
- 67.Gómez-Ferrería M.A., Rey-Campos J. Functional domains of FOXJ2. J. Mol. Biol. 2003;329:631–644. doi: 10.1016/s0022-2836(03)00524-2. [DOI] [PubMed] [Google Scholar]
- 68.Abad M., Hashimoto H., Zhou H., Morales M.G., Chen B., Bassel-Duby R., Olson E.N. Notch inhibition enhances cardiac reprogramming by increasing MEF2C transcriptional activity. Stem Cell Rep. 2017;8:548–560. doi: 10.1016/j.stemcr.2017.01.025. [DOI] [PMC free article] [PubMed] [Google Scholar]
- 69.Vedantham V., Evangelista M., Huang Y., Srivastava D. Spatiotemporal regulation of an Hcn4 enhancer defines a role for Mef2c and HDACs in cardiac electrical patterning. Dev. Biol. 2013;373:149–162. doi: 10.1016/j.ydbio.2012.10.017. [DOI] [PMC free article] [PubMed] [Google Scholar]
- 70.Materna S.C., Sinha T., Barnes R.M., Lammerts van Bueren K., Black B.L. Cardiovascular development and survival require Mef2c function in the myocardial but not the endothelial lineage. Dev. Biol. 2019;445:170–177. doi: 10.1016/j.ydbio.2018.12.002. [DOI] [PMC free article] [PubMed] [Google Scholar]
- 71.Mayers C.M., Wadell J., McLean K., Venere M., Malik M., Shibata T., Driggers P.H., Kino T., Guo X.C., Koide H., et al. The Rho guanine nucleotide exchange factor AKAP13 (BRX) is essential for cardiac development in mice. J. Biol. Chem. 2010;285:12344–12354. doi: 10.1074/jbc.M110.106856. [DOI] [PMC free article] [PubMed] [Google Scholar]
- 72.Wang W., Org T., Montel-Hagen A., Pioli P.D., Duan D., Israely E., Malkin D., Su T., Flach J., Kurdistani S.K., et al. MEF2C protects bone marrow B-lymphoid progenitors during stress haematopoiesis. Nat. Commun. 2016;7:12376. doi: 10.1038/ncomms12376. [DOI] [PMC free article] [PubMed] [Google Scholar]
- 73.Wang W., Montel-Hagen A., Sasidharan R., Mikkola H.K.A. Mef2C maintains B cell homeostasis through the regulation of DNA repair machinery. Blood. 2012;120:278. [Google Scholar]
- 74.Franceschini A., Others STRINGdb package vignette. Nucleic Acids Res. 2013 [Google Scholar]
- 75.Szklarczyk D., Morris J.H., Cook H., Kuhn M., Wyder S., Simonovic M., Santos A., Doncheva N.T., Roth A., Bork P., et al. The STRING database in 2017: quality-controlled protein–protein association networks, made broadly accessible. Nucleic Acids Res. 2017;45:D362–D368. doi: 10.1093/nar/gkw937. [DOI] [PMC free article] [PubMed] [Google Scholar]
- 76.Cline M.S., Smoot M., Cerami E., Kuchinsky A., Landys N., Workman C., Christmas R., Avila-Campilo I., Creech M., Gross B., et al. Integration of biological networks and gene expression data using Cytoscape. Nat. Protoc. 2007;2:2366–2382. doi: 10.1038/nprot.2007.324. [DOI] [PMC free article] [PubMed] [Google Scholar]
- 77.Saito R., Smoot M.E., Ono K., Ruscheinski J., Wang P.-L., Lotia S., Pico A.R., Bader G.D., Ideker T. A travel guide to cytoscape plugins. Nat. Methods. 2012;9:1069–1076. doi: 10.1038/nmeth.2212. [DOI] [PMC free article] [PubMed] [Google Scholar]
- 78.Shannon P., Markiel A., Ozier O., Baliga N.S., Wang J.T., Ramage D., Amin N., Schwikowski B., Ideker T. Cytoscape: a software environment for integrated models of biomolecular interaction networks. Genome Res. 2003;13:2498–2504. doi: 10.1101/gr.1239303. [DOI] [PMC free article] [PubMed] [Google Scholar]
- 79.Lemke J.R., Lal D., Reinthaler E.M., Steiner I., Nothnagel M., Alber M., Geider K., Laube B., Schwake M., Finsterwalder K., et al. Mutations in GRIN2A cause idiopathic focal epilepsy with rolandic spikes. Nat. Genet. 2013;45:1067–1072. doi: 10.1038/ng.2728. [DOI] [PubMed] [Google Scholar]
- 80.Shi X., Yasumoto S., Kurahashi H., Nakagawa E., Fukasawa T., Uchiya S., Hirose S. Clinical spectrum of SCN2A mutations. Brain Dev. 2012;34:541–545. doi: 10.1016/j.braindev.2011.09.016. [DOI] [PubMed] [Google Scholar]
- 81.Salpietro V., Dixon C.L., Guo H., Bello O.D., Vandrovcova J., Efthymiou S., Maroofian R., Heimer G., Burglen L., Valence S., et al. AMPA receptor GluA2 subunit defects are a cause of neurodevelopmental disorders. Nat. Commun. 2019;10:3094. doi: 10.1038/s41467-019-10910-w. [DOI] [PMC free article] [PubMed] [Google Scholar]
- 82.Floris C., Rassu S., Boccone L., Gasperini D., Cao A., Crisponi L. Two patients with balanced translocations and autistic disorder: CSMD3 as a candidate gene for autism found in their common 8q23 breakpoint area. Eur. J. Hum. Genet. 2008;16:696–704. doi: 10.1038/ejhg.2008.7. [DOI] [PubMed] [Google Scholar]
- 83.Saitsu H., Igarashi N., Kato M., Okada I., Kosho T., Shimokawa O., Sasaki Y., Nishiyama K., Tsurusaki Y., Doi H., et al. De novo 5q14.3 translocation 121.5-kb upstream of MEF2C in a patient with severe intellectual disability and early-onset epileptic encephalopathy. Am. J. Med. Genet. 2011;155A:2879–2884. doi: 10.1002/ajmg.a.34289. [DOI] [PubMed] [Google Scholar]
- 84.Shimojima K., Okumura A., Mori H., Abe S., Ikeno M., Shimizu T., Yamamoto T. De novo microdeletion of 5q14.3 excluding MEF2C in a patient with infantile spasms, microcephaly, and agenesis of the corpus callosum. Am. J. Med. Genet. 2012;158A:2272–2276. doi: 10.1002/ajmg.a.35490. [DOI] [PubMed] [Google Scholar]
- 85.Yauy K., Schneider A., Ng B.L., Gaillard J.-B., Sati S., Coubes C., Wells C., Tournaire M., Guignard T., Bouret P., et al. Disruption of chromatin organisation causes MEF2C gene overexpression in intellectual disability: a case report. BMC Med. Genomics. 2019;12:116. doi: 10.1186/s12920-019-0558-8. [DOI] [PMC free article] [PubMed] [Google Scholar]
- 86.Schluth-Bolard C., Diguet F., Chatron N., Rollat-Farnier P.-A., Bardel C., Afenjar A., Amblard F., Amiel J., Blesson S., Callier P., et al. Whole genome paired-end sequencing elucidates functional and phenotypic consequences of balanced chromosomal rearrangement in patients with developmental disorders. J. Med. Genet. 2019;56:526–535. doi: 10.1136/jmedgenet-2018-105778. [DOI] [PubMed] [Google Scholar]
- 87.Vergult S., Van Binsbergen E., Sante T., Nowak S., Vanakker O., Claes K., Poppe B., Van der Aa N., van Roosmalen M.J., Duran K., et al. Mate pair sequencing for the detection of chromosomal aberrations in patients with intellectual disability and congenital malformations. Eur. J. Hum. Genet. 2014;22:652–659. doi: 10.1038/ejhg.2013.220. [DOI] [PMC free article] [PubMed] [Google Scholar]
- 88.D’haene E., Bar-Yaacov R., Bariah I., Vantomme L., Van Loo S., Cobos F.A., Verboom K., Eshel R., Alatawna R., Menten B., et al. A neuronal enhancer network upstream of MEF2C is compromised in patients with Rett like characteristics. Hum. Mol. Genet. 2020;29:879–880. doi: 10.1093/hmg/ddaa019. [DOI] [PMC free article] [PubMed] [Google Scholar]
- 89.Dixon J.R., Selvaraj S., Yue F., Kim A., Li Y., Shen Y., Hu M., Liu J.S., Ren B. Topological domains in mammalian genomes identified by analysis of chromatin interactions. Nature. 2012;485:376–380. doi: 10.1038/nature11082. [DOI] [PMC free article] [PubMed] [Google Scholar]
- 90.Porter B., Paciorkowski A. MEF2C haploinsufficiency syndrome: A severe neurodevelopmental disorder with variable epilepsy. J. Pediatr. Epilepsy. 2015;01:171–178. [Google Scholar]
- 91.Paciorkowski A.R., Traylor R.N., Rosenfeld J.A., Hoover J.M., Harris C.J., Winter S., Lacassie Y., Bialer M., Lamb A.N., Schultz R.A., et al. MEF2C Haploinsufficiency features consistent hyperkinesis, variable epilepsy, and has a role in dorsal and ventral neuronal developmental pathways. Neurogenetics. 2013;14:99–111. doi: 10.1007/s10048-013-0356-y. [DOI] [PMC free article] [PubMed] [Google Scholar]
- 92.Borlot F., Whitney R., Cohn R.D., Weiss S.K. MEF2C-related epilepsy: Delineating the phenotypic spectrum from a novel mutation and literature review. Seizure. 2019;67:86–90. doi: 10.1016/j.seizure.2019.03.015. [DOI] [PubMed] [Google Scholar]
- 93.Rocha H., Sampaio M., Rocha R., Fernandes S., Leão M. MEF2C haploinsufficiency syndrome: Report of a new MEF2C mutation and review. Eur. J. Med. Genet. 2016;59:478–482. doi: 10.1016/j.ejmg.2016.05.017. [DOI] [PubMed] [Google Scholar]
- 94.Williamson I., Kane L., Devenney P.S., Flyamer I.M., Anderson E., Kilanowski F., Hill R.E., Bickmore W.A., Lettice L.A. Developmentally regulated Shh expression is robust to TAD perturbations. Development. 2019;146:dev179523. doi: 10.1242/dev.179523. [DOI] [PMC free article] [PubMed] [Google Scholar]
- 95.Reilly S.K., Gosai S.J., Gutierrez A., Mackay-Smith A., Ulirsch J.C., Kanai M., Mouri K., Berenzy D., Kales S., Butler G.M., et al. Direct characterization of cis-regulatory elements and functional dissection of complex genetic associations using HCR–FlowFISH. Nat. Genet. 2021;53:1166–1176. doi: 10.1038/s41588-021-00900-4. [DOI] [PMC free article] [PubMed] [Google Scholar]
- 96.Palmer E.E., Sachdev R., Macintosh R., Melo U.S., Mundlos S., Righetti S., Kandula T., Minoche A.E., Puttick C., Gayevskiy V., et al. Diagnostic yield of whole genome sequencing after nondiagnostic exome sequencing or gene panel in developmental and epileptic encephalopathies. Neurology. 2021;96:e1770–e1782. doi: 10.1212/WNL.0000000000011655. [DOI] [PubMed] [Google Scholar]
- 97.Fudenberg G., Kelley D.R., Pollard K.S. Predicting 3D genome folding from DNA sequence with Akita. Nat. Methods. 2020;17:1111–1117. doi: 10.1038/s41592-020-0958-x. [DOI] [PMC free article] [PubMed] [Google Scholar]
- 98.Huynh L., Hormozdiari F. TAD fusion score: discovery and ranking the contribution of deletions to genome structure. Genome Biol. 2019;20:60. doi: 10.1186/s13059-019-1666-7. [DOI] [PMC free article] [PubMed] [Google Scholar]
- 99.Nieboer M.M., de Ridder J. svMIL: predicting the pathogenic effect of TAD boundary-disrupting somatic structural variants through multiple instance learning. Bioinformatics. 2020;36:i692–i699. doi: 10.1093/bioinformatics/btaa802. [DOI] [PubMed] [Google Scholar]
Associated Data
This section collects any data citations, data availability statements, or supplementary materials included in this article.
Supplementary Materials
Data Availability Statement
Data for the study are available at NCBI GEO database with accession number GEO: GSE204778. Codes for specific analyses are available upon request.