

Abstract
Background
Due to the vast socioeconomic diversity among its residents, studying health inequality in India is of particular interest. This study aimed to investigate the wealth-based inequalities in physical frailty and to quantify the contributions of potential predictors of frailty to this inequality.
Methods
Data were drawn from the first wave of the Longitudinal Ageing Study in India (LASI) conducted during 2017–18. Logistic regression analysis was used to examine the association between wealth status and frailty. We used the concentration index to measure the magnitude of wealth-related inequality in frailty. A decomposition analysis based on the logit model was used to assess the contribution of each predictor to the total inequality.
Results
The prevalence of physical frailty was significantly higher among the older adults in the poor group than in the non-poor group [Difference (poor vs. non-poor): 6.4%; p < 0.001]. Regression results indicated that older adults in the poorest group were 23% more likely to be physically frail than those in the richest category [Adjusted odds ratio (AOR) = 1.23; 95% confidence interval (CI): 1.11, 1.38]. The overall concentration index of frailty was 0.058 among the older adults, indicating that frailty is more concentrated among older adults with poor wealth status. Body mass index, wealth index, educational status, and region were the major and significant contributors to the socioeconomic status (SES) related inequalities in frailty.
Conclusions
Results suggest the need for formulating effective prevention and intervention strategies to decelerate the development of physical frailty among older adults in India, especially those with poor socioeconomic background.
Supplementary Information
The online version contains supplementary material available at 10.1186/s12889-022-14434-9.
Keywords: Socioeconomic inequality, Frailty, Older adults, LASI
Background
Frailty is an age-related geriatric syndrome characterized as the progressive loss of the physiological reserve and lack of response to the stressors [1] and is strongly associated with different adverse health outcomes such as decreased mobility, incident disability, hospitalization, falls, and increased risk of mortality [2–5]. Frailty is still an evolving concept, and there is a lack of consensus on the diagnostic criteria of frailty in epidemiological investigations and clinical practices. However, the most used frailty phenotype was defined by Fried and colleagues [1], which identifies frailty by the presence of three or more of five components (weakness, slowness, unintentional weight loss, poor endurance, and energy, and low physical activity). Frailty is not an inevitable consequence of old age rather an avoidable condition [6]. Globally, around 10% of the older adults are affected by frailty, and its prevalence increases with advanced age [7]. Therefore, the prevention or postponement of frailty is essential to maintain the functioning and health of the older populations.
Health inequalities between socioeconomic groups persist in developing, and developed countries [8]; frailty is no exception. Different studies have reported that frailty prevalence was higher among older persons with lower education and lower income [9–13]. Additionally, several longitudinal studies have also found low socioeconomic status (SES) as a potential risk factor of increased frailty level among older adults [10, 14–16]. Identification of variations in the prevalence of frailty across socioeconomic subgroups generates opportunities to prevent health-related inequalities. Multiple studies have investigated the health inequalities for different components of SES, including education [17, 18], income [19, 20], and occupation [21, 22]. Although it has been well-recognized that wealth has potential health implications, fewer studies have investigated the impact of wealth status on frailty [23, 24].
The proportion of the older population is growing worldwide because of the gain in life expectancy and low fertility rates, and this growth is more rapid in developing countries [25]. India is no exception; the number of Indian older adults aged 60 years and above is expected to grow from 104 million (8.6%) in 2011 to 319 million (19.1%) by 2050 [26]. With the increasing older population, the number of (pre-)frail older adults is expected to rise rapidly; thus, identifying the people at the risk of frailty is of utmost importance [27]. Most studies investigating socioeconomic inequalities in frailty are available from the developed countries [11, 14]. Although frailty has been studied in developing countries [28, 29], fewer studies have focused on the socioeconomic inequalities in frailty – specifically, wealth based-inequalities in frailty. A study based on the WHO’s Study on global AGEing and adult health (SAGE) data reported that education and income are the protective factors against frailty among Indian older adults [28]. Therefore, it can be expected that, in the Indian scenario, reducing the income- or wealth-based inequalities in frailty can help to tackle the burden of frailty and, consequently, to achieve meaningful health benefits.
A recent systematic review has recommended that reducing socioeconomic inequalities in frailty among older adults should be a policy concern [30]. Apart from determining the presence of socioeconomic inequalities, gaining insights into the factors which contribute mostly to the socioeconomic inequalities in frailty is necessary to identify more vulnerable sub-populations as the target groups and to suggest possible interventions directing towards reducing frailty and its adverse effects. Even though frailty-based studies are increasing, little attention has been paid to understand wealth-based (i.e., wealth-based) inequality in frailty over time. Due to the vast socioeconomic diversity among its residents, studying health inequality in India is of particular interest. Till now, no study in India in authors’ knowledge has investigated the socioeconomic inequalities associated with physical frailty in old age. Thus, the study aimed to investigate the wealth-based inequalities in physical frailty among older adults and to quantify the contributions of potential predictors of frailty to this inequality.
Methods
Data
This study utilizes data from India’s first nationally representative longitudinal Ageing survey (LASI-2017-18) which investigates into the health, economics and social determinants and consequences of population ageing in India [31]. The representative sample included 72,250 adults aged 45 and above and their spouses across all states and union territories of India except Sikkim. The LASI adopts a multistage stratified area probability cluster sampling design to select the eventual units of observation. Households with at least one member aged 45 and above were taken as the eventual unit of observation. This study provides scientific evidence on demographics, household economic status, chronic health conditions, symptom-based health condition, functional and mental health, biomarkers, health care utilization, work and employment etc. It enables the cross-state analyses and the cross-national analyses of ageing, health, economic status, and social behaviours and has been designed to evaluate the effect of changing policies and behavioural outcomes in India. Detailed information on the sampling frame is available on the LASI WAVE-1 Report [31]. The effective sample size for the present study was 11,842 and 18,709 older adults aged 60 years and above in the poor and non-poor category (total 30,551 older adults after excluding 913 individuals due to incomplete information on physical frailty components) [31]. All the steps/ methods were performed in accordance with the relevant guidelines and regulations, established by the declaration of Helsinki.
Variable description
Outcome variable
Frailty
The physical frailty among older adults were assessed using an adapted version of the frailty phenotype described by Fried and colleagues [32]. Multiple studies on Indian older adults utilized the Fried’s phenotype framework to define frailty [33–35]. The frailty phenotype developed by Fried and colleagues consists of five components: (1) self-reported exhaustion, (2) unintentional weight loss, (3) weak grip strength, (4) self-reported low physical activity, and (5) slow walking time. The overall score of frailty phenotype lies between 0 and 5. Respondents with a score of 0 to 2 were considered “non-frail,” and three or higher as “frail”. The assessment of the individual domains is described in Table 1. The criticism of the Fried’s criteria of defining frailty is that it focuses mainly on physical health deficits. Also, the Fried’s criteria for defining frailty do not account for the role of various psychological factors, including cognition and depression among older adults [36, 37]. In addition, the reliance of Fried’s criteria on questionnaires to identify weight loss and exhaustion potentially suffers from participant bias [38].
Table 1.
Criteria used to define physical frailty in LASI, 2017–18
| Exhaustion |
During the past week, how often did you feel: (a) tired or low in energy; (b) that everything you did was an effort. Less than three days = 0; More than three days =1. |
|
| Grip strength | Average grip strength score in dominant hand (2 trials) using Smedley’s handheld dynamometer (adjusted for gender and body mass index (BMI)) | |
| BMI | Cut-off for Grip strength | |
| For men | ||
| BMI ≤ 24 | ≤ 29 kg | |
| BMI 24.1–26 | ≤ 30 kg | |
| BMI 26.1–28 | ≤ 30 kg | |
| BMI > 28 | ≤ 32 kg | |
| For women | ||
| BMI ≤ 23 | ≤ 17 kg | |
| BMI 23.1–26 | ≤ 17.3 kg | |
| BMI 26.1–29 | ≤ 18 kg | |
| BMI > 29 | ≤ 21 kg | |
| Walk time | In the LASI, respondents were asked to walk 4 m twice. The time taken to walk was recorded in seconds each time, and the average time taken in both trials was calculated. (Stratified by gender and height (gender-specific cut-off a medium height) | |
| Cut-off for Time to Walk 4-m | ||
| Men | ||
| Height ≤ 173 cm | ≥ 7 seconds | |
| Height > 173 cm | ≥ 6 seconds | |
| Women | ||
| Height ≤ 159 cm | ≥ 7 seconds | |
| Height > 159 cm | ≥ 6 seconds | |
| Weight loss |
Do you think that you have lost weight in the last 12 months because there was not enough food at your household?” Yes = 1, No = 0. |
|
| Physical activity |
How often do you take part in sports or vigorous activities, such as running or jogging, swimming, going to a health center or gym, cycling, or digging with a spade or shovel, heavy lifting, chopping, farm work, fast bicycling, cycling with loads? One to three times a month or hardly ever or never = 1, once a week or more than once a week = 0 |
|
| Total score |
5 Items: 0–2 deficits = non-frail, 3+ deficits = frail Allowed missing 1–2 items, missing imputed with 0 (sum of available items) |
|
Explanatory variable
Main explanatory variable
Wealth index was calculated using variables related to household assets, amenities, and housing quality. For constructing wealth index in the LASI, we have utilized a similar approach that is being used in Demographic Health Surveys (DHS) [39]. To construct wealth index, we utilized a set of 46 variables that covers the broad domains of the household’s wealth and amenities and access to financial institutions. Further details are provided in Supplementary file. For the analysis purposes, the wealth quintile was categorized as poor which includes poorest and poorer category and non-poor which includes middle, richer and richest.
Other explanatory variables
A set of potentially related covariates including individual, behavioural, health, and household factors were included in the analysis. Individual factors were age (young-old (60–69 years), old-old (70–79 years) and oldest-old (80+ years)); sex (male, female); educational status (no education/primary not completed, primary, secondary and higher); living arrangement (living alone, living with spouse only, living with children only and living with others); marital status (currently married, widowed and others (separated/divorced/never married)); working status (never worked, currently working, currently not working and retired); and social engagement (no, yes). The participants were categorized as socially engaged if they participated in any of these activities: eating out in a restaurant or hotel, going to park/beach, playing cards or indoor games, playing outdoor games, visiting relatives/friends, attending cultural performances, attending religious functions, attend political/community/organization group meetings, read books/newspapers, watch television, use a computer for e-mail/net surfing etc. Behavioral factors include tobacco consumption (no, yes) and alcohol consumption (no, yes). Health-related factors comprises of body mass index (< 18.5 kg/m2 (underweight), 18.5 to 24.9 kg/m2 (normal), ≥25 kg/m2 (overweight/obese) [40]); self-rated health (good, poor); difficulties in basic and instrumental activities of daily living (ADL and IADL) (no, yes); and morbidity status (0, 1, 2 and above). The morbid conditions that are considered to create the morbidity status are hypertension, coronary heart diseases, stroke, cancer, diabetes mellitus, chronic bone/joint diseases, neurological or psychiatric conditions, chronic lung diseases and high cholesterol. Basic ADLs included six activities: dressing, bathing, walking, eating, getting in or out of bed, and toileting, which were necessary for older individuals’ independent living in the community. On the other hand, IADLs included seven activities: preparing food, shopping, making telephone calls, taking medications, working around the house, managing money, and finding an address in an unfamiliar place [41]. Various household factors were: Religion (Hindu, Muslim, Christian, and Others), Caste (Scheduled Tribe, Scheduled Caste, Other Backward Class, and others), residence (rural and urban), and region (North, Central, East, Northeast, West, and South.
Statistical analysis
Bivariate analysis was performed to identify the significant variables that are related to frailty. A two-sample proportion test was used to evaluate if the prevalence of the various socioeconomic and demographic variables obtained according to the wealth status (Poor, Non-poor) were significantly different. Multiple logistic regression was used to examine the association between frailty and various explanatory covariates. Logistic regression is used when the outcome variable is binary (no/yes (0/1)). The independent variables may be continuous or categorical or a mixture of the two. It is advantageous over simple linear regression in terms of the interpretation and indicates the relative likelihood of the event of interest. Our dependent variable, physical frailty status, has two categories: 0 = not frail; 1 = frail. Therefore, the utilization of logistic regression model is considered appropriate (See supplementary material for detailed mathematical expressions).
The presence of multicollinearity among the independent variables was detected using the Variance Inflation Factor (VIF) at a cut-off point of 10. In the final model, to check the goodness-of-fit, an F-adjusted goodness-of-fit test was employed. Due to complex sampling design effects in LASI, we accounted for inverse probability weights by using the svyset command in Stata 15.1. Model-1 represents the unadjusted estimates whereas Model-2 represents the adjusted estimates i.e., model-2 was adjusted for age, sex, education, living arrangement, working status, marital status, social engagement, tobacco consumption, alcohol consumption, BMI, self-rated health, ADL, IADL, morbidity status, religion, caste, place of residence and region.
Concentration curve (CC) and concentration index (CCI) were used to determine the inequalities in the distribution of the frailty by wealth index scores. The CC depicts how a cumulative share of the frailty (y-axis) is accounted for by the cumulative percentage of the individuals ranked by wealth scores (x-axis). If every individual has an identical health outcome, regardless of the wealth status, the CC would be a 450 line that runs from the lower-left corner to the upper right corner, also known as the “line of equality.” On the contrary, if the health outcome variable has higher values among poorer people, the CC will lie above the “line of equality” and vice versa. The farther the curve is away from the baseline, represented by the equality line, the more unequal is the distribution of the health outcome variable [42]. The CCI corresponds to twice the area between the CC and the line of equality [43]. In the present paper, the CCI is computed as twice the covariance of the health outcome variable and a person’s rank in terms of wealth status, divided by the mean of the health variable [44]:
| 1 |
Where γj and Rj are the health status and fractional rank (in terms of the index of economic status) of the jth individual, respectively; μ is the mean of the health outcome variable, and cov denotes the covariance.
Decomposition of the CCI
The present study used Wagstaff’s CCI decomposition approach to reveal the contribution of each explanatory variable to the measured health inequality (i.e., frailty inequality) [45]. According to Wagstaff, a linear regression model linking health outcome variable (y) to a set of k explanatory variables (xk):
| 2 |
Where xki is a set of k explanatory variables for the ith individual, βk signifies the coefficient, and εi is an error term. Given the association of yi and xki, in eq. (2), the concentration index (CCI) for y, can be written as follows:
| 3 |
Where C denotes the overall concentration index, μ is the mean of y, is the mean of xk, Ck is the normalized concentration index for xk (defined exactly like CCI), is the elasticity of health variable with the explanatory variables, and GCε is the generalized CCI for εi (residual component). Equation (3) suggests that the concentration index consists of explained and residual (unexplained) components. In most cases, health outcome variables are rarely continuous. We have approximated decomposition analysis by using marginal effects on the logit model. A linear approximation of the non-linear estimation can be represented as:
| 4 |
Where is the marginal effects () of each x; μi signifies the error term generated by the linear approximation. The concentration index for the heath variable (y) (in our case, frailty) is given as:
| 5 |
Results
In total, 30,551 participants comprise the effective sample, including 11,842 older adults in the poor group and 18,709 in the non-poor group. Table 2 shows the socio-economic and demographic profiles of the two groups. The pattern of age and sex distribution was similar among both poor and non-poor groups. The proportion of illiterate (84.3% vs. 54.3%), living alone (9.8% vs. 2.3%), non-working (39.4% vs. 32.7%), and widowed (38.2% vs. 34.2%) older adults in the poor group was higher than that in the non-poor group. The level of social engagement was higher among older adults in the non-poor group than in the poor group (94.3% vs. 88.0%). The proportion of tobacco (47.1% vs. 34.4%) and alcohol (16.6% vs. 13.0%) consumption were higher among older adults in the poor group than the non-poor group. According to different health-related predictors, the non-poor group had a higher proportion of older adults who were overweight/obese (28.4% vs. 10.7%), had good self-rated health (55.7% vs. 46.4%), and had no difficulty in ADL (79.2% vs. 74.8%) and IADL (56.8% vs. 47.3%) than in the non-poor group. Moreover, the proportion of older adults with more than two comorbidities was higher in the non-poor group than in the poor group (29.8% vs. 16.7%).
Table 2.
Socio-economic and demographic profile of the study population in India, 2017–18
| Background characteristics | Poor | Non-poor | ||
|---|---|---|---|---|
| Sample | Percentage | Sample | Percentage | |
| Individual factors | ||||
| Age | ||||
| Young-old (60–69 years) | 7034 | 59.4 | 11,125 | 59.5 |
| Old-old (70–79 years) | 3525 | 29.8 | 5602 | 29.9 |
| Oldest-old (80+ years) | 1283 | 10.8 | 1982 | 10.6 |
| Sex | ||||
| Male | 5413 | 45.7 | 9076 | 48.5 |
| Female | 6429 | 54.3 | 9633 | 51.5 |
| Education | ||||
| No education/primary not completed | 9987 | 84.3 | 10,149 | 54.3 |
| Primary completed | 914 | 7.7 | 2653 | 14.2 |
| Secondary completed | 804 | 6.8 | 3654 | 19.5 |
| Higher and above | 137 | 1.2 | 2253 | 12.0 |
| Living arrangements | ||||
| Alone | 1156 | 9.8 | 423 | 2.3 |
| With spouse only | 2973 | 25.1 | 2844 | 15.2 |
| With children only | 6972 | 58.9 | 14,579 | 77.9 |
| Others | 741 | 6.3 | 862 | 4.6 |
| Marital status | ||||
| Currently married | 7039 | 59.4 | 11,956 | 63.9 |
| Widowed | 4523 | 38.2 | 6394 | 34.2 |
| Others | 280 | 2.4 | 360 | 1.9 |
| Working status | ||||
| Never worked | 2489 | 21.0 | 5799 | 31.0 |
| Currently working | 4429 | 37.4 | 4599 | 24.6 |
| Currently not working | 4667 | 39.4 | 6112 | 32.7 |
| Retired | 256 | 2.2 | 2198 | 11.7 |
| Social engagement | ||||
| No | 1417 | 12.0 | 1072 | 5.7 |
| Yes | 10,425 | 88.0 | 17,637 | 94.3 |
| Behavioral factors | ||||
| Tobacco consumption | ||||
| No | 6261 | 52.9 | 12,269 | 65.6 |
| Yes | 5581 | 47.1 | 6440 | 34.4 |
| Alcohol consumption | ||||
| No | 9882 | 83.5 | 16,273 | 87.0 |
| Yes | 1960 | 16.6 | 2436 | 13.0 |
| Health factors | ||||
| Body mass indexa | ||||
| Underweight | 4200 | 35.5 | 2785 | 14.9 |
| Normal | 5393 | 45.5 | 8919 | 47.7 |
| Overweight/obese | 1262 | 10.7 | 5313 | 28.4 |
| Self-rated health | ||||
| Good | 5498 | 46.4 | 10,424 | 55.7 |
| Poor | 6344 | 53.6 | 8285 | 44.3 |
| Difficulty in ADL | ||||
| No | 8853 | 74.8 | 14,809 | 79.2 |
| Yes | 2989 | 25.2 | 3900 | 20.9 |
| Difficulty in IADL | ||||
| No | 5599 | 47.3 | 10,616 | 56.8 |
| Yes | 6243 | 52.7 | 8093 | 43.3 |
| Morbidity status | ||||
| 0 | 6711 | 56.7 | 7241 | 38.7 |
| 1 | 3157 | 26.7 | 5885 | 31.5 |
| 2+ | 1974 | 16.7 | 5583 | 29.8 |
| Household factors | ||||
| Religion | ||||
| Hindu | 9899 | 83.6 | 15,328 | 81.9 |
| Muslim | 1292 | 10.9 | 1978 | 10.6 |
| Christian | 343 | 2.9 | 542 | 2.9 |
| Others | 308 | 2.6 | 861 | 4.6 |
| Caste | ||||
| Scheduled Caste | 2957 | 25.0 | 2600 | 13.9 |
| Scheduled Tribe | 1469 | 12.4 | 813 | 4.4 |
| Other Backward Class | 5175 | 43.7 | 8716 | 46.6 |
| Others | 2241 | 18.9 | 6580 | 35.2 |
| Place of residence | ||||
| Rural | 10,566 | 89.2 | 10,370 | 55.4 |
| Urban | 1276 | 10.8 | 8339 | 44.6 |
| Region | ||||
| North | 896 | 7.6 | 3224 | 17.2 |
| Central | 3143 | 26.5 | 3020 | 16.1 |
| East | 3814 | 32.2 | 3109 | 16.6 |
| Northeast | 356 | 3.0 | 554 | 3.0 |
| West | 1597 | 13.5 | 3811 | 20.4 |
| South | 2037 | 17.2 | 4991 | 26.7 |
| Total | 11,842 | 100 | 18,709 | 100 |
asample was low due to missing cases
Table 3 shows the bivariate analysis of percentages distribution of frailty among older adults in poor and non-poor groups. The prevalence of frailty was significantly higher among the older adults in the poor group than in the non-poor group [Difference (poor vs. non-poor): 6.4%; p < 0.001]. Irrespective of age, sex, education, living arrangements, working status, marital status, and social engagements, the poor group has a significantly higher prevalence of frail older adults than the non-poor group. For both poor and non-poor groups, the prevalence of frailty was higher in the older adults who were underweight, never consumed tobacco or alcohol, had poor self-rated health, had difficulties in ADL and IADL, and had more than two comorbidities.
Table 3.
Percentage of frail older adults by their background characteristics in India, 2017–18
| Background characteristics | Poor | Non-poor | Difference | p-value |
|---|---|---|---|---|
| % | % | % | ||
| Individual factors | ||||
| Age | ||||
| Young-old (60–69 years) | 24.6 | 18.8 | 5.8 | 0.001 |
| Old-old (70–79 years) | 41.8 | 34.9 | 6.9 | 0.001 |
| Oldest-old (80+ years) | 58.2 | 50.4 | 7.8 | 0.537 |
| Sex | ||||
| Male | 31.3 | 24.2 | 7.0 | 0.001 |
| Female | 35.1 | 29.5 | 5.6 | 0.001 |
| Education | ||||
| No education/primary not completed | 34.7 | 31.0 | 3.7 | 0.051 |
| Primary completed | 30.8 | 28.3 | 2.5 | 0.210 |
| Secondary completed | 22.2 | 19.7 | 2.5 | 0.002 |
| Higher and above | 18.9 | 19.0 | −0.1 | 0.894 |
| Living arrangements | ||||
| Alone | 42.7 | 32.7 | 10.0 | 0.112 |
| With spouse only | 29.4 | 24.3 | 5.1 | 0.001 |
| With children only | 32.6 | 26.5 | 6.0 | 0.001 |
| Others | 41.9 | 39.5 | 2.4 | 0.878 |
| Marital status | ||||
| Currently married | 28.7 | 22.6 | 6.1 | 0.001 |
| Widowed | 40.7 | 35.3 | 5.3 | 0.002 |
| Others | 33.4 | 23.3 | 10.1 | 0.309 |
| Working status | ||||
| Never worked | 36.5 | 30.4 | 6.2 | 0.001 |
| Currently working | 16.0 | 13.0 | 3.0 | 0.005 |
| Currently not working | 47.6 | 36.2 | 11.4 | 0.001 |
| Retired | 42.6 | 21.5 | 21.1 | 0.001 |
| Social engagement | ||||
| No | 42.7 | 39.6 | 3.1 | 0.023 |
| Yes | 32.1 | 26.2 | 5.9 | 0.004 |
| Behavioral factors | ||||
| Tobacco consumption | ||||
| No | 34.0 | 27.5 | 6.5 | 0.001 |
| Yes | 32.6 | 25.9 | 6.7 | 0.001 |
| Alcohol consumption | ||||
| No | 34.3 | 27.5 | 6.8 | 0.001 |
| Yes | 28.8 | 23.5 | 5.2 | 0.001 |
| Health factors | ||||
| Body mass index | ||||
| Underweight | 42.8 | 38.4 | 4.3 | 0.363 |
| Normal | 33.0 | 28.7 | 4.3 | 0.002 |
| Overweight/obese | 24.5 | 26.2 | −1.7 | 0.033 |
| Self-rated health | ||||
| Good | 25.1 | 20.6 | 4.5 | 0.001 |
| Poor | 40.5 | 34.9 | 5.6 | 0.001 |
| Difficulty in ADL | ||||
| No | 28.1 | 23.4 | 4.7 | 0.001 |
| Yes | 48.9 | 40.4 | 8.5 | 0.001 |
| Difficulty in IADL | ||||
| No | 24.2 | 20.5 | 3.6 | 0.001 |
| Yes | 41.6 | 35.4 | 6.2 | 0.001 |
| Morbidity status | ||||
| 0 | 29.7 | 23.3 | 6.4 | 0.001 |
| 1 | 35.8 | 26.9 | 8.9 | 0.001 |
| 2+ | 41.8 | 31.7 | 10.1 | 0.001 |
| Household factors | ||||
| Religion | ||||
| Hindu | 32.9 | 26.8 | 6.1 | 0.001 |
| Muslim | 36.9 | 30.8 | 6.1 | 0.001 |
| Christian | 33.3 | 25.8 | 7.5 | 0.073 |
| Others | 33.8 | 22.3 | 11.5 | 0.002 |
| Caste | ||||
| Scheduled Caste | 34.6 | 27.1 | 7.5 | 0.001 |
| Scheduled Tribe | 27.9 | 25.4 | 2.6 | 0.017 |
| Other Backward Class | 35.2 | 26.8 | 8.4 | 0.001 |
| Others | 31.0 | 27.3 | 3.7 | 0.001 |
| Place of residence | ||||
| Rural | 33.7 | 27.3 | 6.4 | 0.001 |
| Urban | 30.7 | 26.6 | 4.2 | 0.001 |
| Region | ||||
| North | 27.3 | 26.7 | 0.6 | 0.380 |
| Central | 34.5 | 29.1 | 5.4 | 0.015 |
| East | 35.1 | 32.5 | 2.6 | 0.843 |
| Northeast | 26.6 | 19.9 | 6.6 | 0.012 |
| West | 27.2 | 20.9 | 6.3 | 0.009 |
| South | 37.0 | 27.8 | 9.1 | 0.001 |
| Total | 33.4 | 27.0 | 6.4 | 0.001 |
Differences: Poor - Non poor; p-value based on proportion test
Table 4 presents the unadjusted and adjusted logistic regression estimates for frailty among Indian older adults. In model-I, older adults in the poorest group were 41% more likely to be frail than those in the richest category [OR = 1.41; 95% CI: 1.31, 1.52]. Similar results were obtained after controlling various individual, behavioral, health, and household factors in model-II [AOR = 1.23; 95% CI: 1.11, 1.38]. Figure 1 shows the concentration curve (CC) for wealth-related inequalities in frailty among older adults. The CC curve lies above the 45-degree line of equality, indicating that frailty was concentrated amongst older adults in the poor group [CI: 0.058].
Table 4.
Logistic regression estimates for frail older adults by their background characteristics in India, 2017–18
| Background characteristics | Model-1 | Model-2 |
|---|---|---|
| UOR (95% CI) | AOR (95% CI) | |
| Wealth Index | ||
| Poorest | 1.41*(1.31,1.52) | 1.23*(1.11,1.38) |
| Poorer | 1.27*(1.18,1.38) | 1.19*(1.07,1.32) |
| Middle | 1.17*(1.08,1.27) | 1.09 (0.98,1.20) |
| Richer | 1.13*(1.04,1.22) | 1.03 (0.94,1.12) |
| Richest | Ref. | Ref. |
Model-2 represents the Adjusted odds ratio (AOR). The model was adjusted for Individual, Behavioral, Health and Household factors; CI Confidence interval; * if p < 0.05
Fig. 1.
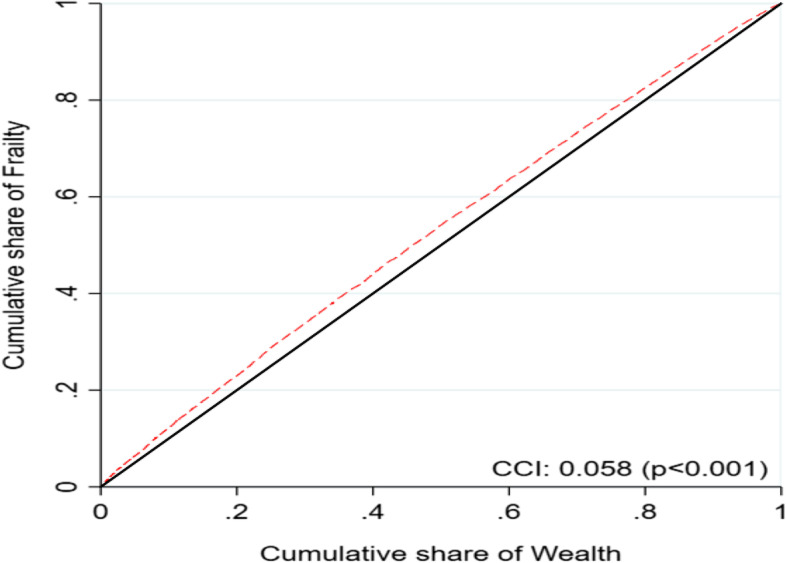
Concentration curve (CC) for wealth-related inequalities in frailty among Indian older adults, 2017–18
Table 5 presents the decomposition analysis results and shows the contribution of various individual, behavioral, health, and household predictors of the respondents in explaining socio-economic inequality in frailty among Indian older adults. The first two columns show the elasticities and concentration index (CI) for each predictor. The rest of the columns show each predictor’s absolute contributions and total percentage contributions to economic inequalities in frailty. The value of the absolute contribution depicts the extent of inequality contributed by a particular explanatory variable. Findings from Table 5 suggest that body mass index, wealth index, educational status, and region were the major and significant contributors to the socio-economic status (SES) related inequalities in frailty, followed by self-rated health and living arrangements. Nearly 45.2% of socio-economic status-related inequality in frailty was contributed by body mass index. Respondent’s educational status was responsible for around 18.1% of inequality in frailty. Moreover, the wealth index and region of residence contributed to about 28.4 and 14.4% of the socio-economic (SES) related inequality, respectively.
Table 5.
Decomposition estimates of physical frailty among older adults by their background characteristics in India, 2017–18
| Background characteristics | Elasticity | CCI | Absolute contribution | Percentage contribution | |
|---|---|---|---|---|---|
| Individual factors | |||||
| Age | |||||
| Young-old (60–69 years) | 0.3 | ||||
| Old-old (70–79 years) | 0.029 | −0.006 | 0.000 | 0.9 | |
| Oldest-old (80+ years) | 0.023 | 0.005 | 0.000 | −0.5 | |
| Sex | |||||
| Male | −0.5 | ||||
| Female | −0.010 | − 0.011 | 0.000 | − 0.5 | |
| Education | |||||
| No education/primary not completed | 18.1 | ||||
| Primary completed | 0.002 | 0.161 | 0.000 | −1.3 | |
| Secondary completed | −0.006 | 0.369 | − 0.002 | 11.0 | |
| Higher and above | −0.003 | 0.601 | −0.002 | 8.4 | |
| Living arrangements | |||||
| Alone | 9.8 | ||||
| With spouse only | −0.008 | −0.166 | 0.001 | −6.4 | |
| With children only | −0.035 | 0.098 | −0.003 | 16.0 | |
| Others | 0.001 | −0.091 | 0.000 | 0.2 | |
| Marital status | |||||
| Currently married | 0.7 | ||||
| Widowed | 0.009 | −0.023 | 0.000 | 0.9 | |
| Others | −0.001 | −0.072 | 0.000 | −0.3 | |
| Working status | |||||
| Never worked | −19.0 | ||||
| Currently working | −0.037 | −0.165 | 0.006 | −28.5 | |
| Currently not working | 0.023 | −0.070 | −0.002 | 7.4 | |
| Retired | −0.001 | 0.458 | 0.000 | 2.1 | |
| Social engagement | |||||
| No | 4.8 | ||||
| Yes | −0.040 | 0.026 | −0.001 | 4.8 | |
| Behavioral factors | |||||
| Tobacco consumption | |||||
| No | −5.2 | ||||
| Yes | −0.009 | −0.130 | 0.001 | −5.2 | |
| Alcohol consumption | |||||
| No | 0.0 | ||||
| Yes | 0.000 | −0.081 | 0.000 | 0.0 | |
| Health factors | |||||
| Body mass index | |||||
| Underweight | 45.2 | ||||
| Normal | −0.030 | −0.008 | 0.000 | −1.1 | |
| Overweight/obese | −0.021 | 0.334 | −0.007 | 46.3 | |
| Self-rated health | |||||
| Good | 10.3 | ||||
| Poor | 0.036 | −0.062 | −0.002 | 10.3 | |
| Difficulty in ADL | |||||
| No | 5.3 | ||||
| Yes | 0.023 | −0.051 | −0.001 | 5.3 | |
| Difficulty in IADL | |||||
| No | 5.7 | ||||
| Yes | 0.023 | −0.052 | −0.001 | 5.7 | |
| Morbidity status | |||||
| 0 | −10.5 | ||||
| 1 | 0.005 | 0.039 | 0.000 | −0.8 | |
| 2+ | 0.010 | 0.209 | 0.002 | −9.7 | |
| Household factors | |||||
| Wealth Index | |||||
| Poorest | 28.4 | ||||
| Poorer | −0.003 | −0.307 | 0.001 | −4.7 | |
| Middle | −0.003 | 0.058 | 0.000 | 0.9 | |
| Richer | −0.004 | 0.415 | −0.002 | 8.3 | |
| Richest | −0.007 | 0.770 | −0.005 | 23.9 | |
| Religion | |||||
| Hindu | 0.5 | ||||
| Muslim | 0.003 | 0.012 | 0.000 | −0.2 | |
| Christian | 0.000 | 0.010 | 0.000 | 0.0 | |
| Others | −0.001 | 0.212 | 0.000 | 0.7 | |
| Caste | |||||
| Scheduled Caste | 2.6 | ||||
| Scheduled Tribe | 0.000 | −0.351 | 0.000 | −0.7 | |
| Other Backward Class | −0.005 | 0.019 | 0.000 | 0.4 | |
| Others | −0.003 | 0.213 | −0.001 | 2.9 | |
| Place of residence | |||||
| Rural | −10.9 | ||||
| Urban | 0.005 | 0.452 | 0.002 | −10.9 | |
| Region | |||||
| North | 14.4 | ||||
| Central | 0.008 | −0.187 | −0.002 | 7.1 | |
| East | 0.010 | −0.215 | − 0.002 | 10.4 | |
| Northeast | −0.001 | −0.013 | 0.000 | 0.0 | |
| West | −0.004 | 0.097 | 0.000 | 2.0 | |
| South | 0.006 | 0.175 | 0.001 | −5.0 | |
| Calculated CCI | −0.022 | 100.0 | |||
| Actual CCI | −0.058 | ||||
| Residual | −0.036 | ||||
CCI Concentration index
Discussion
Our results showed substantial socioeconomic disparities in frailty risk among community-dwelling older adults in India. A cross-sectional link between lower SES and frailty has been documented in multiple studies [11, 23, 46–49]. Similarly, older adults belonging to the poorest category had higher risk of frailty than those from rich households; education, living arrangements, BMI status and health variables including SRH, multimorbidity, ADL/IADL difficulties explained most of this disparity.
Longitudinal studies have revealed that lower education predicted a higher risk of frailty in older adults, and in some studies, lower educated as compared with higher educated older adults had a higher risk of worsening in the state of frailty [10, 14, 50]. Consistent with the literature, we found a higher risk of measured frailty in lower educated older individuals. However, the contribution of educational gradient in frailty was slightly lesser than the household economic gradient. On the other hand, the observed contribution of education to the socioeconomic inequalities in late-life frailty in our study can be explained by the fact that education can have positive impact on the attitudes and health behaviors which in turn can influence the decisions regarding the health of the older people [48]. Similarly, economically poor individuals becoming more frail compared to those from higher economic background may be attributed to the financial limitations that can limit the use of health care resources whereas, having adequate resources may help older people with early detection of age-related physical limitations and compensate for their incapacities by spending on specific health services that can be availed at home and other care facilities [51]. Nevertheless, the possibility of a reverse causation, where health status may determine the socioeconomic position of the people also should be taken into account while interpreting the findings.
Social engagements appear to reduce the rate of physical deficits in older populations, as has been observed in previous studies [52, 53], and social frailty is known to be a major risk factor for physical frailty [54]. In parallel with these findings, socially engaged older individuals in the present study had lower prevalence of frailty and the social engagement contributed to wealth-based inequality in frailty among older adults. According to the social capital theory, social engagement is an important tool for older adults to obtain the social resources which will have a positive impact on health and well-being among older people [55]. At the same time, marriage is considered as a central resource for social support for older individuals due to the narrowing of social networks in later life [56]. Supporting this, current results showed that the prevalence of frailty was higher in widowed older adults among poor and non-poor alike and the contribution of marital status to the observed inequality in frailty was substantially low.
In the earlier studies, there is evidence of the social gradient in the risk of tobacco use and heavy alcohol drinking which are found to be related to developing physical frailty [57, 58]. However, in our study, tobacco use and alcohol consumption accounted for very little of the frailty risk in old age which needs to be further investigated. Regarding our results on the contribution of BMI status towards the inequalities in frailty, they are in line with studies that reported that there is a strong association between BMI and physical frailty and the risk is higher among socioeconomically poor older adults [59, 60]. Although it was studied with the cross-sectional design which prohibits any causal inferences, the current finding suggests that maintaining a healthy body weight throughout individuals’ life course is important for healthy aging. With regards to other health factors, results followed the same direction although SRH explained 10.3% of the excess risk of frailty linked to a poor rating of health. Similarly, functional difficulties in ADL and IADL together contributed to 11% of the observed inequality in physical frailty in old age, suggesting that a broader assessment of frailty by considering deficits in multiple health and functional domains may bring out different results. Furthermore, possible pathways explaining the deleterious effects of socioeconomic adversity on physical frailty including cultural and environmental factors have to be further investigated.
The major strength of this study is the sizeable sample of older population which is nationally-representative. The large number of potential confounders considered in the study adds to the merits of the study. However, this study considered only cross-sectional relationships between socioeconomic and health characteristics of the participants and their physical frailty. Temporal relationships between the onset of frailty as an outcome and socioeconomic characteristics and the absolute contributions of several factors to the poor and non-poor disparities in frailty were not examined in the present study. Thus, further studies with follow-up data from upcoming waves of LASI survey are required. Moreover, although the association between socioeconomic status and weight change among people in developing countries is inconsistent across studies [61], the item of weight loss in the physical frailty may capture some information about the household economic status (i.e. the respondent did not have enough food in the household), which could be driving some of the associations between the primary exposure and the outcome in this study. Future research should also consider psychosocial variables such as mistreatment, everyday discrimination, social networks and cognitive functioning, and further anthropometric biomarkers including waist circumference and waist-hip ratio among other factors.
Conclusion
The study found a higher risk of physical frailty in older adults with poor socioeconomic status. This disparity was predominantly explained by lower levels of education, adverse BMI status, poor SRH, difficulty in ADL and IADL and higher rates of multimorbidity in older individuals with lower socioeconomic status. Results suggest the need for formulating effective prevention and intervention strategies to decelerate the development of physical frailty among older adults in India, especially those with poor socioeconomic background.
Supplementary Information
Acknowledgements
Not applicable.
Abbreviations
- AOR
Adjusted odds ratio
- CI
Confidence interval
- CCI
Concentration index
- BMI
Body mass index
- ADL
Activities of daily living
- IADL
Instrumental activities of daily living
- MPCE
Monthly per capita consumption expenditure
Authors’ contributions
Conceived and designed the research paper: PS, SS, TM, and AB; analyzed the data: SS; Contributed agents/materials/analysis tools: PS, TM, and AB; Wrote the manuscript: PS, AB, TM, DD and SS. All authors read, reviewed and approved the manuscript.
Funding
No funding was received for the study.
Availability of data and materials
The study uses secondary data which is available on reasonable request through https://www.iipsindia.ac.in/content/lasi-wave-i.
Declarations
Ethics approval and consent to participate
The survey agencies that conducted the field survey for the data collection have collected prior informed consent (written and verbal) from the respondent. The Indian Council of Medical Research (ICMR) extended the necessary guidance and ethical approval for conducting the LASI survey. All the steps/ methods were performed in accordance with the relevant guidelines and regulations.
Consent for publication
The administrative permission to access and use the data for the present study was taken from the International Institute for Population Sciences, Mumbai, which conducted the LASI survey.
Competing interests
The authors declare that there is no competing interest
Footnotes
Publisher’s Note
Springer Nature remains neutral with regard to jurisdictional claims in published maps and institutional affiliations.
Contributor Information
Priya Saravanakumar, Email: Priya.Saravanakumar@uts.edu.au.
Arun Balachandran, Email: arunbal3@umd.edu.
T. Muhammad, Email: muhammad.iips@gmail.com
Drishti Drishti, Email: drishti030410@gmail.com.
Shobhit Srivastava, Email: shobhitsrivastava889@gmail.com.
References
- 1.Fried LP, Tangen CM, Walston J, et al. Frailty in older adults: evidence for a phenotype. J Gerontol Ser A Biol Med Sci. 2001;56:M146–M157. doi: 10.1093/gerona/56.3.m146. [DOI] [PubMed] [Google Scholar]
- 2.Cawthon PM, Marshall LM, Michael Y, et al. Frailty in older men: prevalence, progression, and relationship with mortality. J Am Geriatr Soc. 2007;55:1216–1223. doi: 10.1111/j.1532-5415.2007.01259.x. [DOI] [PubMed] [Google Scholar]
- 3.Topinková E. Aging, disability and frailty. Ann Nutr Metab. 2008;52:6–11. doi: 10.1159/000115340. [DOI] [PubMed] [Google Scholar]
- 4.Ensrud KE, Ewing SK, Cawthon PM, et al. A comparison of frailty indexes for the prediction of falls, disability, fractures, and mortality in older men. J Am Geriatr Soc. 2009;57:492–498. doi: 10.1111/j.1532-5415.2009.02137.x. [DOI] [PMC free article] [PubMed] [Google Scholar]
- 5.Morley JE, Vellas B, Van Kan GA, et al. Frailty consensus: a call to action. J Am Med Dir Assoc. 2013;14:392–397. doi: 10.1016/j.jamda.2013.03.022. [DOI] [PMC free article] [PubMed] [Google Scholar]
- 6.Wilson JF. Frailty-and its dangerous effects-might be preventable. Ann Intern Med. 2004;141(6):489. doi: 10.7326/0003-4819-141-6-200409210-00035. [DOI] [PubMed] [Google Scholar]
- 7.Collard RM, Boter H, Schoevers RA, et al. Prevalence of frailty in community-dwelling older persons: a systematic review. J Am Geriatr Soc. 2012;60:1487–1492. doi: 10.1111/j.1532-5415.2012.04054.x. [DOI] [PubMed] [Google Scholar]
- 8.Van Doorslaer E, Wagstaff A, Bleichrodt H, et al. Income-related inequalities in health: some international comparisons. J Health Econ. 1997;16:93–112. doi: 10.1016/s0167-6296(96)00532-2. [DOI] [PubMed] [Google Scholar]
- 9.Buckinx F, Rolland Y, Reginster J-Y, et al. Burden of frailty in the elderly population: perspectives for a public health challenge. Arch Public Health. 2015;73:1–7. doi: 10.1186/s13690-015-0068-x. [DOI] [PMC free article] [PubMed] [Google Scholar]
- 10.Etman A, Burdorf A, Van der Cammen TJM, et al. Socio-demographic determinants of worsening in frailty among community-dwelling older people in 11 European countries. J Epidemiol Community Health. 2012;66:1116–1121. doi: 10.1136/jech-2011-200027. [DOI] [PubMed] [Google Scholar]
- 11.Szanton SL, Seplaki CL, Thorpe RJ, et al. Socioeconomic status is associated with frailty: the women’s health and aging studies. J Epidemiol Community Health. 2010;64:63–67. doi: 10.1136/jech.2008.078428. [DOI] [PMC free article] [PubMed] [Google Scholar]
- 12.Casale-Martínez RI, Navarrete-Reyes AP, Ávila-Funes JA. Social determinants of frailty in elderly Mexican community-dwelling adults. J Am Geriatr Soc. 2012;60:800–802. doi: 10.1111/j.1532-5415.2011.03893.x. [DOI] [PubMed] [Google Scholar]
- 13.Franse CB, Van Grieken A, Qin L, et al. Socioeconomic inequalities in frailty and frailty components among community-dwelling older citizens. PLoS One. 2017;12:1–15. doi: 10.1371/journal.pone.0187946. [DOI] [PMC free article] [PubMed] [Google Scholar]
- 14.Hoogendijk EO, van Hout HPJ, Heymans MW, et al. Explaining the association between educational level and frailty in older adults: results from a 13-year longitudinal study in the Netherlands. Ann Epidemiol. 2014;24:538–544.e2. doi: 10.1016/j.annepidem.2014.05.002. [DOI] [PubMed] [Google Scholar]
- 15.Hoogendijk E, Groenou MB, Tilburg T, et al. Educational differences in functional limitations: comparisons of 55-65-year-olds in the Netherlands in 1992 and 2002. Int J Public Health. 2008;53:281–289. doi: 10.1007/s00038-008-8079-9. [DOI] [PubMed] [Google Scholar]
- 16.Cho J, Lee I, Park SH, et al. Socioeconomic Status, frailty, and all-cause mortality in Korean older adults: A 3-year population-based prospective study. BioMed Res Int. 2017. Epub ahead of print 2017. 10.1155/2017/1903589. [DOI] [PMC free article] [PubMed]
- 17.Kristensen P. Inequalities in health, social causation and the role of occupation. Scand J Work Environ Health. 2008;34:235. doi: 10.5271/sjweh.1273. [DOI] [PubMed] [Google Scholar]
- 18.Park E-O, Song H-J. Differences and inequalities in health status among social class classified by occupation and job status. Korean J Occup Health Nurs. 2003;12:171–176. [Google Scholar]
- 19.Baeten S, Van Ourti T, Van Doorslaer E. Rising inequalities in income and health in China: who is left behind? J Health Econ. 2013;32:1214–1229. doi: 10.1016/j.jhealeco.2013.10.002. [DOI] [PMC free article] [PubMed] [Google Scholar]
- 20.Karlsdotter K, Martín JJM, del Amo González MPL. Multilevel analysis of income, income inequalities and health in Spain. Soc Sci Med. 2012;74:1099–1106. doi: 10.1016/j.socscimed.2011.12.020. [DOI] [PubMed] [Google Scholar]
- 21.Huijts T, Eikemo TA, Skalická V. Income-related health inequalities in the Nordic countries: examining the role of education, occupational class, and age. Soc Sci Med. 2010;71:1964–1972. doi: 10.1016/j.socscimed.2010.09.021. [DOI] [PubMed] [Google Scholar]
- 22.Fujino Y, Kubo T, Matsuda S. Health inequalities and occupational health. J UOEH. 2013;35:177–183. doi: 10.7888/juoeh.35.177. [DOI] [PubMed] [Google Scholar]
- 23.Lang IA, Hubbard RE, Andrew MK, et al. Neighborhood deprivation, individual socioeconomic status, and frailty in older adults. J Am Geriatr Soc. 2009;57:1776–1780. doi: 10.1111/j.1532-5415.2009.02480.x. [DOI] [PubMed] [Google Scholar]
- 24.Stolz E, Mayerl H, Waxenegger A, et al. Explaining the impact of poverty on old-age frailty in Europe: material, psychosocial and behavioural factors. Eur J Public Health. 2017;27:1003–1009. doi: 10.1093/eurpub/ckx079. [DOI] [PMC free article] [PubMed] [Google Scholar]
- 25.Shetty P. Grey matter: ageing in developing countries. Lancet. 2012;379:1285–1287. doi: 10.1016/s0140-6736(12)60541-8. [DOI] [PubMed] [Google Scholar]
- 26.United Nation . World population ageing 2017 report. 2017. [Google Scholar]
- 27.Clegg A, Young J, Iliffe S, et al. Frailty in elderly people. Lancet. 2013;381:752–762. doi: 10.1016/S0140-6736(12)62167-9. [DOI] [PMC free article] [PubMed] [Google Scholar]
- 28.Biritwum RB, Minicuci N, Yawson AE, et al. Prevalence of and factors associated with frailty and disability in older adults from China, Ghana, India, Mexico, Russia and South Africa. Maturitas. 2016;91:8–18. doi: 10.1016/j.maturitas.2016.05.012. [DOI] [PubMed] [Google Scholar]
- 29.Siriwardhana DD, Hardoon S, Rait G, et al. Prevalence of frailty and prefrailty among community-dwelling older adults in low-income and middle-income countries: a systematic review and meta-analysis. BMJ Open. 2018;8:1–18. doi: 10.1136/bmjopen-2017-018195. [DOI] [PMC free article] [PubMed] [Google Scholar]
- 30.Wang J, Hulme C. Frailty and socioeconomic status: a systematic review. J Public Health Res. 2021;10(3). [DOI] [PMC free article] [PubMed]
- 31.International Institute for Population Sciences (IIPS), NPHCE, MoHFW, et al. Longitudinal Ageing Study in India (LASI) Wave 1. Mumbai: International Institute for Population Sciences (IIPS); 2020.
- 32.Fried LP, Tangen CM, Walston J, et al. Frailty in older adults: evidence for a phenotype. J Gerontol Series A Biol Sci Med Sci. 2001;56:146–157. doi: 10.1093/gerona/56.3.m146. [DOI] [PubMed] [Google Scholar]
- 33.Kashikar Y, Nagarkar A. Prevalence and determinants of frailty in older adults in India. Indian J Gerontol. 2016;30(3).
- 34.Chaudhary M, Chowdhary R. Age and socioeconomic gradients in frailty among older adults in India. J Public Health (Germany) 2019;27:675–685. [Google Scholar]
- 35.Kendhapedi KK, Devasenapathy N. Prevalence and factors associated with frailty among community-dwelling older people in rural Thanjavur district of South India: a cross-sectional study. BMJ Open. 9. Epub ahead of print 2019. 10.1136/bmjopen-2019-032904. [DOI] [PMC free article] [PubMed]
- 36.Buchman AS, Wilson RS, Bienias JL, et al. Change in frailty and risk of death in older persons. Exp Aging Res. 2009;35:61–82. doi: 10.1080/03610730802545051. [DOI] [PMC free article] [PubMed] [Google Scholar]
- 37.Khezrian M, Myint PK, McNeil C, et al. A review of frailty syndrome and its physical, cognitive and emotional domains in the elderly. Geriatrics. 2017;2:36. doi: 10.3390/geriatrics2040036. [DOI] [PMC free article] [PubMed] [Google Scholar]
- 38.Kiely DK, Cupples LA, Lipsitz LA. Validation and comparison of two frailty indexes: the MOBILIZE Boston study. J Am Geriatr Soc. 2009;57:1532–1539. doi: 10.1111/j.1532-5415.2009.02394.x. [DOI] [PMC free article] [PubMed] [Google Scholar]
- 39.Rutstein SO, Staveteig S. Making the demographic and health surveys wealth index comparable. 2014. [Google Scholar]
- 40.Srivastava S, J VJK, Dristhi D, et al. Interaction of physical activity on the related measures association of obesity- with multimorbidity among older adults : a population- based cross- sectional study in India. BMJ Open Epub ahead of print 2021. 10.1136/bmjopen-2021-050245. [DOI] [PMC free article] [PubMed]
- 41.Sharma P, Maurya P, Muhammad T. Number of chronic conditions and associated functional limitations among older adults: cross-sectional findings from the longitudinal aging study in India. BMC Geriatr. 2021;21:1–12. doi: 10.1186/s12877-021-02620-0. [DOI] [PMC free article] [PubMed] [Google Scholar]
- 42.O’donnell O, Van Doorslaer E, Wagstaff A, et al. Analyzing health equity using household survey data: a guide to techniques and their implementation. The World Bank; 2007. [Google Scholar]
- 43.Konings P, Harper S, Lynch J, et al. Analysis of socioeconomic health inequalities using the concentration index. Int J Public Health Epub ahead of print. 2010. 10.1007/s00038-009-0078-y. [DOI] [PubMed]
- 44.Kakwani N, Wagstaff A, Van Doorslaer E. Socioeconomic inequalities in health: measurement, computation, and statistical inference. J Econometrics Epub ahead of print. 1997. 10.1016/S0304-4076(96)01807-6.
- 45.Wagstaff A, Paci P, van Doorslaer E. On the measurement of inequalities in health. Soc Sci Med. 1991;33:545–557. doi: 10.1016/0277-9536(91)90212-u. [DOI] [PubMed] [Google Scholar]
- 46.Alvarado BE, Zunzunegui MV, Béland F, et al. Life course social and health conditions linked to frailty in latin american older men and women. J Gerontol Series A Biol Sci Med Sci. 2008;63:1399–1406. doi: 10.1093/gerona/63.12.1399. [DOI] [PubMed] [Google Scholar]
- 47.López SR, Montero P, Carmenate M. Educational inequalities and frailty in Spain: what is the role of obesity? J Frailty Aging. 2014;3:120–5. doi: 10.14283/jfa.2014.12. [DOI] [PubMed] [Google Scholar]
- 48.Herr M, Robine JM, Aegerter P, et al. Contribution of socioeconomic position over life to frailty differences in old age: comparison of life-course models in a French sample of 2350 old people. Ann Epidemiol. 2015;25:674–680.e1. doi: 10.1016/j.annepidem.2015.05.006. [DOI] [PubMed] [Google Scholar]
- 49.Woo J, Goggins W, Sham A, et al. Social determinants of frailty. Gerontology. 2005;51:402–408. doi: 10.1159/000088705. [DOI] [PubMed] [Google Scholar]
- 50.Espinoza SE, Jung I, Hazuda H. Frailty transitions in the San Antonio longitudinal study of aging. J Am Geriatr Soc. 2012;60:652–660. doi: 10.1111/j.1532-5415.2011.03882.x. [DOI] [PMC free article] [PubMed] [Google Scholar]
- 51.Hubbard RE, Goodwin VA, Llewellyn DJ, et al. Frailty, financial resources and subjective well-being in later life. Arch Gerontol Geriatr. 2014;58:364–369. doi: 10.1016/j.archger.2013.12.008. [DOI] [PubMed] [Google Scholar]
- 52.Wang Y, Chen Z, Zhou C. Social engagement and physical frailty in later life: does marital status matter? BMC Geriatr. 2021;21:1–11. doi: 10.1186/s12877-021-02194-x. [DOI] [PMC free article] [PubMed] [Google Scholar]
- 53.Xie B, Ma C. Effect of social participation on the development of physical frailty: do type, frequency and diversity matter? Maturitas. 2021;151:48–54. doi: 10.1016/j.maturitas.2021.06.015. [DOI] [PubMed] [Google Scholar]
- 54.Makizako H, Shimada H, Doi T, et al. Social frailty leads to the development of physical frailty among physically non-frail adults: A four-year follow-up longitudinal cohort study. Int J Environ Res Public Health. 2018;15. Epub ahead of print. 10.3390/ijerph15030490. [DOI] [PMC free article] [PubMed]
- 55.Liu J, Rozelle S, Xu Q, et al. Social engagement and elderly health in China: Evidence from the China health and retirement longitudinal survey (CHARLS). Int J Environ Res Public Health. 2019;16. Epub ahead of print. 10.3390/ijerph16020278. [DOI] [PMC free article] [PubMed]
- 56.Bierman A. Marital status as contingency for the effects of neighborhood disorder on older adults’ mental health. J Gerontol Series B Psychol Sci Soc Sci. 2009;64:425–434. doi: 10.1093/geronb/gbp010. [DOI] [PMC free article] [PubMed] [Google Scholar]
- 57.Syddall H, Roberts HC, Evandrou M, et al. Prevalence and correlates of frailty among community-dwelling older men and women: findings from the Hertfordshire cohort study. Age Ageing. 2009;39:197–203. doi: 10.1093/ageing/afp204. [DOI] [PMC free article] [PubMed] [Google Scholar]
- 58.Ávila-Funes JA, Helmer C, Amieva H, et al. Frailty among community-dwelling elderly people in France: the three-city study. J Gerontol - Series A Biol Sci Med Sci. 2008;63:1089–1096. doi: 10.1093/gerona/63.10.1089. [DOI] [PMC free article] [PubMed] [Google Scholar]
- 59.Rietman ML, van der a DL, van Oostrom SH, et al. The association between BMI and different frailty domains: a U-shaped curve? J Nutr Health Aging. 2018;22:8–15. doi: 10.1007/s12603-016-0854-3. [DOI] [PubMed] [Google Scholar]
- 60.Gobbens RJJ, van Assen MALM, Luijkx KG, et al. The Tilburg frailty indicator: psychometric properties. J Am Med Dir Assoc. 2010;11:344–355. doi: 10.1016/j.jamda.2009.11.003. [DOI] [PubMed] [Google Scholar]
- 61.Ball K, Crawford D. Socioeconomic status and weight change in adults: a review. Soc Sci Med. 2005;60:1987–2010. doi: 10.1016/j.socscimed.2004.08.056. [DOI] [PubMed] [Google Scholar]
Associated Data
This section collects any data citations, data availability statements, or supplementary materials included in this article.
Supplementary Materials
Data Availability Statement
The study uses secondary data which is available on reasonable request through https://www.iipsindia.ac.in/content/lasi-wave-i.