

Abstract
Background
Several lifestyle factors are associated with an increased risk of colorectal cancer (CRC). Although lifestyle factors co‐occur, in most previous studies these factors have been studied focusing upon a single risk factor or assuming independent effects between risk factors.
Aim
To examine the pairwise effects and interactions of smoking, alcohol consumption, physical inactivity, and body mass index (BMI) with risk of subsequent colorectal cancer (CRC).
Methods and results
We used METCA cohort data (pooled data from seven population‐based Finnish health behavior survey studies during years 1972–2015) consisting of 171 063 women and men. Participants' smoking, alcohol consumption, physical inactivity and BMI measures were gathered, and participants were categorized into those exposed and those not exposed. The incidence of CRC was modeled by Poisson regression with main and interaction effects of key lifestyle factors.
The cohort members were followed‐up through register linkage to the Finnish Cancer Registry for first primary CRC case until the end of 2015. Follow‐up time was 1715, 690 person years.
The highest pairwise CRC risk was among male smokers who had overweight (BMI ≥ 25 kg/m2) (HR 1.75, 95% CI 1.36–2.26) and women who had overweight and consumed alcohol (HR 1.45, 95% CI 1.14–1.85). Overall, among men the association of lifestyle factors and CRC risk was stronger than among women. In men, both having overweight and being a smoker combined with any other adverse lifestyle factor increased CRC risk. Among women, elevated CRC risks were observed for those who were physically inactive and who consumed alcohol or had overweight. No statistically significant interactions were detected between pairs of lifestyle factors.
Conclusions
This study strengthens the evidence of overweight, smoking, and alcohol consumption as CRC risk factors. Substantial protective benefits in CRC risk can be achieved by preventing smoking, maintaining BMI to <25 kg/m2 and not consuming alcohol.
Keywords: alcohol, cohort study, colorectal cancer, obesity, physical inactivity, smoking
1. INTRODUCTION
Colorectal cancers (CRC) are the third most common site for new cancers and second most common cause of cancer deaths in the world. 1 , 2 Although the overall growth rate in CRC incidence has somewhat slowed 3 the incidence and mortality still increase even in many high‐income countries 4 and this global trend is also observed in Finland. 5 , 6
There are several reasons behind the increasing CRC incidence. Increasing age is the single most important risk factor for CRC, and the increasing life expectancy will increase the number of colorectal cancers in the future. 7 Males have a higher incidence of colorectal cancer than females. 7 Several adverse lifestyle factors are associated with an increased risk of CRC. 8 , 9 , 10 , 11 , 12 There is convincing evidence on alcohol consumption, with risk for CRC increasing noticeably with heavy drinking. 9 , 10 Obesity, especially abdominal obesity, increases the risk 11 whereas those who are physically active have lower risk. 12 There is sufficient evidence in humans that tobacco smoking causes colorectal cancer. 13 Studies have suggested beneficial and protective effects of diets rich in, for example, fruits, vegetables, fish, fiber, and whole grain, while processed and red meat are associated with increased CRC risk. 9 Family history of CRC increases the risk. Despite twofold risk for CRC for those with first‐degree relatives with CRC, the vast majority of CRC cancers are sporadic, with only <5% of CRC's being related to known genetic mutations (e.g., FAP or HNPCC). 14
Frequently the influence of lifestyle factors in CRC have been studied focusing upon a single risk factor or assuming independent effects between risk factors in statistical modeling, without properly exploring possible combined effects of risk factors and their interactions. However, in the EPIC‐cohort study with more than 300 000 subjects from nine European countries, two healthy lifestyle factors combined reduced the CRC risk by 13% on average, compared to persons with none of the five studied lifestyle factors (alcohol, physical activity, diet, smoking, and overweight/obesity). 15 None of the pairwise healthy lifestyle factor effects were significant. The combined effects of lifestyle factors have been studied in large studies in the United States 16 , 17 and in Denmark, 18 reporting higher CRC risk with increasing number of risk factors and larger risk in men than women. Previous studies on interactions between lifestyle factors with regard to CRC risk are few. A recent Canadian study found an additive effect between alcohol consumption and smoking 19 and the same finding was reported in a smaller South‐Korean study. 20 A pooled study consisting of five cohort studies and three population‐based case–control studies 21 found some evidence on interaction between body weight and smoking in relation to CRC, but this finding has not been confirmed.
The aim of this study was to examine the pairwise effects and interaction of smoking, alcohol consumption, physical inactivity and body mass index (BMI) with the risk of primary CRC in a prospective cohort setting.
2. MATERIAL AND METHODS
We used data pooled for the METCA consortium (Prospective METa Cohort Study of Cancer Burden in Finland). 22 The study covers the following survey studies monitoring health behavior between 1972 and 2015: The National FINRISK Study conducted at 5‐year intervals since 1972 (FINRISK), 23 The Adult Health, Wellbeing, and Services Studies 1 from 2010 to 2011 (ATH1) and 2 from 2012 to 2015 (ATH2), 24 The Health 2000 Survey (H2000), 25 The Finnish Mobile Clinic Health Survey from 1972 to 1977 (FMCF), 26 The Mini‐Finland Health Survey from 1978 to 1980 (MFH), 26 the Helsinki Health Study from 2000 to 2002 (HHS) 27 and The Helsinki Birth Cohort Study (HBCS) 28 (Appendix S1 in Data S1). Exposure assessment includes both survey data and health examinations.
Here, the largest individual study cohorts are ATH1 and ATH2 (n = 77 241, see Appendix S1 in Data S1) and FINRISK (n = 52 661), but longest follow‐up comes from the FMCF (390 884 person‐years), MFH (142 183), and FINRISK (839 400).
Smoking, alcohol consumption, physical inactivity, and BMI measures were harmonized between the study cohorts and categorized into those exposed and those not exposed. Smoking was grouped into never‐smokers (reference, not exposed) and smokers (ex‐ and current smokers). Regarding alcohol use, subjects reporting using 0 g of alcohol per week (MFH, HHS), per month (FMCF), never use of alcohol (FINRISK, H2000, HBCS), or not using alcohol within the past year (ATH) were categorized as non‐exposed. Accordingly, subjects reporting any, ever, or current use of alcohol were considered as exposed. Applicable information on alcohol use was not available in the FINRISK 1982 survey. Physically inactive (no leisure time physical activity) were categorized into exposed and physically active into not exposed (reference, those with any leisure time activity). Body mass index was divided into those with BMI < 25 kg/m2 (reference; not exposed) and having overweight (BMI ≥ 25 kg/m2, exposed). Missing item values of a covariate were handled as a separate category in the analysis.
The cohort members were followed‐up through individual register linkage with personal identity codes to the nation‐wide population‐based Finnish Cancer Registry for cancers and to Statistics Finland or the Population Register Centre for deaths. 29 , 30 The follow‐up started either from the date of baseline survey or the date when the person turns 50 years, which ever occurred latest. The follow‐up continued until the end of 2013 or 2015 (depending on the cohort), death or emigration. 22
In total, 1660 incident primary CRC cancers among 171 063 persons during 1715 690 person‐years were observed (Table 1). Approximately one‐third of men (37%) and 44% of women had BMI < 25 kg/m2 (Table 2). Of men, 16% reported never consuming alcohol, while nearly a third of the women (34%) reported the same. Around 70% of both men (74%) and women (70%) were active during leisure time, and around one third of men (31%) and two thirds of women (65%) were never‐smokers.
TABLE 1.
Summary statistics of study cohort characteristics
| Population characteristics | Total | Men | Women |
|---|---|---|---|
| Years of baseline of harmonized cohort | 1972–2015 | ||
| Number of subjects in harmonized cohort | 171 063 | 76 762 | 94 301 |
| Person years | 1 715 690 | 754 439 | 961 251 |
| First primary CRC | 1660 | 859 | 801 |
| Follow‐up years (median [SD]) | 6 (10) | 6 (10) | 6 (10) |
| Age at baseline in years (mean [SD]) | 57 (16) | 56 (15) | 58 (16) |
| Proportion of men/women (%) | 45/55 |
TABLE 2.
Prevalence of risk factors of study cohort
| Total | Men | Women | |||||
|---|---|---|---|---|---|---|---|
| Risk factors | N | % | N | % | N | % | |
| Smoking | No | 83 469 | 50 | 23 609 | 31 | 59 860 | 65 |
| Yes | 83 591 | 50 | 51 512 | 69 | 32 079 | 35 | |
| Alcohol | No | 43 256 | 26 | 12 227 | 16 | 31 029 | 34 |
| Yes | 122 580 | 74 | 62 703 | 84 | 59 877 | 66 | |
| Weight (kg) | Normal weight (<25 kg/m2) | 67 571 | 41 | 27 630 | 37 | 39 941 | 44 |
| Overweight (> = 25 kg/m2) | 97 929 | 59 | 46 948 | 63 | 50 981 | 56 | |
| Physical inactivity | Active during leisure time | 119 246 | 72 | 55 206 | 74 | 64 040 | 70 |
| Inactive during leisure time | 47 011 | 28 | 19 494 | 26 | 27 517 | 30 | |
For each pair of lifestyle factors we calculated the sum of person years, number of first primary CRC, and age‐standardized incidence rate. The age standardization was performed with direct standardization using the age distribution of the world 1966 population. The hazard ratios (HRs) of lifestyle factors for CRC were estimated using Poisson regression models based on multiplicative hazard functions. Let be the number of cancer cases among persons in age group a,calendar period (5‐year periods) and survey study with values of the four lifestyle factors described by the Poisson distribution where is the cancer incidence rate and is the number of persons years in the stratum. In the first model, we included only the main effects of the lifestyle factors:
| (1) |
where is the baseline hazard and is the multiplicative main effect of factor with value . The baseline hazard was stratified by age (5‐year groups of attained age) and calendar time (5‐year periods) in order to account for variation in the hazard by age and period, and variation in the baseline hazard between studies was modeled by multiplicative study‐specific effects: . In model M1, we assumed the main effects model for the lifestyle factors, that is, the HR of two factors was the product of the HRs of each lifestyle factor, and made the common statistical assumption of proportional hazards, that is, the HRs were constant in time. In an alternative model, M2, the interaction term of each pair of lifestyle factors, excluding the interaction terms where either factor was missing, was added to model M1:
| (2) |
Models M1 and M2 were fitted separately for men and women.
Hazard ratios (HR) of main effects and , pairwise effect and multiplicative interaction are reported with their 95% confidence intervals (CI). In order to test interaction for pairs of lifestyle factors, we compared the fit of models M1 and M2 by using the likelihood ratio test. Heterogeneity between men and women in (i) the effect of each lifestyle factor and (ii) the effects of each pair of lifestyle factors was evaluated by analyzing men and women combined. By using the likelihood ratio test, we compared models where the corresponding effects were assumed to be either sex‐specific or not, and the baseline hazard and the effects of the other lifestyle factors were stratified by sex. p‐Values were adjusted for multiple testing using the method of Benjamini and Hochberg. 31
The study was approved by the Finnish Institute for Health and Welfare (Permit no. THL/1091/6.02.00/2015 and THL/679/6.02.00/2018).
3. RESULTS
Men and women who had overweight had an increased CRC risk (HR 1.24, 95% CI 1.07–1.44 and HR 1.20, 95% CI 1.03–1.39, respectively) when adjusted for age, calendar time, study cohort, and other lifestyle factors (Table 3). Smoking increased CRC risk in men (HR 1.38, 95 CI 1.18–1.63), but not in women (HR 0.98, 95% CI 0.82–1.16). None of the other studied factors were significantly related to CRC risk in men or in women.
TABLE 3.
Adjusted hazard ratios (HR) and 95% confidence intervals (CI) of colorectal cancer lifestyle risk factors
| Men | CI | Women | CI | |||
|---|---|---|---|---|---|---|
| HR a | 2.5% | 97.5% | HR a | 2.5% | 97.5% | |
| Use alcohol vs. no use of alcohol | 1.16 | 0.95 | 1.41 | 1.13 | 0.96 | 1.33 |
| Overweight or obese vs. normal weight | 1.24 | 1.07 | 1.44 | 1.20 | 1.03 | 1.39 |
| Ex‐ or current smoker vs. never smoker | 1.38 | 1.18 | 1.63 | 0.98 | 0.82 | 1.16 |
| No leisure time exercise vs. any leisure time exercise | 1.06 | 0.91 | 1.24 | 1.13 | 0.97 | 1.31 |
Adjusted for study, age, calendar time, and other lifestyle risk factors.
The ordered age‐standardized incidence rates for all lifestyle factor pairs are plotted in Figure 1 by gender. CRC incidence was in general higher in men (ranging from 118 to 61 per 100 000) than in women (ranging from 83 to 46 per 100 000). Men who smoked or had smoked and had overweight had the highest age standardized CRC rate (118 per 100 000, 95% 106–130, Figure 1). In women, the highest age standardized CRC rates were observed in those who smoked and were physical inactive (83 per 100 000, 95% CI 65–106). Women who used alcohol and had overweight had an adjusted incidence rate of 74 per 100 000 (95%CI 65–85).
FIGURE 1.
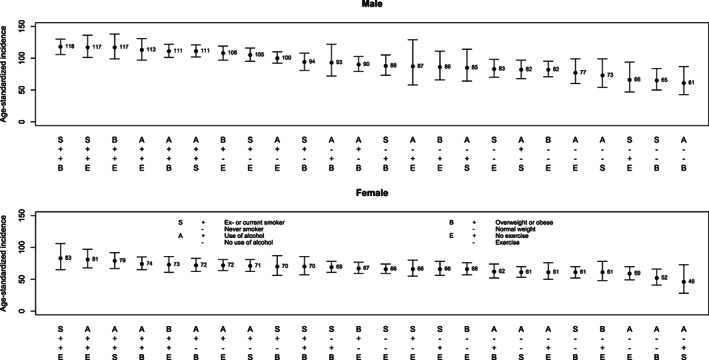
Age‐standardized CRC incidence rate and 95% confidence intervals for pairwise lifestyle factor pairs by sex
The number of CRCs, person‐years and adjusted CRC HR for all lifestyle factor pairs are presented in Table 4 for men and women separately. Men exposed to any two of the four studied lifestyle factors (smoking, use of alcohol, physical inactivity, or having overweight) had significantly elevated HRs compared to men not exposed to these factor pairs. The only exception was in the use of alcohol and physical inactivity, where the pairwise HR was not significantly elevated. Men who smoked or had smoked and had overweight had the highest CRC risk (HR 1.75, 95% CI 1.36–2.26) compared to male never‐smoked with BMI < 25. Women who used alcohol and had overweight had an elevated CRC risk (HR 1.45, 95% CI 1.14–1.85) compared to women with normal weight who did not use alcohol. Women who were physically inactive and consumed alcohol (HR 1.29, 95% CI 1.02–1.63) or had overweight (HR 1.36, 95% CI 1.10–1.67) had significantly elevated CRC risks. Male smokers who had overweight, used alcohol, or were physically inactive had higher HR of CRC than women with similar lifestyle factor pairs (p = .03).
TABLE 4.
Number of colorectal cancers and person‐years, age standardized incidence and adjusted hazard ratios (HR) of colorectal cancer for lifestyle risk factor pairs by sex
| Men | Women | ||||||
|---|---|---|---|---|---|---|---|
| Risk factor pair | Cancers/person‐years | Age standardized incidence | HR (95% CI) | Cancers/person‐years | Age standardized incidence | HR (95% CI) | |
| BMI | Alcohol | ||||||
| Normal | No | 44/50 228 | 61 (43, 87) | 1.00 | 96/142 109 | 52 (41, 66) | 1.00 |
| Normal | Yes | 226/239 678 | 90 (79, 103) | 1.24 (0.91, 1.69) | 191/270 185 | 72 (62, 83) | 1.37 (1.07, 1.75) |
| Overweight | No | 81/62 938 | 93 (72, 122) | 1.35 (0.96, 1.92) | 243/235 737 | 62 (52, 74) | 1.43 (1.13, 1.81) |
| Overweight | Yes | 479/379 666 | 111 (101, 122) | 1.51 (1.11, 2.04) | 241/279 610 | 74 (65, 85) | 1.45 (1.14, 1.85) |
| Interaction | 0.90 (0.62, 1.31) | 0.74 (0.55, 0.99) | |||||
| P‐interaction a | 0.695 | 0.263 | |||||
| Smoking | Alcohol | ||||||
| Never smoker | No | 58/57 148 | 73 (54, 99) | 1.00 | 320/339 945 | 61 (53, 70) | 1.00 |
| Never smoker | Yes | 144/154 866 | 82 (68, 97) | 1.11 (0.82, 1.50) | 264/324 267 | 71 (62, 81) | 1.05 (0.88, 1.26) |
| Ex‐ or current smoker | No | 68/56 674 | 85 (64, 114) | 1.31 (0.93, 1.83) | 25/43 590 | 46 (28, 73) | 0.66 (0.44, 0.99) |
| Ex‐ or current smoker | Yes | 570/472 592 | 111 (102, 121) | 1.56 (1.18, 2.05) | 172/229 540 | 79 (67, 92) | 1.14 (0.93, 1.40) |
| Interaction | 1.08 (0.74, 1.58) | 1.64 (1.04, 2.57) | |||||
| P‐interaction a | 0.764 | 0.263 | |||||
| Exercise | Alcohol | ||||||
| Exercises | No | 89/78 969 | 77 (60, 99) | 1.00 | 194/225 218 | 59 (49, 70) | 1.00 |
| Exercises | Yes | 525/470 693 | 100 (92, 110) | 1.08 (0.86, 1.36) | 307/409 865 | 72 (64, 81) | 1.09 (0.90, 1.33) |
| No exercise | No | 36/33 698 | 87 (58, 129) | 0.88 (0.60, 1.28) | 150/154 296 | 61 (50, 76) | 1.08 (0.87, 1.33) |
| No exercise | Yes | 186/153 177 | 113 (97, 131) | 1.20 (0.92, 1.55) | 132/142 949 | 81 (68, 97) | 1.29 (1.02, 1.63) |
| Interaction | 1.25 (0.83, 1.89) | 1.10 (0.82, 1.47) | |||||
| P‐interaction a | 0.555 | 0.695 | |||||
| BMI | Smoking | ||||||
| Normal | Never smoker | 65/86 486 | 65 (50, 84) | 1.00 | 194/275 640 | 61 (52, 70) | 1.00 |
| Normal | Ex‐ or current smoker | 205/203 335 | 94 (81, 108) | 1.43 (1.09, 1.87) | 92/137 165 | 70 (56, 87) | 1.11 (0.87, 1.42) |
| Overweight | Never smoker | 132/124 317 | 88 (73, 105) | 1.29 (0.97, 1.71) | 384/384 107 | 69 (61, 78) | 1.27 (1.07, 1.52) |
| Overweight | Ex‐ or current smoker | 429/319 072 | 118 (106, 130) | 1.75 (1.36, 2.26) | 100/132 922 | 70 (57, 86) | 1.12 (0.87, 1.43) |
| Interaction | 0.95 (0.69, 1.32) | 0.79 (0.57, 1.09) | |||||
| P‐interaction a | 0.767 | 0.555 | |||||
| Exercise | Smoking | ||||||
| Exercises | Never smoker | 161/164 629 | 83 (70, 98) | 1.00 | 378/443 092 | 66 (59, 74) | 1.00 |
| Exercises | Ex‐ or current smoker | 456/384 939 | 105 (95, 116) | 1.32 (1.10, 1.58) | 124/192 807 | 66 (55, 80) | 0.90 (0.73, 1.12) |
| No exercise | Never smoker | 40/46 441 | 66 (47, 94) | 0.90 (0.64, 1.26) | 207/218 689 | 66 (56, 78) | 1.07 (0.90, 1.27) |
| No exercise | Ex‐ or current smoker | 181/140 984 | 117 (101, 136) | 1.46 (1.18, 1.82) | 72/79 913 | 83 (65, 106) | 1.21 (0.93, 1.56) |
| Interaction | 1.23 (0.85, 1.80) | 1.25 (0.89, 1.75) | |||||
| P‐interaction a | 0.555 | 0.555 | |||||
| Exercise | BMI | ||||||
| Exercises | Normal | 201/219 487 | 82 (71, 95) | 1.00 | 213/303 236 | 66 (57, 76) | 1.00 |
| Exercises | Overweight or obese | 408/325 851 | 108 (97, 119) | 1.21 (1.02, 1.43) | 289/329 123 | 67 (59, 77) | 1.15 (0.96, 1.37) |
| No exercise | Normal | 65/69 565 | 86 (66, 111) | 0.99 (0.75, 1.29) | 76/109 450 | 61 (48, 78) | 1.04 (0.81, 1.33) |
| No exercise | Overweight or obese | 155/114 727 | 117 (99, 138) | 1.33 (1.08, 1.63) | 195/184 515 | 73 (61, 86) | 1.36 (1.10, 1.67) |
| Interaction | 1.11 (0.80, 1.55) | 1.14 (0.84, 1.55) | |||||
| P‐interaction a | 0.695 | 0.689 | |||||
P‐interaction: p‐value for H0: HR (interaction) = 1.00, corrected for multiple comparisons (Benjamini–Hochberg).
Measures of interactions on a multiplicative scale between pairwise lifestyle factors are shown in Table 4 separately for men and women. In men no statistically significant interactions were detected. In women, a positive interaction between smoking and alcohol consumption was found: interaction on the multiplicative scale 1.64 (95% CI 1.04–2.57). The estimated joint effect on the HR scale of smoking and alcohol together was greater (64%) than the product of the estimated effects of smoking and alcohol alone, so that there was positive interaction on the multiplicative scale. 32 A negative interaction (HR 0.74, 95% CI 0.55–0.99) was detected in women between alcohol use and having overweight. This implies that the joint effect of these factors was smaller than the product of these two effects alone. However, after correcting for multiple comparisons, none of the interactions remained statistically significant between pairs of lifestyle factors.
When excluding the cohorts with shortest follow‐ups (ATH1 and ATH2) the main effect of alcohol in men changed from HR 1.16 to HR 1.36 and it became statistically significant. The effects of all other lifestyle factors did not change substantially.
4. DISCUSSION
We found several significantly elevated CRC risks of pairwise combinations of major lifestyle factors, especially in males. The highest risk was among male smokers who had overweight. In women, the highest risk was among those who consumed alcohol and in addition had overweight. Moreover, among men both having overweight and smoking combined with any other studied adverse lifestyle factor increased the risk. In women, an elevated risk was found among physically inactive women who consumed alcohol or had overweight.
In our study, smoking was associated with CRC only among men. This may be due to the long carcinogenic pathway requiring decades of exposure to tobacco smoke to result in CRC. 33 Follow‐up started in the 1970s, when smoking was less common among women than in later years. It may be that the women in our cohort have not been exposed to tobacco smoke long enough for CRC to develop during follow‐up. Our results on overweight are in line with previous studies. 11 , 34 After exclusion of cohorts with short follow‐ups our findings on alcohol are in line with previous studies. 35 Physical activity has been shown to reduce the risk of colon cancer 12 while the evidence is less convincing for rectal cancers. 36 Our findings support this as we see a CRC risk reduction that does not reach statistical significance.
We found several lifestyle factor pairs to be significantly associated with an increased CRC risk when compared to individuals with neither of the factors. The previous EPIC study did not find any of the two lifestyle factors being associated with reduced CRC risk, when compared to individuals with no or only one healthy lifestyle factor. 15 In the EPIC study, significant protective effects were observed only with three or more healthy lifestyle factors combined. Comparing our results with EPIC is not straight forward as the reference groups were different and our study did not have information on diet. The reference group in the EPIC study consisted of individuals with no healthy lifestyle factors, while in our study the individuals in the reference group could have unfavorable or favorable factors except for those included in studied lifestyle factor pair. Furthermore, we focused on pairwise effects of lifestyle factors, instead of exploring the effects with more than two factors combined. In our study, the follow‐up periods start between 1970 and 2015, while in the EPIC study follow‐up started between 1992 and 2000, allowing us a much longer incubation period.
We detected no statistically significant interactions between pairs of lifestyle factors, when adjusted for multiple comparisons. The highest interactive effect was in women, where smoking combined with alcohol consumption resulted in much higher CRC risks than was expected based on their individual effects. Two recent studies have found a synergistic effect between alcohol consumption and smoking regarding CRC risk. 19 , 20 It has been proposed that alcohol may act as a solvent for tobacco carcinogens thus making tobacco more toxic. 37
Studies in the METCA cohort have varying follow‐up times, which could influence the results. We have previously performed sensitivity analyses for time dependence of exposure effects, where we excluded the first 2 years of follow‐up or follow‐up longer than 10 years. Neither detection nor information bias had a notable effect in the reported results. 22
In 2018, around 1.8 million people were diagnosed with CRC globally 38 and the prediction is that CRC rates continue to increase with increased economic development. In Finland, the average age‐standardized incidence rate for CRC was 29.7/100 000 in men and 22.2/100 000 in women in 2015–2019 5 and the incidence has increased on average 0.7% in men 1990–2019 and 1.5% between 2011 and 2019 in women. 5 The incidence increase has been steepest among men with basic education (from 16.7/100 000 in 1976–1979 to 31.8 in 2010–2014). 6 The results from our study may be generalizable to western populations.
The strengths of our study include a large sample size, high‐quality exposure data, and reliable cancer information from seven decades. Cancer diagnoses are based on conclusive register data on all diagnosed cancers in Finland. 29 , 30 We had a long follow‐up time period and practically no losses to follow‐up. This enables reliable evaluation of exposures with long effect latency. Our cohort studies include key lifestyle factors with validated 6 measures. The likely influence of dichotomization of key lifestyle factors would be an underestimation of true HRs for CRC.
A limitation of our study was that the data for exposures were mostly self‐reported and gathered in a single time‐point. However, some of the health data were based on face‐to‐face health examination. The self‐reporting may have affected some factors more severely, such as reporting alcohol consumption and weight. During long recruitment time, the prevalence of lifestyle factors has also changed somewhat. Long recruitment and follow‐up time is both an advantage and a disadvantage in this study. Although lifestyle is rather permanent, respondents may have quit smoking, gained weight, increased use of alcohol, and more over time. Also, our measure of physical activity included only leisure time physical activity, thus lacking information on work time activity.
Phrasing of the survey questions varied between different studies, which posed challenges to data harmonization. For example, regarding alcohol consumption the aim was to identify never‐users. For example, the HBCS cohort selected life‐long never‐users of alcohol, while in some other studies, the question on alcohol consumption referred to more recent or current use (22). With respect to physical activity, the aim was to measure leisure–time physical activity. Also, here the wording of the question differed somewhat between the studies. In HBCS and HHS, the question was formulated in a way, where persons with even very slight physical activity were categorized as physically active. In addition, HHS is an employee cohort, where also physical activity while commuting (e.g., walking or cycling to work) was considered as leisure–time physical activity. These lead to differences in exposure prevalence between the included cohorts. In BMI, the reference group (normal weight) also included those with underweight. These variations in the definitions of the reference groups may affect the results and potentially attenuate our findings.
This study strengthens the evidence of overweight, smoking, and alcohol consumption as CRC risk factors. Substantial protective benefits in CRC risk can be achieved by preventing smoking, maintaining BMI to <25 kg/m2 and not consuming alcohol.
AUTHOR CONTRIBUTIONS
Eira Roos: Conceptualization (equal); investigation (equal); project administration (equal); writing – original draft (equal). Karri Seppä: Data curation (equal); formal analysis (equal); methodology (equal); visualization (equal); writing – original draft (equal). Olli Pietiläinen: Formal analysis (equal); investigation (equal); methodology (equal); writing – review and editing (equal). Heidi Ryynänen: Data curation (equal); methodology (equal); writing – review and editing (equal). Sanna Heikkinen: Data curation (equal); investigation (equal); project administration (equal); writing – review and editing (equal). Johan G. Eriksson: Validation (equal); writing – review and editing (equal). Tommi Härkänen: Validation (equal); writing – review and editing (equal). Pekka Jousilahti: Validation (equal); writing – review and editing (equal). Paul Knekt: Validation (equal); writing – review and editing (equal). Seppo Koskinen: Writing – review and editing (equal). Maarit Laaksonen: Writing – review and editing (equal). Satu Männistö: Validation (equal); writing – review and editing (equal). Teemu Roos: Investigation (equal); methodology (equal); writing – review and editing (equal). Ossi Rahkonen: Conceptualization (equal); investigation (equal); methodology (equal); resources (lead); supervision (equal); validation (equal); writing – review and editing (equal). Nea Malila: Conceptualization (equal); investigation (equal); supervision (equal); validation (equal); writing – review and editing (equal). Janne Pitkäniemi: Conceptualization (equal); methodology (equal); resources (equal); supervision (equal); validation (equal); writing – review and editing (equal).
CONFLICT OF INTERESTS
The authors have stated explicitly that there are no conflicts of interest in connection with this article. The authors have been independent from funders.
ETHICS STATEMENT
The study was approved by The Finnish Institute for Health and Welfare (Permits no. THL/1091/6.02.00/2015 and THL/679/6.02.00/2018).
Supporting information
Appendix S1: Supporting information
ACKNOWLEDGMENTS
Research relating to this manuscript was funded by Finnish Cancer Foundation, Cancer Society of Finland, Academy of Finland and Cancer Institute New South Wales.
Roos E, Seppä K, Pietiläinen O, et al. Pairwise association of key lifestyle factors and risk of colorectal cancer: a prospective pooled multicohort study. Cancer Reports. 2022;5(11):e1612. doi: 10.1002/cnr2.1612
Eira Roos and Karri Seppä contributed equally to this study.
Funding information Cancer Institute NSW; Finnish Cancer Foundation; Syöpäjärjestöt; Cancer Institute New South Wales.; Academy of Finland; Cancer Society of Finland
DATA AVAILABILITY STATEMENT
Data availability statement Research data are not shared. According to Finnish laws and regulations, individual‐level sensitive data can only be made available for researchers who fulfil legal requirements for access to personal sensitive data.
REFERENCES
- 1. Sung H, Ferlay J, Siegel RL, et al. Global cancer statistics 2020: GLOBOCAN estimates of incidence and mortality worldwide for 36 cancers in 185 countries. CA Cancer J Clin. 2021;71:209, 10.3322/caac.21660‐249. [DOI] [PubMed] [Google Scholar]
- 2. Arnold M, Sierra MS, Laversanne M, Soerjomataram I, Jemal A, Bray F. Global patterns and trends in colorectal cancer incidence and mortality. Gut. 2017;66:683‐691. [DOI] [PubMed] [Google Scholar]
- 3. Araghi M, Soerjomataram I, Bardot A, et al. Changes in colorectal cancer incidence in seven high‐income countries: a population‐based study. Lancet Gastroenterol Hepatol. 2019;4(7):511, 10.1016/S2468‐1253(19)30147‐5‐518. Erratum in: Lancet Gastroenterol Hepatol. 2019 Aug;4(8):e8. [DOI] [PMC free article] [PubMed] [Google Scholar]
- 4. Wong MCS, Huang J, Lok V, et al. Differences in incidence and mortality trends of colorectal cancer worldwide based on sex, age, and anatomic location. Clin Gastroenterol Hepatol. 2021;19(5):955, 10.1016/j.cgh.2020.02.026‐966.e61. [DOI] [PubMed] [Google Scholar]
- 5. Pitkäniemi J, Malila N, Tanskanen T, Degerlund H, Heikkinen S, Seppä K. Cancer 2019. Annual report on cancer in Finland (In Finnish) Available: https://syoparekisteri.fi/assets/files/2021/05/Syopa_2019_tilastoraportti.pdf. Accessed June 15, 2021.
- 6. Savijärvi S, Seppä K, Malila N, Pitkäniemi J, Heikkinen S. Trends of colorectal cancer incidence by education and socioeconomic status in Finland. Acta Oncol Stockh Swed. 2019;58:1‐7. [DOI] [PubMed] [Google Scholar]
- 7. Ferlay J, Ervik M, Lam F, Colombet M, Mery L, Piñeros M, Znaor A, Soerjomataram I, Bray F (2020). Global Cancer Observatory: Cancer Today. : International Agency for Research on Cancer, https://gco.iarc.fr/today Accessed March 31, 2021. [Google Scholar]
- 8. Rawla P, Sunkara T, Barsouk A. Epidemiology of colorectal cancer: incidence, mortality, survival, and risk factors. Prz Gastroenterol. 2019;14(2):89, 10.5114/pg.2018.81072‐103. [DOI] [PMC free article] [PubMed] [Google Scholar]
- 9.IARC Monographs on the Evaluation of Carcinogenic Risks to Humans Volume 114. Red Meat and Processed Meat; 2018. https://publications.iarc.fr/Book‐And‐Report‐Series/Iarc‐Monographs‐On‐The‐Identification‐Of‐Carcinogenic‐Hazards‐To‐Humans/Red‐Meat‐And‐Processed‐Meat‐2018. Accessed June 15, 2021.
- 10. McNabb S, Harrison TA, Albanes D, et al. Meta‐analysis of 16 studies of the association of alcohol with colorectal cancer. Int J Cancer. 2020;146(3):861, 10.1002/ijc.32377‐873. [DOI] [PMC free article] [PubMed] [Google Scholar]
- 11. Dong Y, Zhou J, Zhu Y, et al. Abdominal obesity and colorectal cancer risk: systematic review and meta‐analysis of prospective studies. Biosci Rep. 2017;37(6):BSR20170945 10.1042/BSR20170945 [DOI] [PMC free article] [PubMed] [Google Scholar]
- 12. Boyle T, Keegel T, Bull F, Heyworth J, Fritschi L. Physical activity and risks of proximal and distal colon cancers: a systematic review and meta‐analysis. J Natl Cancer Inst. 2012;104(20):1548, 10.1093/jnci/djs354‐1561. [DOI] [PubMed] [Google Scholar]
- 13. IARC Publications Personal Habits and Indoor Combustions. IARC Monographs on the Evaluation of Carcinogenic Risks to Humans; 2012. https://monographs.iarc.who.int/wp-content/uploads/2018/06/mono100E-6.pdf. Accessed June 15, 2021. [PMC free article] [PubMed]
- 14. Bosman FT. Colorectal cancer. In: Stewart BW, Wild CP, eds. World Cancer Report 2014. Lyon, France; 2014:392‐402. [Google Scholar]
- 15. Aleksandrova K, Pischon T, Jenab M, et al. Combined impact of healthy lifestyle factors on colorectal cancer: a large European cohort study. BMC Med. 2014. Oct;12(12):168, 10.1186/s12916‐014‐0168‐4. [DOI] [PMC free article] [PubMed] [Google Scholar]
- 16. Platz EA, Willett WC, Colditz GA, Rimm EB, Spiegelman D, Giovannucci E. Proportion of colon cancer risk that might be preventable in a cohort of middle‐aged US men. Cancer Causes Control. 2000;11:579‐588. [DOI] [PubMed] [Google Scholar]
- 17. Wei EK, Colditz GA, Giovannucci EL, Fuchs CS, Rosner BA. Cumulative risk of colon cancer up to age 70 years by risk factor status using data from the Nurses' health study. Am J Epidemiol. 2009;170:863‐872. [DOI] [PMC free article] [PubMed] [Google Scholar]
- 18. Kirkegaard H, Johnsen NF, Christensen J, Frederiksen K, Overvad K, Tjonneland A. Association of adherence to lifestyle recommendations and risk of colorectal cancer: a prospective Danish cohort study. BMJ. 2010;341:c5504. [DOI] [PMC free article] [PubMed] [Google Scholar]
- 19. Viner B, Barberio AM, Haig TR, Friedenreich CM, Brenner DR. The individual and combined effects of alcohol consumption and cigarette smoking on site‐specific cancer risk in a prospective cohort of 26,607 adults: results from Alberta's tomorrow project. Cancer Causes Control. 2019;30(12):1313, 10.1007/s10552‐019‐01226‐7‐1326. [DOI] [PubMed] [Google Scholar]
- 20. Lee S, Woo H, Lee J, Oh JH, Kim J, Shin A. Cigarette smoking, alcohol consumption, and risk of colorectal cancer in South Korea: a case‐control study. Alcohol. 2019;76:15, 10.1016/j.alcohol.2018.06.004‐21. [DOI] [PubMed] [Google Scholar]
- 21. Gong J, Hutter C, Baron JA, et al. A pooled analysis of smoking and colorectal cancer: timing of exposure and interactions with environmental factors. Cancer Epidemiol Biomarkers Prev. 2012;21(11):1974, 10.1158/1055‐9965.EPI‐12‐0692‐1985. [DOI] [PMC free article] [PubMed] [Google Scholar]
- 22. METCA Study Grp , Pitkaniemi J, Heikkinen S, et al. Pooling of Finnish population‐based health studies: lifestyle risk factors of colorectal and lung cancer. Acta Oncol. 2020;59(11):1338, 10.1080/0284186X.2020.1789214‐1342. [DOI] [PubMed] [Google Scholar]
- 23. Borodulin K, Tolonen H, Jousilahti P, et al. Cohort profile: the national FINRISK study. Int J Epidemiol. 2018;47(3):696, 10.1093/ije/dyx239‐696i. [DOI] [PubMed] [Google Scholar]
- 24. Härkänen T, Kaikkonen R, Virtala E, Koskinen S. Inverse probability weighting and doubly robust methods in correcting the effects of non‐response in the reimbursed medication and self‐reported turnout estimates in the ATH survey. BMC Public Health. 2014;14(1):1150. [DOI] [PMC free article] [PubMed] [Google Scholar]
- 25. Heistaro Sami Methodology report: health 2000 survey; 2008.
- 26. Knekt P, Rissanen H, Järvinen R, Heliövaara M. Cohort profile: the Finnish Mobile clinic health surveys FMC. FMCF and MFS Int J Epidemiol. 2017;46(6):1760‐1761i. [DOI] [PubMed] [Google Scholar]
- 27. Lahelma E, Aittomäki A, Laaksonen M, et al. Cohort profile: the Helsinki health study. Int J Epidemiol. 2013;42:722‐730. [DOI] [PubMed] [Google Scholar]
- 28. Eriksson JG. Early growth and coronary heart disease and type 2 diabetes: experiences from the Helsinki birth cohort studies. Int J Obes (Lond). 2006;30:S18‐S22. [DOI] [PubMed] [Google Scholar]
- 29. Leinonen MK, Miettinen J, Heikkinen S, Pitkäniemi J, Malila N. Quality measures of the population‐based Finnish cancer registry indicate sound data quality for solid malignant tumours. Eur J Cancer. 2017;77:31, 10.1016/j.ejca.2017.02.017‐39. [DOI] [PubMed] [Google Scholar]
- 30. Pukkala E, Engholm G, Højsgaard Schmidt LK, et al. Nordic cancer registries ‐ an overview of their procedures and data comparability. Acta Oncol. 2018;57(4):440, 10.1080/0284186X.2017.1407039‐455. Erratum in: Acta Oncol. 2018 Apr;57(4):565. [DOI] [PubMed] [Google Scholar]
- 31. Benjamini Y, Hochberg Y. Controlling the false discovery rate: a practical and powerful approach to multiple testing. J R Stat Soc Ser B. 1995;57(1):289‐300. [Google Scholar]
- 32. Knol MJ, VanderWeele TJ. Recommendations for presenting analyses of effect modification and interaction. Int J Epidemiol. 2012;41(2):514, 10.1093/ije/dyr218‐520. [DOI] [PMC free article] [PubMed] [Google Scholar]
- 33. Giovannucci E, Rimm EB, Stampfer MJ, et al. A prospective study of cigarette smoking and risk of colorectal adenoma and colorectal cancer in U.S. men. J Natl Cancer Inst. 1994;86(3):183, 10.1093/jnci/86.3.183‐191. [DOI] [PubMed] [Google Scholar]
- 34. Liu PH, Wu K, Ng K, et al. Association of Obesity with Risk of early‐onset colorectal cancer among women. JAMA Oncol. 2019;5(1):37, 10.1001/jamaoncol.2018.4280‐44. Erratum in: JAMA Oncol. 20(1);5(4):579. [DOI] [PMC free article] [PubMed] [Google Scholar]
- 35.World Cancer Research Fund/American Institute for Cancer Research. Diet, nutrition, physical activity and colorectal cancer. 2018. Accessed June 15, 2021.
- 36. Mahmood S, MacInnis RJ, English DR, Karahalios A, Lynch BM. Domain‐specific physical activity and sedentary behaviour in relation to colon and rectal cancer risk: a systematic review and meta‐analysis. Int J Epidemiol. 2017;46(6):1797, 10.1093/ije/dyx137‐1813. [DOI] [PubMed] [Google Scholar]
- 37. IARC Working Group on the Evaluation of Carcinogenic Risks to Humans . Personal habits and indoor combustions. Volume 100 E. a review of human carcinogens. IARC Monogr Eval Carcinog Risks to Humans. 2012;100(Pt E):1‐538. http://www.ncbi.nlm.nih.gov/pubmed/23193840 . [PMC free article] [PubMed] [Google Scholar]
- 38. https://gco.iarc.fr/today/data/factsheets/cancers/10_8_9-Colorectum-fact-sheet.pd
Associated Data
This section collects any data citations, data availability statements, or supplementary materials included in this article.
Supplementary Materials
Appendix S1: Supporting information
Data Availability Statement
Data availability statement Research data are not shared. According to Finnish laws and regulations, individual‐level sensitive data can only be made available for researchers who fulfil legal requirements for access to personal sensitive data.