

Abstract
Purpose:
Age-related macular degeneration (AMD) is the leading cause of irreversible blindness in older individuals. More studies focused on screening the genes, which may be correlated with the development of AMD. With advances in various technologies like multiple microarray datasets, researchers could identify differentially expressed genes (DEGs) more accurately. Exploring abnormal gene expression in disease status can help to understand pathophysiological changes in complex diseases. This study aims to identify the key genes and upstream regulators in AMD and reveal factors, especially genetic association, and the prognosis of the development of this disease.
Methods:
Data from expression profile GSE125564 and profile GSE29801 were obtained from the Gene Expression Omnibus (GEO) database. We analyzed DEGs using R software (version 3.6.3). Functional enrichment and PPI network analysis were performed using the R package and online database STRING (version 11.0).
Results:
We compared AMD with normal and found 68 up-regulated genes (URGs) and 25 down-regulated genes (DRGs). We also compared wet AMD with dry AMD and found 41 DRGs in dry AMD. Further work including PPI network analysis, GO classification, and KEGG analysis was done to find connections with AMD. The URGs were mainly enriched in the biological process such as DNA replication, nucleoplasm, extracellular exosome, and cadherin binding. Besides, DRGs were mainly enriched in these functions such as an integral component of membrane and formation of the blood-aqueous barrier (BAB).
Conclusion:
This study implied that core genes might involve in the process of AMD. Our findings may contribute to revealing the pathogenesis, developing new biomarkers, and raising strategies of treatment for AMD.
Keywords: Age-related macular degeneration, bioinformatic analysis, potential genes, Gene Expression Omnibus database, functional enrichment, protein–protein interaction network analysis
Age-related macular degeneration (AMD) is the leading cause of irreversible and gradual blindness in older individuals.[1,2,3] AMD can be divided into three stages: early, intermediate, and late, based partially on the extent (size and number) of drusen.[4] The cause of AMD can be linked to aging, oxidative damage, and impaired retinal pigment epithelial cell function.[5] More studies focus on screening the differentially expressed genes (DEGs) which may be correlated with AMD. We integrated and analyzed the gene expression data. Functional enrichment and PPI network analyses were performed to identify potential genes, which might be biomarkers for the diagnosis and treatment of AMD.
Methods
Qualified gene expression data of AMD
We selected gene expression datasets of AMD on the largest gene expression database, the Gene Expression Omnibus database (GEO, https://www.ncbi.nlm.nih.gov/geo). Only the whole-genome expression profile data of both AMD patients and normal groups without drug stimulation or transfection were included. The microarray data of gene expression is based on the mRNA of the human donor eyes, containing the retina and retinal pigment epithelium (RPE)-choroids from macular regions. Under this condition, we use GSE125564 and GSE29801 datasets for research. There were RPE samples differentiated from induced pluripotent stem cells (iPScs) of four advanced AMD donor eyes and age-matched three non-AMD donors (normal controls) in GSE125564.[6] And GSE29801 contains a microarray dataset of systems-level transcriptome analysis of the retina and RPE-choroid complex from 31 normal, 26 AMD, and 11 potential pre-AMD human eyes derived from the University of Iowa.[7] For each donor, only one eye with the most advanced phenotype was used for analysis. In detail, the dataset included 151 normal samples with no reported ocular disease, 55 of them are retina tissue from macular and extramacular, and 96 of them are samples of RPE-choroid tissue from macular and extramacular. There are 69 dry AMD and 16 wet AMD of macular and extramacular tissue. Besides, 33 samples of pre-AMD are included in the dataset. For a supplement, pre-AMD means only hard macular drusen (<63 mm) or soft, distinct macular drusen (>63 mm) or macular pigmentary irregularities without soft drusen. Samples were isolated from human donor eyes from the University of Iowa (GSH) and Lions Eye Bank of Oregon. The lowa eyes were selected from a well-characterized repository derived from more than 3900 donors. The classification of AMD is based on the age-related eye diseases study (AREDS) and its simplified version, BMES (a population-based study).[8,9]
Identify DEGs in AMD
After the exclusion and correction performed for the raw data, we aim to compare the gene expression levels of the macular retina and macular RPE-choroid. We used the Limma package in R software (version 3.6.3) to analyze GSE125564 and GSE29801 aiming to identify DEGs. We used multiple testing and controlled the false discovery rate (FDR) to calculate the P values of each differential expression. Then, the DEGs between AMD and normal group and the wet and dry group were identified with the standard of FDR adjusted P value (or q-value) <0.05 as significantly differential genes. They can be analyzed for further bioinformatics analysis.
Functional enrichment analysis
For functional enrichment analysis, first, we performed Gene Ontology (GO) classification (biological processes (BPs), molecular functions (MFs), and cellular component (CC)) and Kyoto Encyclopedia of Genes and Genomes (KEGG) analysis to reveal the function and the pathway. We used an online software DAVID (https://david.ncifcrf.gov/summary.jsp) to get the enrichment results first.[10] KEGG pathway analysis was used to identify pathways for these DEGs, and the cut-off criterion of significantly enriched KEGG pathways was P < 0.05. We performed GO term enrichment analysis according to these sub-ontologies: BP, MF, and CC, which were used to predict protein functions. Then the data profiles were illustrated via the ggplot2 package.
Comprehensive AMD protein–protein interaction (PPI) network construction
To further research the biological functions of DEGs and detect the molecular mechanisms of AMD, the DEGs in AMD were used to construct the PPI network using the online tool- STRING (version 11.0). STRING is an online database of known and predicted PPIs, which are essential to interpret the molecular mechanisms of essential cellular activities in AMD (https://string-db.org/).[11] These interactions include physical and functional connections. We mapped the PPI network with the DEGs and set an interaction cut-off standard score of >0.4 as the threshold value. We set the interaction score to hide the nodes without interactions. Nodes and edges were used to represent the proteins and interactions between two proteins.
Results
Identification of DEGs in AMD
The process of our study is partly shown in the flowchart in Fig. 1. To identify DEGs, we used the expression profile of GSE125564 (containing RPE samples from four advanced AMD and three non-AMD donors) and the expression profile from GSE29801 (containing 69 dry AMD and 16 wet AMD of macular and extramacular samples). Data preprocessing and quality assessment were conducted using R software. We identified 98 high expression genes and 350 low expression genes between AMD and normal, and 73 low expression genes between dry and wet AMD. The top 91 most significant DEGs of GSE125564 are shown in Tables 1 and 2 (67 up-regulated and 24 down-regulated), and the top 73 most significant low expression DEGs of GSE29801 are shown in Table 3 with |LogFC|>2. As shown in the heatmap [Fig. 2a], 20 up-regulated genes (URGs) and 20 down-regulated genes (DRGs) were identified through the comparison of AMD patients and normal individuals. Volcano plot [Fig. 2b] shows gene expression significantly (FDR <0.05; |LogFC|>2) altered (highlighted in red and blue color) in the AMD sample. To find out the DEGs which have been identified, we compared the possibly significant genes from the GSE125564 and GSE29801 datasets with genes in the CDC-Public Health Genomics and Precision Health Knowledge Base (PHGKB; version. 6.3) (https://phgkb.cdc.gov/PHGKB/phgHome.action?action = home). We downloaded 498 genes published in the category of “age-related macular degeneration” to make the comparison. The results are shown in the Venn diagram in Fig. 3. We filtered one URG (SLC40A1) that overlapped with potential AMD risk genes shown on PHGKB and three DRGs (IMPG1, TRPM1, Fibrillin 2 (FBN2)) that overlapped. In the meantime, two DRGs (CRB1, death-associated protein-like 1(DAPL1)) of dry AMD were included in the PHGKB gene list.
Figure 1.

Flowchart showing the expression data of GSE125564 and GSE29801 obtained from the Gene Expression Omnibus (GEO) database. As shown in the flowchart, we identified 498 high expression genes and 350 low expression genes of AMD, and 73 low expression genes of dry-AMD. To further explore the differentially expressed genes, functional enrichment analysis and protein–protein interaction (PPI) network analysis were performed
Table 1.
| Gene | logFC | t | P | adj. P |
|---|---|---|---|---|
| SPRR3 | 8.124167 | 6.275577 | 0.000217 | 0.023115 |
| OGN | 7.186667 | 17.44997 | 9.18E-08 | 0.001804 |
| KRT10 | 6.390833 | 5.368205 | 0.000622 | 0.030635 |
| POSTN | 6.374167 | 7.477959 | 6.28E-05 | 0.0199 |
| DCN | 5.773333 | 4.325006 | 0.002398 | 0.047301 |
| COL6A3 | 5.181667 | 6.210678 | 0.000234 | 0.023158 |
| SNAI2 | 4.904167 | 8.122618 | 3.43E-05 | 0.019009 |
| LUM | 4.848333 | 4.64553 | 0.001558 | 0.040758 |
| HIST1H2BM | 4.675833 | 5.467697 | 0.000551 | 0.02974 |
| DSC1 | 4.5425 | 5.315273 | 0.000664 | 0.03142 |
| PITX2 | 4.4675 | 6.038914 | 0.000283 | 0.024957 |
| GLIPR1 | 4.448333 | 7.163758 | 8.56E-05 | 0.02025 |
| MGP | 4.393333 | 5.858927 | 0.000348 | 0.026361 |
| MME | 4.35 | 7.679341 | 5.18E-05 | 0.019074 |
| BGN | 4.140833 | 5.278097 | 0.000695 | 0.032255 |
| ASPN | 4.113333 | 7.753717 | 4.83E-05 | 0.019009 |
| OLFML3 | 4.0725 | 4.463559 | 0.001986 | 0.044432 |
| FEZF1 | 3.9875 | 6.469205 | 0.000176 | 0.022325 |
| COL3A1 | 3.845833 | 4.669342 | 0.001509 | 0.040749 |
| KRT19 | 3.676667 | 5.08216 | 0.000887 | 0.034599 |
| ITGA11 | 3.430833 | 5.194819 | 0.00077 | 0.033686 |
| RSPO3 | 3.330833 | 4.494167 | 0.001906 | 0.043584 |
| PTHLH | 3.165833 | 5.039749 | 0.000935 | 0.034796 |
| RGS4 | 3.126667 | 8.390034 | 2.70E-05 | 0.019009 |
| ANXA1 | 3.0825 | 5.075596 | 0.000894 | 0.034599 |
| ESRP1 | 3.013333 | 5.148051 | 0.000816 | 0.034369 |
| CSRP1 | 2.950833 | 4.45154 | 0.002019 | 0.044755 |
| HAPLN1 | 2.88 | 5.066054 | 0.000905 | 0.034599 |
| TM4SF1 | 2.8625 | 5.418004 | 0.000585 | 0.030263 |
| HIST1H1B | 2.844167 | 6.895687 | 0.000112 | 0.022203 |
| GABRP | 2.818333 | 4.976513 | 0.001014 | 0.035747 |
| FAM111B | 2.750833 | 10.33547 | 5.61E-06 | 0.019009 |
| SULT1E1 | 2.641667 | 5.722827 | 0.000407 | 0.027963 |
| DAB2 | 2.614007 | 4.758005 | 0.001344 | 0.03886 |
| GLRA2 | 2.546667 | 4.329758 | 0.002382 | 0.047231 |
| KRT18 | 2.533333 | 5.281482 | 0.000692 | 0.032255 |
| ESCO2 | 2.505 | 8.640448 | 2.17E-05 | 0.019009 |
| INHBA | 2.475833 | 5.054475 | 0.000918 | 0.034599 |
| ADAM12 | 2.461667 | 4.335081 | 0.002365 | 0.047151 |
| S100A11 | 2.440833 | 4.652763 | 0.001543 | 0.040758 |
| RRM2 | 2.434167 | 6.198039 | 0.000237 | 0.023254 |
| TMEM88 | 2.434167 | 6.080584 | 0.00027 | 0.024784 |
| GABRA2 | 2.411667 | 4.333038 | 0.002372 | 0.047151 |
| VTCN1 | 2.3925 | 6.33978 | 0.000203 | 0.022788 |
| SLCO4C1 | 2.375833 | 5.792338 | 0.000375 | 0.027013 |
| POLR2E | 2.294167 | 6.832232 | 0.00012 | 0.022325 |
| DNAJC15 | 2.289167 | 6.692018 | 0.000139 | 0.022325 |
| HIST1H2AG | 2.25 | 6.387984 | 0.000192 | 0.022741 |
| SRPX2 | 2.240833 | 4.38318 | 0.002215 | 0.046142 |
| EPCAM | 2.230833 | 4.734236 | 0.001386 | 0.039283 |
| PNPO | 2.173333 | 4.9666 | 0.001026 | 0.035818 |
| PPIL1 | 2.168333 | 7.813466 | 4.56E-05 | 0.019009 |
| SLC40A1 | 2.164167 | 4.558784 | 0.001748 | 0.042337 |
| GPX8 | 2.138333 | 4.640189 | 0.001569 | 0.040758 |
| APELA | 2.119167 | 4.590918 | 0.001675 | 0.041429 |
| SLC35A4 | 2.088333 | 8.356186 | 2.78E-05 | 0.019009 |
| KIF4A | 2.081667 | 4.868872 | 0.001164 | 0.037379 |
| HIST1H2BK | 2.07 | 8.685533 | 2.09E-05 | 0.019009 |
| LSM4 | 2.064167 | 6.857823 | 0.000117 | 0.022259 |
| SNX2 | 2.063333 | 5.305636 | 0.000672 | 0.031706 |
| ETS2 | 2.054167 | 5.066182 | 0.000905 | 0.034599 |
| CHTF8 | 2.050007 | 10.20321 | 6.19E-06 | 0.019009 |
| PGD | 2.0425 | 5.280756 | 0.000692 | 0.032255 |
| LGALS1 | 2.0325 | 4.368712 | 0.002259 | 0.046461 |
| FAM83B | 2.026667 | 6.150347 | 0.00025 | 0.023887 |
| NCAPH | 2.011667 | 6.3172 | 0.000208 | 0.02288 |
| CERS3 | 2.006667 | 5.123589 | 0.000842 | 0.034513 |
Table 2.
| Gene | logFC | t | P | adj. P |
|---|---|---|---|---|
| SLC6A13 | -3.74167 | -4.34979 | 0.002318 | 0.046794 |
| ENPP2 | -3.31165 | -6.65962 | 0.000144 | 0.022325 |
| IMPG1 | -3.1775 | -4.44994 | 0.002023 | 0.044757 |
| LRP2 | -2.845 | -4.84295 | 0.001203 | 0.037676 |
| ADGRV1 | -2.79833 | -4.59718 | 0.001661 | 0.041387 |
| TAS2R31 | -2.62917 | -7.23894 | 7.94E-05 | 0.020142 |
| TENM1 | -2.6075 | -4.57468 | 0.001711 | 0.042017 |
| CPXM2 | -2.5725 | -4.53211 | 0.001811 | 0.042768 |
| TRPM1 | -2.55833 | -7.28904 | 7.56E-05 | 0.020142 |
| TAS2R30 | -2.505 | -7.21061 | 8.17E-05 | 0.020142 |
| CNTNAP3P2 | -2.48083 | -4.51846 | 0.001845 | 0.042986 |
| OBSCN | -2.44583 | -10.774 | 4.07E-06 | 0.019009 |
| NPIPB3 | -2.325 | -4.57374 | 0.001713 | 0.042017 |
| ADAM20 | -2.30917 | -5.17008 | 0.000794 | 0.034282 |
| NPIPB5 | -2.2275 | -5.66614 | 0.000435 | 0.028392 |
| TAS2R13 | -2.18667 | -6.98536 | 0.000102 | 0.021706 |
| RPS3A | -2.15 | -7.32186 | 7.31E-05 | 0.020142 |
| FBN2 | -2.135 | -6.60421 | 0.000152 | 0.022325 |
| NPIPB4 | -2.13278 | -4.70348 | 0.001443 | 0.040093 |
| PCSK5 | -2.1 | -8.03682 | 3.71E-05 | 0.019009 |
| ITIH5 | -2.0825 | -5.37547 | 0.000617 | 0.030635 |
| LRP4 | -2.06917 | -5.3228 | 0.000658 | 0.03142 |
| LAMA5 | -2.02583 | -5.55143 | 0.000499 | 0.028804 |
| ASAP1 | -2.0225 | -6.84905 | 0.000118 | 0.022259 |
Table 3.
| Gene | logFC | t | P | adj. P |
|---|---|---|---|---|
| NPVF | -4.53311 | -7.66309 | 5.27E-08 | 0.000369 |
| CRYM | -3.4527 | -6.46656 | 9.21E-07 | 0.001817 |
| CRYAA | -3.38383 | -6.15766 | 1.98E-06 | 0.002518 |
| CCK | -3.18424 | -5.34161 | 1.57E-05 | 0.008584 |
| TRH | -3.1818 | -5.92346 | 3.57E-06 | 0.003103 |
| HKDC1 | -3.11756 | -6.53273 | 7.83E-07 | 0.001715 |
| ODAM | -3.10103 | -7.63512 | 5.62E-08 | 0.000369 |
| LOC100130155 | -3.02594 | -4.91234 | 4.73E-05 | 0.019052 |
| FSTL5 | -3.02268 | -4.80832 | 6.19E-05 | 0.022271 |
| LOC645323 | -3.00932 | -6.04232 | 2.65E-06 | 0.00288 |
| HSD17B2 | -2.91812 | -5.24864 | 1.99E-05 | 0.01006 |
| MOXD1 | -2.90152 | -5.17007 | 2.43E-05 | 0.011433 |
| RAX | -2.71803 | -5.91961 | 3.60E-06 | 0.003103 |
| C20orf186 | -2.7042 | -8.35477 | 1.10E-08 | 0.000216 |
| FABP7 | -2.67545 | -6.29012 | 1.43E-06 | 0.002215 |
| NRCAM | -2.66639 | -4.8309 | 5.84E-05 | 0.022271 |
| C8orf47 | -2.6577 | -5.92605 | 3.54E-06 | 0.003103 |
| B3GAT1 | -2.65185 | -6.13341 | 2.11E-06 | 0.002518 |
| SLN | -2.64451 | -7.34652 | 1.10E-07 | 0.000435 |
| DAPL1 | -2.56072 | -4.43098 | 0.000164 | 0.043812 |
| CRB1 | -2.54872 | -5.67655 | 6.66E-06 | 0.004508 |
| C4orf49 | -2.54645 | -5.44427 | 1.20E-05 | 0.006788 |
| PAX6 | -2.51185 | -4.68185 | 8.59E-05 | 0.025671 |
| MTTP | -2.4489 | -5.50654 | 1.03E-05 | 0.00614 |
| SLC1A3 | -2.43319 | -4.74327 | 7.33E-05 | 0.024227 |
| ONECUT1 | -2.43045 | -5.88662 | 3.91E-06 | 0.003103 |
| MAPK4 | -2.40224 | -6.28041 | 1.46E-06 | 0.002215 |
| LIX1 | -2.39509 | -5.90325 | 3.75E-06 | 0.003103 |
| MAL2 | -2.37664 | -6.02335 | 2.77E-06 | 0.00288 |
| WIF1 | -2.35677 | -7.39461 | 9.85E-08 | 0.000435 |
| GPR37 | -2.34266 | -7.24866 | 1.39E-07 | 0.000457 |
| RASL11B | -2.326 | -5.09604 | 2.95E-05 | 0.012913 |
| DKK1 | -2.30176 | -4.95641 | 4.22E-05 | 0.017356 |
| PRSS35 | -2.26726 | -4.78653 | 6.55E-05 | 0.023078 |
| RNF182 | -2.23129 | -5.13126 | 2.69E-05 | 0.012341 |
| SLC38A1 | -2.1936 | -5.17172 | 2.42E-05 | 0.011433 |
| RPRML | -2.16772 | -5.88464 | 3.93E-06 | 0.003103 |
| PKIA | -2.15298 | -4.76518 | 6.92E-05 | 0.023547 |
| SPON1 | -2.11493 | -6.85401 | 3.58E-07 | 0.001008 |
| ONECUT2 | -2.10533 | -4.8867 | 5.06E-05 | 0.01995 |
| FAM19A4 | -2.00382 | -4.72915 | 7.60E-05 | 0.024501 |
| TNC | -1.9865 | -5.32952 | 1.62E-05 | 0.008615 |
| ATP6V1C2 | -1.9828 | -5.48205 | 1.09E-05 | 0.006344 |
| GFAP | -1.96065 | -5.73403 | 5.76E-06 | 0.004206 |
| OXTR | -1.95452 | -4.59546 | 0.000107 | 0.030706 |
| KCNJ10 | -1.93793 | -4.72037 | 7.78E-05 | 0.024501 |
| CALB1 | -1.9054 | -4.80727 | 6.21E-05 | 0.022271 |
| SIX6 | -1.88191 | -5.1906 | 2.31E-05 | 0.011387 |
| RELN | -1.87745 | -4.70578 | 8.08E-05 | 0.024501 |
| GABRB1 | -1.83976 | -4.71242 | 7.94E-05 | 0.024501 |
| CPLX3 | -1.82094 | -4.81032 | 6.16E-05 | 0.022271 |
| KIAA1853 | -1.81438 | -6.62706 | 6.21E-07 | 0.001531 |
| PXDNL | -1.81369 | -5.53766 | 9.49E-06 | 0.005935 |
| SLC1A2 | -1.79159 | -6.12124 | 2.17E-06 | 0.002518 |
| CLRN1 | -1.77825 | -5.71036 | 6.11E-06 | 0.004306 |
| GREM2 | -1.76386 | -6.20865 | 1.75E-06 | 0.002459 |
| RASGRP1 | -1.74221 | -5.66516 | 6.86E-06 | 0.004508 |
| CNTNAP2 | -1.72879 | -4.81568 | 6.08E-05 | 0.022271 |
| CDH2 | -1.70445 | -5.77785 | 5.15E-06 | 0.003908 |
| ZDHHC8P | -1.55924 | -5.07619 | 3.10E-05 | 0.013296 |
| CTNNA2 | -1.50569 | -4.57786 | 0.000112 | 0.031677 |
| NOL4 | -1.48934 | -4.46968 | 0.000149 | 0.040184 |
| FAM123A | -1.45493 | -5.29301 | 1.78E-05 | 0.009212 |
| GAD2 | -1.45394 | -4.50182 | 0.000137 | 0.037965 |
| GPR64 | -1.43805 | -4.6546 | 9.22E-05 | 0.027135 |
| FAM169A | -1.36341 | -4.99635 | 3.81E-05 | 0.015989 |
| ITGB1BP2 | -1.35619 | -6.38357 | 1.13E-06 | 0.002027 |
| NPTX1 | -1.31932 | -4.49697 | 0.000139 | 0.037965 |
| PET112L | -1.25013 | -4.76695 | 6.89E-05 | 0.023547 |
| TTYH1 | -1.22694 | -5.53187 | 9.63E-06 | 0.005935 |
| SOX8 | -1.21174 | -4.70786 | 8.03E-05 | 0.024501 |
| BAI2 | -1.17811 | -5.10036 | 2.91E-05 | 0.012913 |
| FZD5 | -1.1617 | -4.74107 | 7.37E-05 | 0.024227 |
Figure 2.

The gene expression patterns of the AMD and normal groups were different through heatmap view (a). Nineteen DEGs are shown in a volcano plot. Ten up-regulated genes are shown in red, and 9 down-regulated genes are shown in blue (b)
Figure 3.
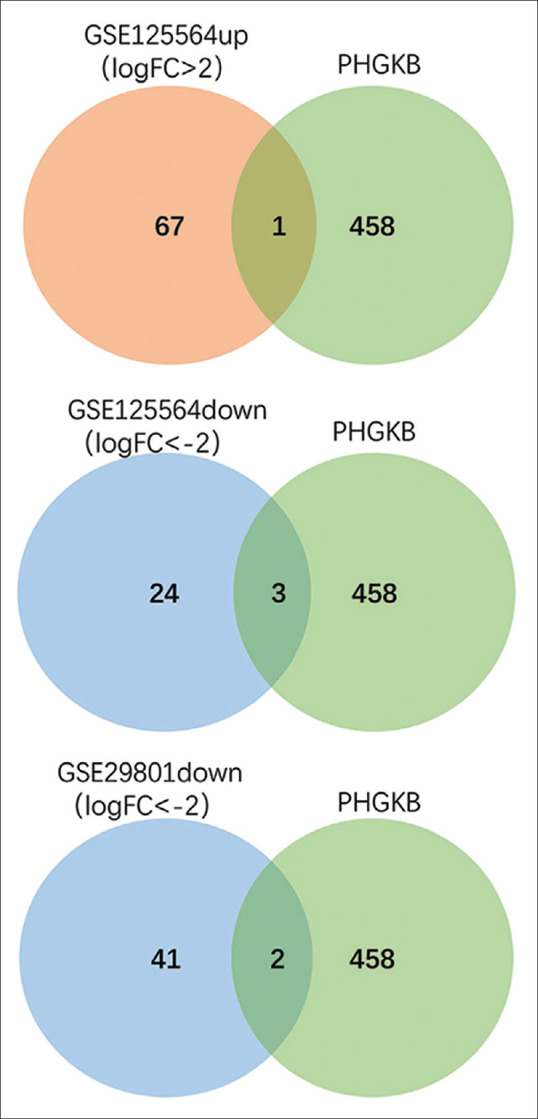
Venn diagrams show results of overlapping top genes with the genes related to AMD reported in Public Health Genomics and Precision Health Knowledge Base (PHGKB)
DEGs introduction
For the overlapped DEGs, SLC40A1 is related to iron exportation of ferroportin (Fpn) - the only known mammalian cellular iron exporter. Its localization and regulation in the retina may clarify the direction of retinal iron flux. A study by Theurl M. suggests that physiologic hepcidin levels are inadequate to alter Fpn levels in the RPE and Müller cells, but can confine iron transportation into the retina from the vascular endothelial cell.[12] Wei suggested that inhibiting ferroptosis or reducing interferon-gamma (IFN-g) may be a promising target for AMD. Since a direct causal relationship between IFN-g and RPE cell death can be seen. IFN-g upregulates the level of intracellular Fe2+ through inhibiting Fe2+ efflux protein SLC40A1.[13] IMPG1 encodes the SPACR protein which is a component of the rod and cone photoreceptor extracellular matrix domains. This gene encodes a protein that is a major component of the retinal interphotoreceptor matrix. The encoded protein is thought to play a key role in maintaining the viability of photoreceptor cells and in the adhesion of the neural retina to the RPE.[14] Olivier G confirmed a phenotype consistent with that observed in the families using morpholino-mediated ablation of Impg1 and its paralog Impg2 in medaka fish, including a decreased length of the rod and cone photoreceptor outer segments.[15] TRPM1 has been proved associated with AMD according to genetic interactions between the nuclear and mitochondrial (mt) genome.[16,17] Study showed that FBN2 expression is reduced in aging and AMD eyes.[18] Variants in CRB1 have been described as associated with over 150 diseases resulting in various retinal disease phenotypes and biallelic CRB1 mutations can present as retinitis pigmentosa or cystic maculopathy.[19,20] A study by Ma X a showed that DAPL1 is a regulator of RPE cell proliferation that is essential to the maintenance of the RPE as a monolayer. The findings suggest that DAPL1 dysregulation may be involved in abnormal RPE-related diseases and retinal dysfunctions in humans.[21] Synonymous single nucleotide polymorphism (SNP) rs17810398 located in DAPL1 was found to be associated with AMD in a joint analysis. DAPL1 acts in epithelial differentiation and may be involved in apoptotic processes thereby suggesting a novel pathway in AMD pathogenesis. In addition, this association was characterized by a highly significant sex difference.[22] Despite its uncertainty, the potential DEGs we found offer some insight into the prognosis of AMD. The results of the present study demonstrated that the expression levels of FEZF1 may promote the cell viability, invasion, migration, and epithelial-mesenchymal transition (EMT) of cells.[23] EMT plays a key role in the pathogenesis of subretinal fibrosis in late AMD.[24] Olfml3, another URG may be a proangiogenic factor that promotes angiogenesis.[25] We also found that COL3A1, which is one of the extracellular matrix (ECM)-related genes, played an important role in the chemical modifications to ECM proteins and regulation of cell function.[26,27] Lipoprotein receptor-related protein 2 (LRP2)-mediated degradation of some serum proteins may contribute to the formation of the blood-aqueous barrier (BAB) and the blood-retinal barrier (BRB) which control the selective transport of vitamins and other nutrients through the non-pigmented (NPE) and RPE cell layers. Down-regulation of LRP2 may accelerate the alteration and vision loss.
Functional annotation/functional enrichment analysis/functional and pathway enrichment of DEGs
In our study, the functional and pathway enrichment analyses of DEGs were performed by the DAVID 6.8 online tool and “clusterProfiler” R package. The results of GO enrichment analysis (FDR <0.05, P value <0.05) showed that 26 GO terms were identified significantly which suggested that the 67 high expression genes were enriched in these functions [Table 4]: the top five BP category revealed enrichment in DNA replication (FDR = 1.62E-09), G1/S transition of mitotic cell cycle (FDR = 6.78E-08), nucleosome assembly (FDR = 1.08E-06), negative regulation of ubiquitin-protein ligase activity involved in mitotic cell cycle (FDR = 8.44E-04), anaphase-promoting complex-dependent catabolic process (FDR = 0.002766187); the top five CC category revealed enrichment in nucleoplasm (FDR = 7.32E-17), nucleosome (FDR = 3.22E-13), extracellular exosome (FDR = 4.63E-09), cytosol (FDR = 4.94E-07), and nuclear nucleosome (FDR = 1.43E-06); the two MF category revealed enrichment in protein binding (FDR = 3.20E-11) and cadherin binding involved in cell-cell adhesion (FDR = 2.44E-04). Besides, four GO terms were identified significantly which indicated that the 24 low expression genes were enriched in these functions [Table 5]: the two BP category revealed enrichment in sensory perception of taste (FDR = 0.008432411) and detection of chemical stimulus involved in sensory perception of bitter taste (FDR = 0.022586901); the CC category revealed enrichment in integral component of membrane (FDR = 0.007392302); the MF category revealed enrichment in bitter taste receptor activity (FDR = 0.003200625).
Table 4.
Gene Ontology analysis of high expression genes in age-related macular degeneration (AMD)
| Category | ID | Description | Count | BgRatio% | P | FDR |
|---|---|---|---|---|---|---|
| GOTERM_BP_DIRECT | GO: 0006260 | DNA replication | 26 | 0.033041887 | 9.43E-13 | 1.62E-09 |
| GOTERM_BP_DIRECT | GO: 0000082 | G1/S transition of mitotic cell cycle | 20 | 0.025416836 | 3.94E-11 | 6.78E-08 |
| GOTERM_BP_DIRECT | GO: 0006334 | Nucleosome assembly | 20 | 0.025416836 | 6.26E-10 | 1.08E-06 |
| GOTERM_BP_DIRECT | GO: 0051436 | Negative regulation of ubiquitin-protein ligase activity involved in mitotic cell cycle | 13 | 0.016520943 | 4.90E-07 | 8.44E-04 |
| GOTERM_BP_DIRECT | GO: 0031145 | Anaphase-promoting complex-dependent catabolic process | 13 | 0.016520943 | 1.61E-06 | 0.002766187 |
| GOTERM_BP_DIRECT | GO: 0098609 | Cell-cell adhesion | 24 | 0.030500203 | 1.90E-06 | 0.003276923 |
| GOTERM_BP_DIRECT | GO: 0006342 | Chromatin silencing | 10 | 0.012708418 | 3.13E-06 | 0.005379374 |
| GOTERM_BP_DIRECT | GO: 0060968 | Regulation of gene silencing | 6 | 0.007625051 | 6.28E-06 | 0.010812163 |
| GOTERM_BP_DIRECT | GO: 0051437 | Positive regulation of ubiquitin-protein ligase activity involved in regulation of mitotic cell cycle transition | 12 | 0.015250102 | 7.08E-06 | 0.012186408 |
| GOTERM_BP_DIRECT | GO: 0007049 | Cell cycle | 20 | 0.025416836 | 9.56E-06 | 0.016458974 |
| GOTERM_BP_DIRECT | GO: 0006335 | DNA replication-dependent nucleosome assembly | 8 | 0.010166734 | 2.14E-05 | 0.036889283 |
| GOTERM_CC_DIRECT | GO: 0005654 | Nucleoplasm | 153 | 0.194438796 | 5.12E-20 | 7.32E-17 |
| GOTERM_CC_DIRECT | GO: 0000786 | Nucleosome | 24 | 0.030500203 | 2.48E-16 | 3.22E-13 |
| GOTERM_CC_DIRECT | GO: 0070062 | Extracellular exosome | 134 | 0.170292802 | 3.24E-12 | 4.63E-09 |
| GOTERM_CC_DIRECT | GO: 0005829 | Cytosol | 144 | 0.18300122 | 3.46E-10 | 4.94E-07 |
| GOTERM_CC_DIRECT | GO: 0000788 | Nuclear nucleosome | 13 | 0.016520943 | 1.00E-09 | 1.43E-06 |
| GOTERM_CC_DIRECT | GO: 0000784 | Nuclear chromosome, telomeric region | 20 | 0.025416836 | 1.50E-09 | 2.14E-06 |
| GOTERM_CC_DIRECT | GO: 0005634 | Nucleus | 201 | 0.255439203 | 1.66E-08 | 2.37E-05 |
| GOTERM_CC_DIRECT | GO: 0005737 | Cytoplasm | 195 | 0.247814152 | 2.08E-08 | 2.97E-05 |
| GOTERM_CC_DIRECT | GO: 0005913 | Cell-cell adherens junction | 26 | 0.033041887 | 1.79E-06 | 0.002553987 |
| GOTERM_CC_DIRECT | GO: 0000228 | Nuclear chromosome | 10 | 0.012708418 | 9.26E-06 | 0.013223895 |
| GOTERM_CC_DIRECT | GO: 0043234 | Protein complex | 28 | 0.035583571 | 1.54E-05 | 0.021938197 |
| GOTERM_CC_DIRECT | GO: 0000502 | Proteasome complex | 10 | 0.012708418 | 2.62E-05 | 0.037441779 |
| GOTERM_CC_DIRECT | GO: 0005739 | Mitochondrion | 61 | 0.07752135 | 3.35E-05 | 0.047910907 |
| GOTERM_MF_DIRECT | GO: 0005515 | Protein binding | 325 | 0.413023587 | 2.14E-14 | 3.20E-11 |
| GOTERM_MF_DIRECT | GO: 0098641 | Cadherin binding involved in cell-cell adhesion | 27 | 0.034312729 | 1.63E-07 | 2.44E-04 |
Table 5.
Gene Ontology analysis of low expression genes in age-related macular degeneration (AMD)
| Category | ID | Description | Count | BgRatio% | P | FDR |
|---|---|---|---|---|---|---|
| GOTERM_BP_DIRECT | GO: 0050909 | Sensory perception of taste | 4 | 14.28571 | 6.98E-06 | 0.008432411 |
| GOTERM_BP_DIRECT | GO: 0001580 | Detection of chemical stimulus involved in sensory perception of bitter taste | 4 | 14.28571 | 1.87E-05 | 0.022586901 |
| GOTERM_CC_DIRECT | GO: 0016021 | Integral component of membrane | 19 | 67.85714 | 7.40E-06 | 0.007392302 |
| GOTERM_MF_DIRECT | GO: 0033038 | Bitter taste receptor activity | 4 | 14.28571 | 3.22E-06 | 0.003200625 |
While there is no term identified significantly in DEGs of the GSE29801 dataset. Four KEGG pathways functional terms indicated the high and low expression genes enrichment [Table 6]: alcoholism, systemic lupus erythematosus, and DNA replication. Fig. 4 shows the bubble charts (abcd) for GO and KEGG pathway enrichment analysis of aberrantly expressed genes.
Table 6.
Kyoto encyclopedia of genes and genomes (KEGG) pathway analysis of differentially expressed genes in age-related macular degeneration (AMD)
| Category | ID | Description | Count | BgRatio% | P | FDR |
|---|---|---|---|---|---|---|
| High expression of AMD | ||||||
| KEGG_PATHWAY | hsa05034 | Alcoholism | 28 | 0.035583571 | 9.31E-12 | 1.17E-08 |
| KEGG_PATHWAY | hsa05322 | Systemic lupus erythematosus | 24 | 0.030500203 | 3.03E-11 | 3.80E-08 |
| KEGG_PATHWAY | hsa03030 | DNA replication | 9 | 0.011437576 | 1.44E-05 | 0.018074 |
| Low expression of AMD | ||||||
| KEGG_PATHWAY | hsa04742 | Taste transduction | 4 | 14.28571429 | 1.43E-05 | 0.009728 |
Figure 4.

Bubble charts of biological process for Gene Ontology and KEGG pathway enrichment analysis of aberrantly differentially expressed genes (a). Bubble charts of cellular components for Gene Ontology and KEGG pathway enrichment analysis of aberrantly differentially expressed genes (b). Bubble charts of molecular function for Gene Ontology and KEGG pathway enrichment analysis of aberrantly differentially expressed genes (c). Bubble charts of KEGG pathway enrichment analysis of aberrantly differentially expressed genes (d)
Comprehensive gene regulation network/PPI Network Analysis of DEGs/AMD-specific PPI network
The STRING database was used to construct PPI networks with an interaction score >0.4 [Fig. 5]. Ultimately, 66 nodes and 75 edges were established from the high expression genes of AMD and 21 nodes and 1 edge were established from the low expression genes. The results are shown in Fig. 5a and b. Also, 70 nodes and 72 edges were established from the low expression genes of dry AMD, shown in Fig. 5c.
Figure 5.

The protein–protein interaction (PPI) networks of the high expression genes with 66 nodes and 75 edges were established (a). The protein–protein interaction (PPI) networks of the low expression genes with 21 nodes and 1 edge were established (b). The protein–protein interaction (PPI) networks of the low expression genes of dry AMD with 70 nodes and 72 edges were established (c)
Discussion
AMD is a major cause of blindness in the elderly. It is not determined by inheritance changes alone and epigenetic changes are known to affect development and influence complex traits.[28] Identifying genes that have significant impacts on AMD risk helps in the diagnosis and early detection of people at risk. Further, clarifying the key molecular pathways of pathogenesis also helps us know better about the disease and choose a key pathway to acutely detect and develop drugs for AMD. It can help patients get the best chance to customize different therapy and regain vision. But it has been difficult to identify the underlying genes and pathways of AMD. A large amount of research has been made in the past ten years in identifying genes associated with AMD, although much work is needed to be done about the complex molecular genetics of this disease. Expression levels of genes related to the angiogenesis pathways (VEGFA, HIF1a, PDGF) were analyzed with qRT-PCR. Intravitreal injections of anti-vascular endothelial growth factor (VEGF) treatments are currently used to treat wet AMD and macular edema.[29] But repetitive, chronic treatments may have consequences beyond the inhibition of angiogenesis. In summary, we combined microarray information from RPE-choroid and retinal tissue samples from patients with AMD. Importantly, the combinations of GSE125564 and GSE29801 have not been previously described. DEGs were found to involve in the process of AMD by affecting the DNA replication, G1/S transition, and integral component of the membrane. EMT plays a key role in the pathogenesis of subretinal fibrosis, the end-stage of AMD.[24] Olfml3, another URG we found, is a proangiogenic factor that promotes angiogenesis and it is also proved that inhibition of Olfml3 in endothelial cells effectively reduces angiogenesis.[25] We also found that COL3A1, which is one of the extracellular matrix (ECM)-related genes,[26,27] played an important role in the chemical modifications to ECM proteins and the regulation of cell function. As we all know, they may contribute to the aging of the Bruch membrane and the pathogenesis of AMD. On the other hand, Renata K.[30] proposed that LRP2-mediated degradation of some serum proteins might contribute to the formation of the BAB and the BRB, which control the selective transport of vitamins and other nutrients through the NPE and RPE cell layers. We first assumed that the alteration of the integrity of outer BRB, which keeps the choroidal vascular response in the retina, might lead to AMD and convert the dry AMD into wet AMD. To sum up, down-regulation of LRP2 may accelerate the alteration and vision loss. We found that these genes were expressed at high or low levels, suggesting that the aberrant expression of these genes affects the pathogenesis of AMD. Our study may contribute to understanding the mechanism of AMD at molecular levels, providing potential biomarkers and targets for the treatment of the disease. However, there are shortcomings in our study: lack of clinical information on AMD patients; insufficient population studies; and lacking studies both in vitro and in vivo. Thus, the preliminary results of our research should be confirmed with more samples and further fundamental experiments.
Conclusion
In this study, we combined microarray information from RPE-choroid and retinal tissue samples from patients with AMD. DEGs were found to involve in the process of AMD in many ways. Future research should focus more on harnessing potential biomarkers and targets to treat disease.
Financial support and sponsorship
Supported by National Natural Science Foundation of China (82070920); Laboratory animal research of “Science and technology innovation action plan” of Shanghai (201409006500); Major Interdisciplinary Projects in Key Fields of Tongji University in 2019 (15022150004).
Conflicts of interest
There are no conflicts of interest.
References
- 1.Henkind P. Senile macular degeneration. Annu Rev Med. 1971;22:95–102. doi: 10.1146/annurev.me.22.020171.000523. [DOI] [PubMed] [Google Scholar]
- 2.Gehrs KM, Anderson DH, Johnson LV, Hageman GS. Age-related macular degeneration—emerging pathogenetic and therapeutic concepts. Ann Med. 2006;38:450–71. doi: 10.1080/07853890600946724. [DOI] [PMC free article] [PubMed] [Google Scholar]
- 3.Coleman HR, Chan CC, Ferris FL, 3rd, Chew EY. Age-related macular degeneration. Lancet. 2008;372:1835–45. doi: 10.1016/S0140-6736(08)61759-6. [DOI] [PMC free article] [PubMed] [Google Scholar]
- 4.Ferris FL, 3rd, Wilkinson CP, Bird A, Chakravarthy U, Chew E, Csaky K, et al. Clinical classification of age-related macular degeneration. Ophthalmology. 2013;120:844–51. doi: 10.1016/j.ophtha.2012.10.036. [DOI] [PMC free article] [PubMed] [Google Scholar]
- 5.Chakravarthy U, Evans J, Rosenfeld PJ. Age related macular degeneration. BMJ. 2010;340:c981. doi: 10.1136/bmj.c981. [DOI] [PubMed] [Google Scholar]
- 6.Gong J, Cai H, Noggle S, Paull D, Rizzolo LJ, Del Priore LV, et al. Stem cell-derived retinal pigment epithelium from patients with age-related macular degeneration exhibit reduced metabolism and matrix interactions. Stem Cells Transl Med. 2020;9:364–76. doi: 10.1002/sctm.19-0321. [DOI] [PMC free article] [PubMed] [Google Scholar]
- 7.Newman AM, Gallo NB, Hancox LS, Miller NJ, Radeke CM, Maloney MA, et al. Systems-level analysis of age-related macular degeneration reveals global biomarkers and phenotype-specific functional networks. Genome Med. 2012;4:16. doi: 10.1186/gm315. [DOI] [PMC free article] [PubMed] [Google Scholar]
- 8.Christakis PG, Agrón E, Klein ML, Clemons TE, Campbell JP, Ferris FL, et al. Incidence of macular atrophy after untreated neovascular age-related macular degeneration:Age-related eye disease study report 40. Ophthalmology. 2020;127:784–92. doi: 10.1016/j.ophtha.2019.11.016. [DOI] [PMC free article] [PubMed] [Google Scholar]
- 9.Ferris FL, Davis MD, Clemons TE, Lee LY, Chew EY, Lindblad AS, et al. Asimplified severity scale for age-related macular degeneration:AREDS Report No. 18. Arch Ophthalmol. 2005;123:1570–4. doi: 10.1001/archopht.123.11.1570. [DOI] [PMC free article] [PubMed] [Google Scholar]
- 10.Huang DW, Sherman BT, Tan Q, Collins JR, Alvord WG, Roayaei J, et al. The DAVID gene functional classification tool:A novel biological module-centric algorithm to functionally analyze large gene lists. Genome Biol. 2007;8:R183. doi: 10.1186/gb-2007-8-9-r183. [DOI] [PMC free article] [PubMed] [Google Scholar]
- 11.von Mering C, Huynen M, Jaeggi D, Schmidt S, Bork P, Snel B, et al. STRING:A database of predicted functional associations between proteins. Nucleic Acids Res. 2003;31:258–61. doi: 10.1093/nar/gkg034. [DOI] [PMC free article] [PubMed] [Google Scholar]
- 12.Theurl M, Song D, Clark E, Sterling J, Grieco S, Altamura S, et al. Mice with hepcidin-resistant ferroportin accumulate iron in the retina. FASEB J. 2016;30:813–23. doi: 10.1096/fj.15-276758. [DOI] [PMC free article] [PubMed] [Google Scholar]
- 13.Wei TT, Zhang MY, Zheng XH, Xie TH, Wang W, Zou J, et al. Interferon-g induces retinal pigment epithelial cell Ferroptosis by a JAK1-2/STAT1/SLC7A11 signaling pathway in age-related macular degeneration. FEBS J. 2022;289:1968–983. doi: 10.1111/febs.16272. [DOI] [PubMed] [Google Scholar]
- 14.Manes G, Meunier I, Avila-Fernández A, Banfi S, Le Meur G, Zanlonghi X, et al. Mutations in IMPG1 cause vitelliform macular dystrophies. Am J Hum Genet. 2013;93:571–8. doi: 10.1016/j.ajhg.2013.07.018. [DOI] [PMC free article] [PubMed] [Google Scholar]
- 15.Olivier G, Corton M, Intartaglia D, Verbakel SK, Sergouniotis PI, Le Meur G, et al. Pathogenic variants in IMPG1 cause autosomal dominant and autosomal recessive retinitis pigmentosa. J Med Genet. 2021;58:570–8. doi: 10.1136/jmedgenet-2020-107150. [DOI] [PubMed] [Google Scholar]
- 16.Persad PJ, Heid IM, Weeks DE, Baird PN, de Jong EK, Haines JL, et al. Joint analysis of nuclear and mitochondrial variants in age-related macular degeneration identifies novel Loci TRPM1 and ABHD2/RLBP1. Invest Ophthalmol Vis Sci. 2017;58:4027–38. doi: 10.1167/iovs.17-21734. [DOI] [PMC free article] [PubMed] [Google Scholar]
- 17.AlTalbishi A, Zelinger L, Zeitz C, Hendler K, Namburi P, Audo I, et al. TRPM1 mutations are the most common cause of autosomal recessive congenital stationary night blindness (CSNB) in the Palestinian and Israeli populations. Sci Rep. 2019;9:12047. doi: 10.1038/s41598-019-46811-7. [DOI] [PMC free article] [PubMed] [Google Scholar]
- 18.Ratnapriya R, Zhan X, Fariss RN, Branham KE, Zipprer D, Chakarova CF, et al. Rare and common variants in extracellular matrix gene Fibrillin 2 (FBN2) are associated with macular degeneration. Hum Mol Genet. 2014;23:5827–37. doi: 10.1093/hmg/ddu276. [DOI] [PMC free article] [PubMed] [Google Scholar]
- 19.Khan KN, Robson A, Mahroo OAR, Arno G, Inglehearn CF, Armengol M, et al. Aclinical and molecular characterisation of CRB1-associated maculopathy. Eur J Hum Genet. 2018;26:687–94. doi: 10.1038/s41431-017-0082-2. [DOI] [PMC free article] [PubMed] [Google Scholar]
- 20.Roshandel D, Thompson JA, Heath Jeffery RC, Sampson DM, Chelva E, McLaren TL, et al. Multimodal retinal imaging and microperimetry reveal a novel phenotype and potential trial end points in CRB1-associated retinopathies. Transl Vis Sci Technol. 2021;10:38. doi: 10.1167/tvst.10.2.38. [DOI] [PMC free article] [PubMed] [Google Scholar]
- 21.Ma X, Li H, Wang Y, Wang J, Zheng Q, Hua J, et al. DAPL1, a susceptibility locus for age-related macular degeneration, acts as a novel suppressor of cell proliferation in the retinal pigment epithelium. Hum Mol Genet. 2017;26:1612–21. doi: 10.1093/hmg/ddx063. [DOI] [PubMed] [Google Scholar]
- 22.Grassmann F, Friedrich U, Fauser S, Schick T, Milenkovic A, Schulz HL, et al. Acandidate gene association study identifies DAPL1 as a female-specific susceptibility locus for age-related macular degeneration (AMD) Neuromolecular Med. 2015;17:111–20. doi: 10.1007/s12017-015-8342-1. [DOI] [PMC free article] [PubMed] [Google Scholar]
- 23.Zhang G, Yang W, Li D, Li X, Huang J, Huang R, et al. lncRNA FEZF1-AS1 promotes migration, invasion and epithelial-mesenchymal transition of retinoblastoma cells by targeting miR-1236-3p. Mol Med Rep. 2020;22:3635–44. doi: 10.3892/mmr.2020.11478. [DOI] [PMC free article] [PubMed] [Google Scholar]
- 24.Shu DY, Butcher E, Saint-Geniez M. EMT and EndMT:Emerging roles in age-related macular degeneration. Int J Mol Sci. 2020;21:4271. doi: 10.3390/ijms21124271. [DOI] [PMC free article] [PubMed] [Google Scholar]
- 25.Miljkovic-Licina M, Hammel P, Garrido-Urbani S, Lee BPL, Meguenani M, Chaabane C, et al. Targeting olfactomedin-like 3 inhibits tumor growth by impairing angiogenesis and pericyte coverage. Mol Cancer Ther. 2012;11:2588–99. doi: 10.1158/1535-7163.MCT-12-0245. [DOI] [PubMed] [Google Scholar]
- 26.Sakai Y, Yamamori T, Yasui H, Inanami O. Downregulation of the DNA repair enzyme apurinic/apyrimidinic endonuclease 1 stimulates transforming growth factor-b1 production and promotes actin rearrangement. Biochem Biophys Res Commun. 2015;461:35–41. doi: 10.1016/j.bbrc.2015.03.163. [DOI] [PubMed] [Google Scholar]
- 27.Wang Z, Paik DC, Del Priore LV, Burch RL, Gaillard ER. Nitrite-modified extracellular matrix proteins deleteriously affect retinal pigment epithelial cell function and viability:A comparison study with nonenzymatic glycation mechanisms. Curr Eye Res. 2005;30:691–702. doi: 10.1080/02713680590968259. [DOI] [PubMed] [Google Scholar]
- 28.DeAngelis MM, Owen LA, Morrison MA, Morgan DJ, Li M, Shakoor A, et al. Genetics of age-related macular degeneration (AMD) Hum Mol Genet. 2017;26:R46–50. doi: 10.1093/hmg/ddx343. [DOI] [PMC free article] [PubMed] [Google Scholar]
- 29.Schneider K, Chwa M, Atilano SR, Shao Z, Park J, Karageozian H, et al. Differential effects of risuteganib and bevacizumab on AMD cybrid cells. Exp Eye Res. 2021;203:108287. doi: 10.1016/j.exer.2020.108287. [DOI] [PMC free article] [PubMed] [Google Scholar]
- 30.Renata K, Olivier C. LRP2 A Myopic Hotspot between Environment and Genetics. Adv Ophthalmol Vis Syst. 2017;7:259–63. [Google Scholar]