

SUMMARY:
Bioluminescent tools can illuminate cellular features in whole organisms. Multi-component tracking remains challenging, though, owing to a lack of well-resolved probes and long imaging times. To address the need for more rapid, quantitative, and multiplexed bioluminescent readouts, we developed an analysis pipeline featuring sequential substrate administration and serial image acquisition. Light output from each luciferin is “layered” on top of the previous image, with minimal delay between substrate delivery. A MATLAB algorithm was written to analyze bioluminescent images generated from the rapid imaging protocol and deconvolute (i.e., unmix) signals from luciferase-luciferin pairs. Mixtures comprising 3–5 luciferase reporters were readily distinguished in under 50 minutes; this same experiment would require days using conventional workflows. We further showed that the algorithm can be used to accurately quantify luciferase levels in heterogeneous mixtures. Based on its speed and versatility, the multiplexed imaging platform will expand the scope of bioluminescence technology.
In Brief
Bioluminescent probes are routinely used to track biological processes in vitro and in vivo. Multiplexed imaging remains challenging, though, owing to a lack of well-resolved probes and lengthy times. Brennan, et al. report a straightforward platform for rapid, quantitative analyses of bioluminescent mixtures.
Graphical Abstract

INTRODUCTION
Bioluminescence imaging (BLI) with luciferase-luciferin pairs is a popular method for visualizing cells and other biological features in heterogeneous environments (Syed and Anderson, 2021; Yeh and Ai, 2019). BLI relies on photons generated from the oxidation of small molecule luciferins by luciferase enzymes (Figure 1a) (Love and Prescher, 2020; Sanford and Palmer, 2017). Luciferases can be incorporated into many cell types and report on biological phenomena, including cell movements, proliferation, and gene expression (Contag and Bachmann, 2002; Paley and Prescher, 2014). Since no external light is needed, sensitive imaging in thick tissues and whole organisms is possible. As a few as 1–10 cells can be reliably tracked using optimized probes (Liu et al., 2010; Rabinovich et al., 2008). Recent years have also seen a surge in bioluminescent tool development for various applications (Love and Prescher, 2020; Yao et al., 2018). Engineered enzymes and analogs with enhanced light output (Hall et al., 2012; Iwano et al., 2018), red-shifted emission (Chu et al., 2016; Kuchimaru et al., 2016; Yeh et al., 2017), and improved biocompatibility (Su et al., 2020; Yeh et al., 2019), are now widely available (Rathbun and Prescher, 2017; Yeh and Ai, 2019). Additionally, an increasing number of in vitro assays have capitalized on the user-friendly features and broad compatibility of BLI (Elledge et al., 2021; Griss et al., 2014; Quijano-Rubio et al., 2021; Thorne et al., 2010). Recent examples include methods for monitoring protein-protein interactions (Dixon et al., 2016; Machleidt et al., 2015) and high-throughput drug discovery (Fan and Wood, 2007; Thorne et al., 2012), among others (Dale et al., 2019; Kobayashi et al., 2019).
Figure 1. Rapid, multiplexed bioluminescence imaging via sequential substrate administration and serial acquisition.
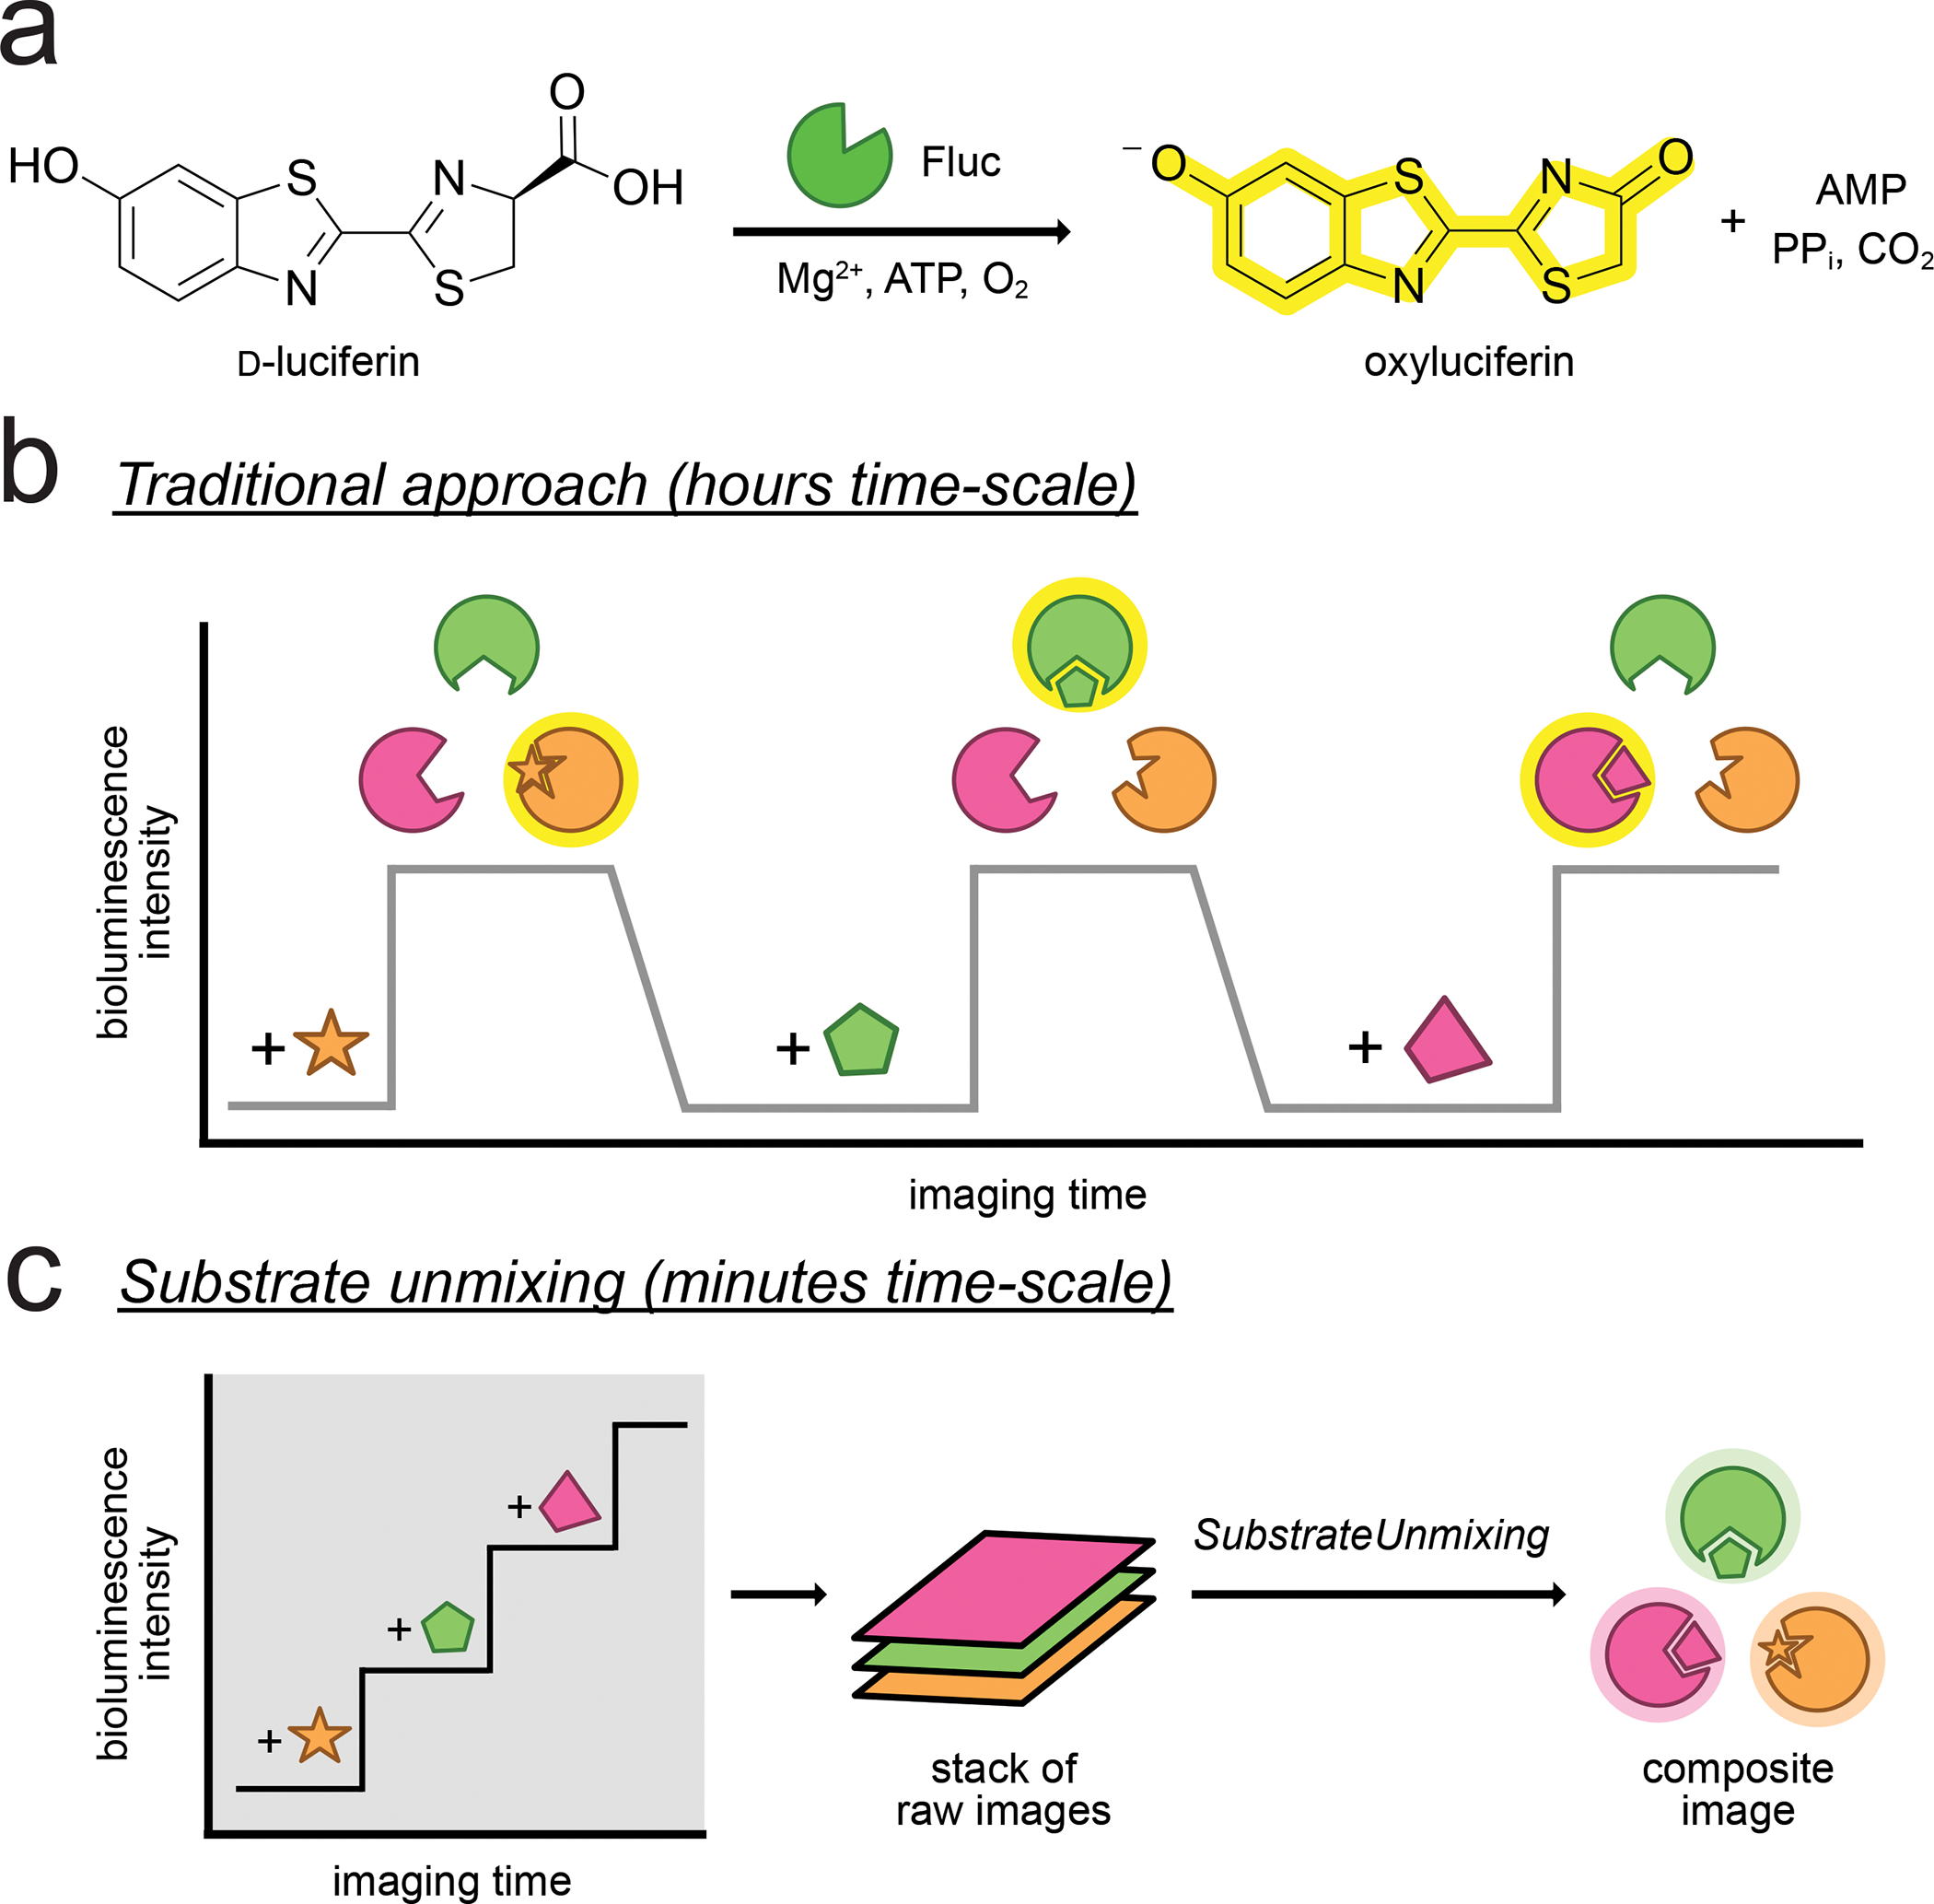
(a) Optical imaging with bioluminescent probes. A photon of light is produced when D-luciferin (D-luc) is oxidized by firefly luciferase (Fluc). (b) Traditional approach for resolving multiple bioluminescent reporters. Signal from one luciferin must clear before addition of the next luciferin. The required imaging time scales with the number of probes, and can be impractical when more than three targets are involved. (c). Imaging times can be shortened by consecutive substrate application. The resulting images comprise multiple layers of photon output, and require an unmixing step to deconvolute the signal source.
While popular, traditional bioluminescent probes have been slow to transition to imaging more than one target at a time in live cells and organisms. This is due, in part, to a lack of methods and probes for routine multiplexing (Love and Prescher, 2020; Rathbun and Prescher, 2017). Bioluminescent reporters cannot be easily separated based on emission wavelengths alone, and the inherent broadness of their spectra makes spectral resolution difficult to achieve at varying tissue depths. Improved separation can be achieved with more refined optical filters and spectral unmixing algorithms, but most examples have been limited to two probes (Aswendt et al., 2019; Kleinovink et al., 2019; Stowe et al., 2019; Zambito et al., 2021). Luciferases can also be differentiated based on luciferin recognition patterns (substrate resolution) (Jones et al., 2017; Williams and Prescher, 2019). In these cases, light is produced when complementary enzymes and substrates interact. Most examples to date have featured naturally orthogonal probes with perfect selectivity (Maguire et al., 2013; Moroz et al., 2021; Williams and Prescher, 2019). Larger collections of compatible luciferases have been difficult to identify, though, due to the promiscuous nature of the engineered enzymes and cross-reactivities with different substrates.
Routine implementation of orthogonal probes has been further limited by lengthy imaging times (Moroz et al., 2021; Rathbun et al., 2021; Rathbun et al., 2017; Su et al., 2020). Substrates are typically administered at saturating doses to maximize photon output, and the signal from the preceding injection must clear before the next substrate can be delivered (Figure 1b). This process can take ~8–24 h depending on the substrate (Gross et al., 2007; Sim et al., 2011). The imaging window can be shortened by combining spectral and substrate resolution. For example, Mezzanotte and coworkers showed that dual tracking is possible within 3–4 h using NIR probes that were both spectrally distinct and processed by two unique enzymes (Zambito et al., 2021). Imaging a larger number of probes within a practical time frame, though, still remains challenging.
To speed up multi-substrate BLI, we recently adopted a strategy termed substrate unmixing that features sequential acquisition and signal deconvolution (Gammon et al., 2006; Rathbun et al., 2021). In this approach, each substrate is added with minimal delay, and a final processing step is used to delineate the signals (Figure 1c). Each luciferin thus provides a unique emission fingerprint (or “barcode”) with the collection of enzymes. Conceptually, substrate unmixing is similar to time-domain fluorescence imaging in which the lifetimes of excited state fluorophores are used to deconvolute multiple spectral elements (Berezin and Achilefu, 2010; Datta et al., 2020). Analogous lifetime measurements are difficult to obtain for bioluminescence probes, but barcoding changes in reactivity (via orthogonal substrate application) is a sufficient substitute. Related approaches have expanded the number of detectable targets in fluorescence-based transcriptomics and synaptic profiling (Eng et al., 2019; Guo et al., 2019; Seo et al., 2022). The substrate unmixing approach was compatible with existing spectral unmixing algorithms for in vitro and in vivo BLI (Rathbun et al., 2021; Sarrion-Perdigones et al., 2019). However, the method required multiple post-processing steps, including the generation of simulated input images. The algorithm also relied on pseudo-linear equations, where the number of input images could exceed the number of output images. We aimed to use perfectly linear equations (one input to one output) for improved and streamlined multi-substrate BLI. The ideal method would exclude unnecessary inputs and provide easy-to-analyze outputs compatible with ImageJ and other popular processing platforms.
Here we report a platform for rapid, quantitative orthogonal imaging featuring a MATLAB-based linear unmixing algorithm. This algorithm, dubbed SubstrateUnmixing, was first validated using three engineered firefly luciferase mutants: Cashew, Pecan and Akaluc (Kitada et al., 2018; Rathbun et al., 2021). We demonstrated that the analysis is suitable for deconvoluting cell mixtures of multiple luciferases in heterogenous environments. In all cases, complementary substrates were added in quick succession and acquisitions were complete on the minutes time scale (~10 min per target). SubstrateUnmixing also enabled five-component BLI tracking in one hour, based solely on substrate preference – a record in the field. We further established a quantification platform by coupling the algorithm with calibration curves in tandem. The versatility and speed of the imaging method expands the capabilities of bioluminescence for visualizing dynamic, multicomponent processes.
RESULTS
MATLAB linear unmixing algorithm for multi-substrate BLI.
We set out to develop a custom MATLAB algorithm, dubbed SubstrateUnmixing, for rapid, multi-component BLI. In previous work, we co-opted existing algorithms for deconvoluting spectrally resolved probes and applied them to collections of orthogonal luciferases (Gammon et al., 2006; Rathbun et al., 2021). These approaches required an input image where no emission filter was present. The “no filter” image was generated de novo, adding unnecessary computing time. Because this input is not required for substrate unmixing, we decided to remove it in our next-generation algorithm. The number of inputs would therefore equal the number of probes being resolved, better capitalizing on the linear acquisition workflow and unique reactivity patterns of engineered bioluminescent pairs. In addition, we included image processing steps (e.g., pixel value normalization) in the algorithm itself, making it turn-key for the end user.
SubstrateUnmixing was modeled after algorithms used to differentiate among ultrasound and related reporters (Farhadi et al., 2019; Gammon et al., 2006) (Figure 2). For an experiment featuring i luciferase-luciferin pairs, a total of i consecutive images would be acquired (one per pair). The signal in a given image would encompass photons generated from the corresponding luciferin (with all luciferases) and from the previous substrates. Consequently, the photon intensity value (p) in each pixel could be specified using a set of linear equations:
| (1) |
where s is the designated substrate for an image (s1 being the first substrate), l is the luciferase in the image, c is the relative contribution of each enzyme present, and R is the residual signal and image noise from the previous acquisition. This equation could be written more simply for each pixel as:
| (2) |
Figure 2. Derivation of the SubstrateUnmixing algorithm.
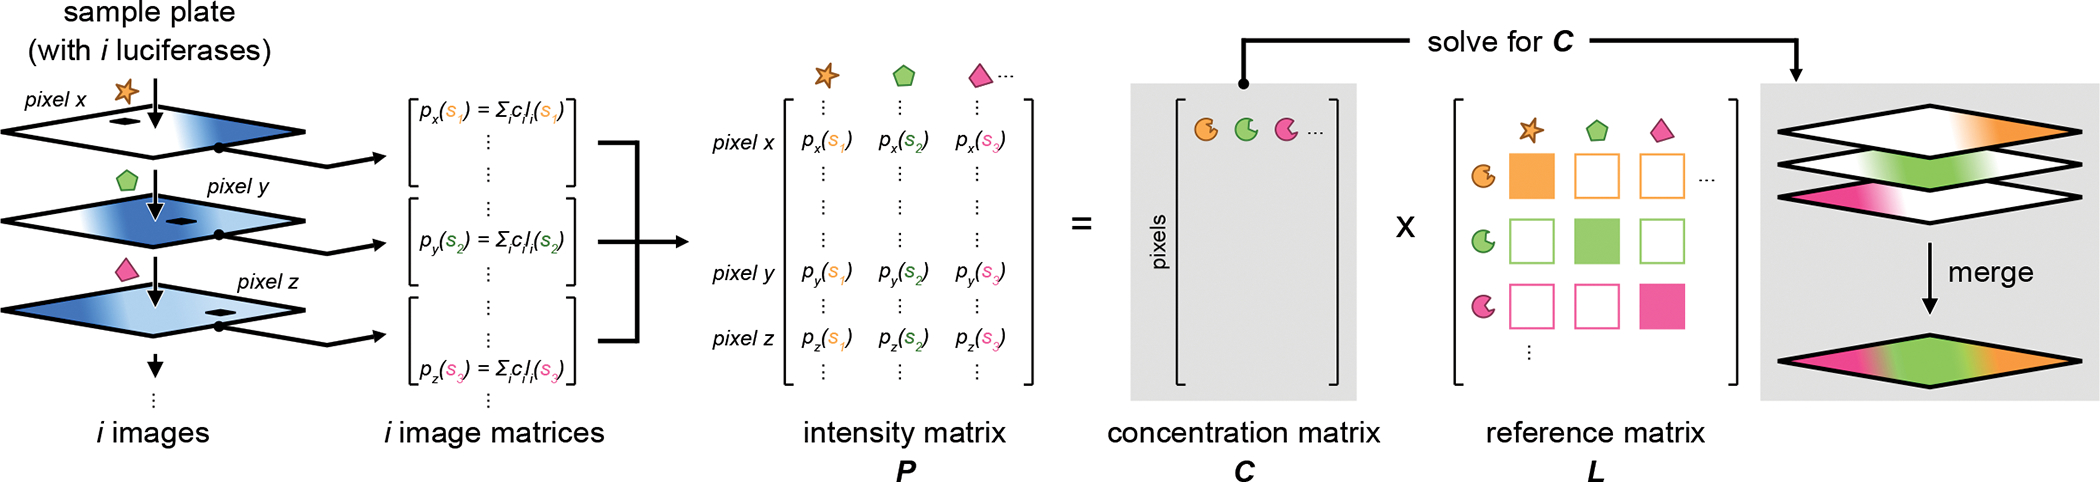
The collection of acquired images is first transformed to an array of matrices. Photon signal at each pixel is defined as the sum of photons produced from the given substrate with the plausible luciferase present. Next, the compiled image matrices are converted into an intensity matrix P. This matrix can be re-defined as a system of linear equations according to equation (4). Lastly, solving for the concertation matrix C affords a stack of unmixed images, representing the abundance of individual luciferases.
The collective intensities for all pixels across the entire image could thus be represented in matrix format:
| (3) |
where matrix P comprises columns for the pixel intensity recorded after each substrate addition, and rows for each pixel in the image. All signals collected from the experiment would be encoded in P. L is a reference matrix containing the light emission values from all possible luciferase-luciferin combinations in the experiment, including cross-reactivities between unmatched pairs. Each column in L corresponds to the luciferin used to acquire the image, and each row denotes the possible luciferase involved. Biochemically, the values in each column of matrix L represent the reactivity fingerprint, or “emission barcode,” of each substrate with the collection of enzymes. Each barcode would be unique for a given probe set. The values in L could be influenced by substrate pharmacokinetics and signal dynamics (e.g., duration of residual signal from previous images), and would be determined empirically for each experiment. Based on these considerations, we anticipated that SubstrateUnmixing could differentiate probes based on a spectrum of reactivity, and would be well suited for multi-component imaging with larger sets of engineered (and imperfectly selective) luciferases. Promiscuous luciferase activity could actually be desirable, as the entire pattern would be considered when resolving the bioluminescent reporters.
Lastly, C is the matrix representing the unknown contribution of each luciferase reporter, the key variable in every experiment. Solving equation (3) for C would provide the luciferase identity and abundance (relative to the reference L) present in each pixel:
| (4) |
and rearranging:
| (5) |
This solution could be used to generate a set of false color images for each luciferase-luciferin pair.
In previous work, we established that the unmixing approach required probes to be illuminated from dimmest to brightest. Each luciferin that is layered-in must be brighter than the preceding one (Kleinovink et al., 2019; Rathbun et al., 2021). We termed this criterion “intensity resolution” as the probes need to exhibit a range of photon outputs. Intensity resolution pushes residual signal from earlier probes into the background when successive, brighter probes are applied. This requirement is captured by equation (2), where in order for an emission barcode to be registered and used for unmixing, the following expression must hold:
| (6) |
SubstrateUnmixing similarly requires probes that are intensity resolved. The exact differential necessary varies based on the luciferase-luciferin pairs employed. Less intensity resolution is required for luciferases with more distinct luciferin usage patterns. By contrast, less selective luciferases require greater intensity differentials. The degree of resolution required for each probe set must be empirically determined, similar to matrix L. We initially focused on resolving probes with 10-fold or greater differences in emission intensity. This cutoff was selected based on the recognition that imaging reporters are typically used within their respective linear ranges of detection. Ten-fold differences in intensity would ensure that signals from recently applied probes would be clearly distinct from earlier ones. Moreover, previous work from us and Gammon, et al., showed that such differentials can be readily unmixed with standard bioluminescent detectors (Gammon et al., 2006; Rathbun et al., 2021). Many sets of popular bioluminescent reporters also meet the criterion for 10-fold intensity resolution, including Fluc/D-luc, Akaluc/AkaLumine, and NanoLuc/furimazine (Hall et al., 2012). In assays where reporters are used outside of the linear range (e.g. c1 >> c2), it is important to re-evaluate the order of substrate addition and choose one that satisfy the requirement set by equation (6).
Validating SubstrateUnmixing for rapid BLI.
With the custom algorithm in hand, we tested whether we could resolve a mixture of three established orthogonal reporters: Pecan, Cashew, and Akaluc (Figure 3a). Pecan and Cashew were previously engineered to preferentially process 4ʹ-BrLuc and D-luc, respectively (Jones et al., 2017; Rathbun et al., 2017). Akaluc was engineered to use AkaLumine, a red-shifted luciferin analog (Iwano et al., 2013; Kitada et al., 2018). Based on the substrate preference profiles, we reasoned that this combination of luciferases would be well suited for validating SubstrateUnmixing. We further ranked the probes from dimmest to brightest based on their reported catalytic efficiency: Pecan/4ʹ-BrLuc < Cashew/D-luc < Akaluc/AkaLumine (Iwano et al., 2018; Rathbun et al., 2021). Consequently, the maximum resolution would be achieved when the luciferins were added in the following order: 4ʹ-BrLuc, then D-luc, followed by AkaLumine. Cross-reactivities between unmatched luciferase-luciferin pairs (i.e., Cashew/4’-BrLuc) would likely be observed, but we anticipated a substantial increase in light emission when the brighter luciferin was added.
Figure 3. Rapid, three-component BLI via SubstrateUnmixing.
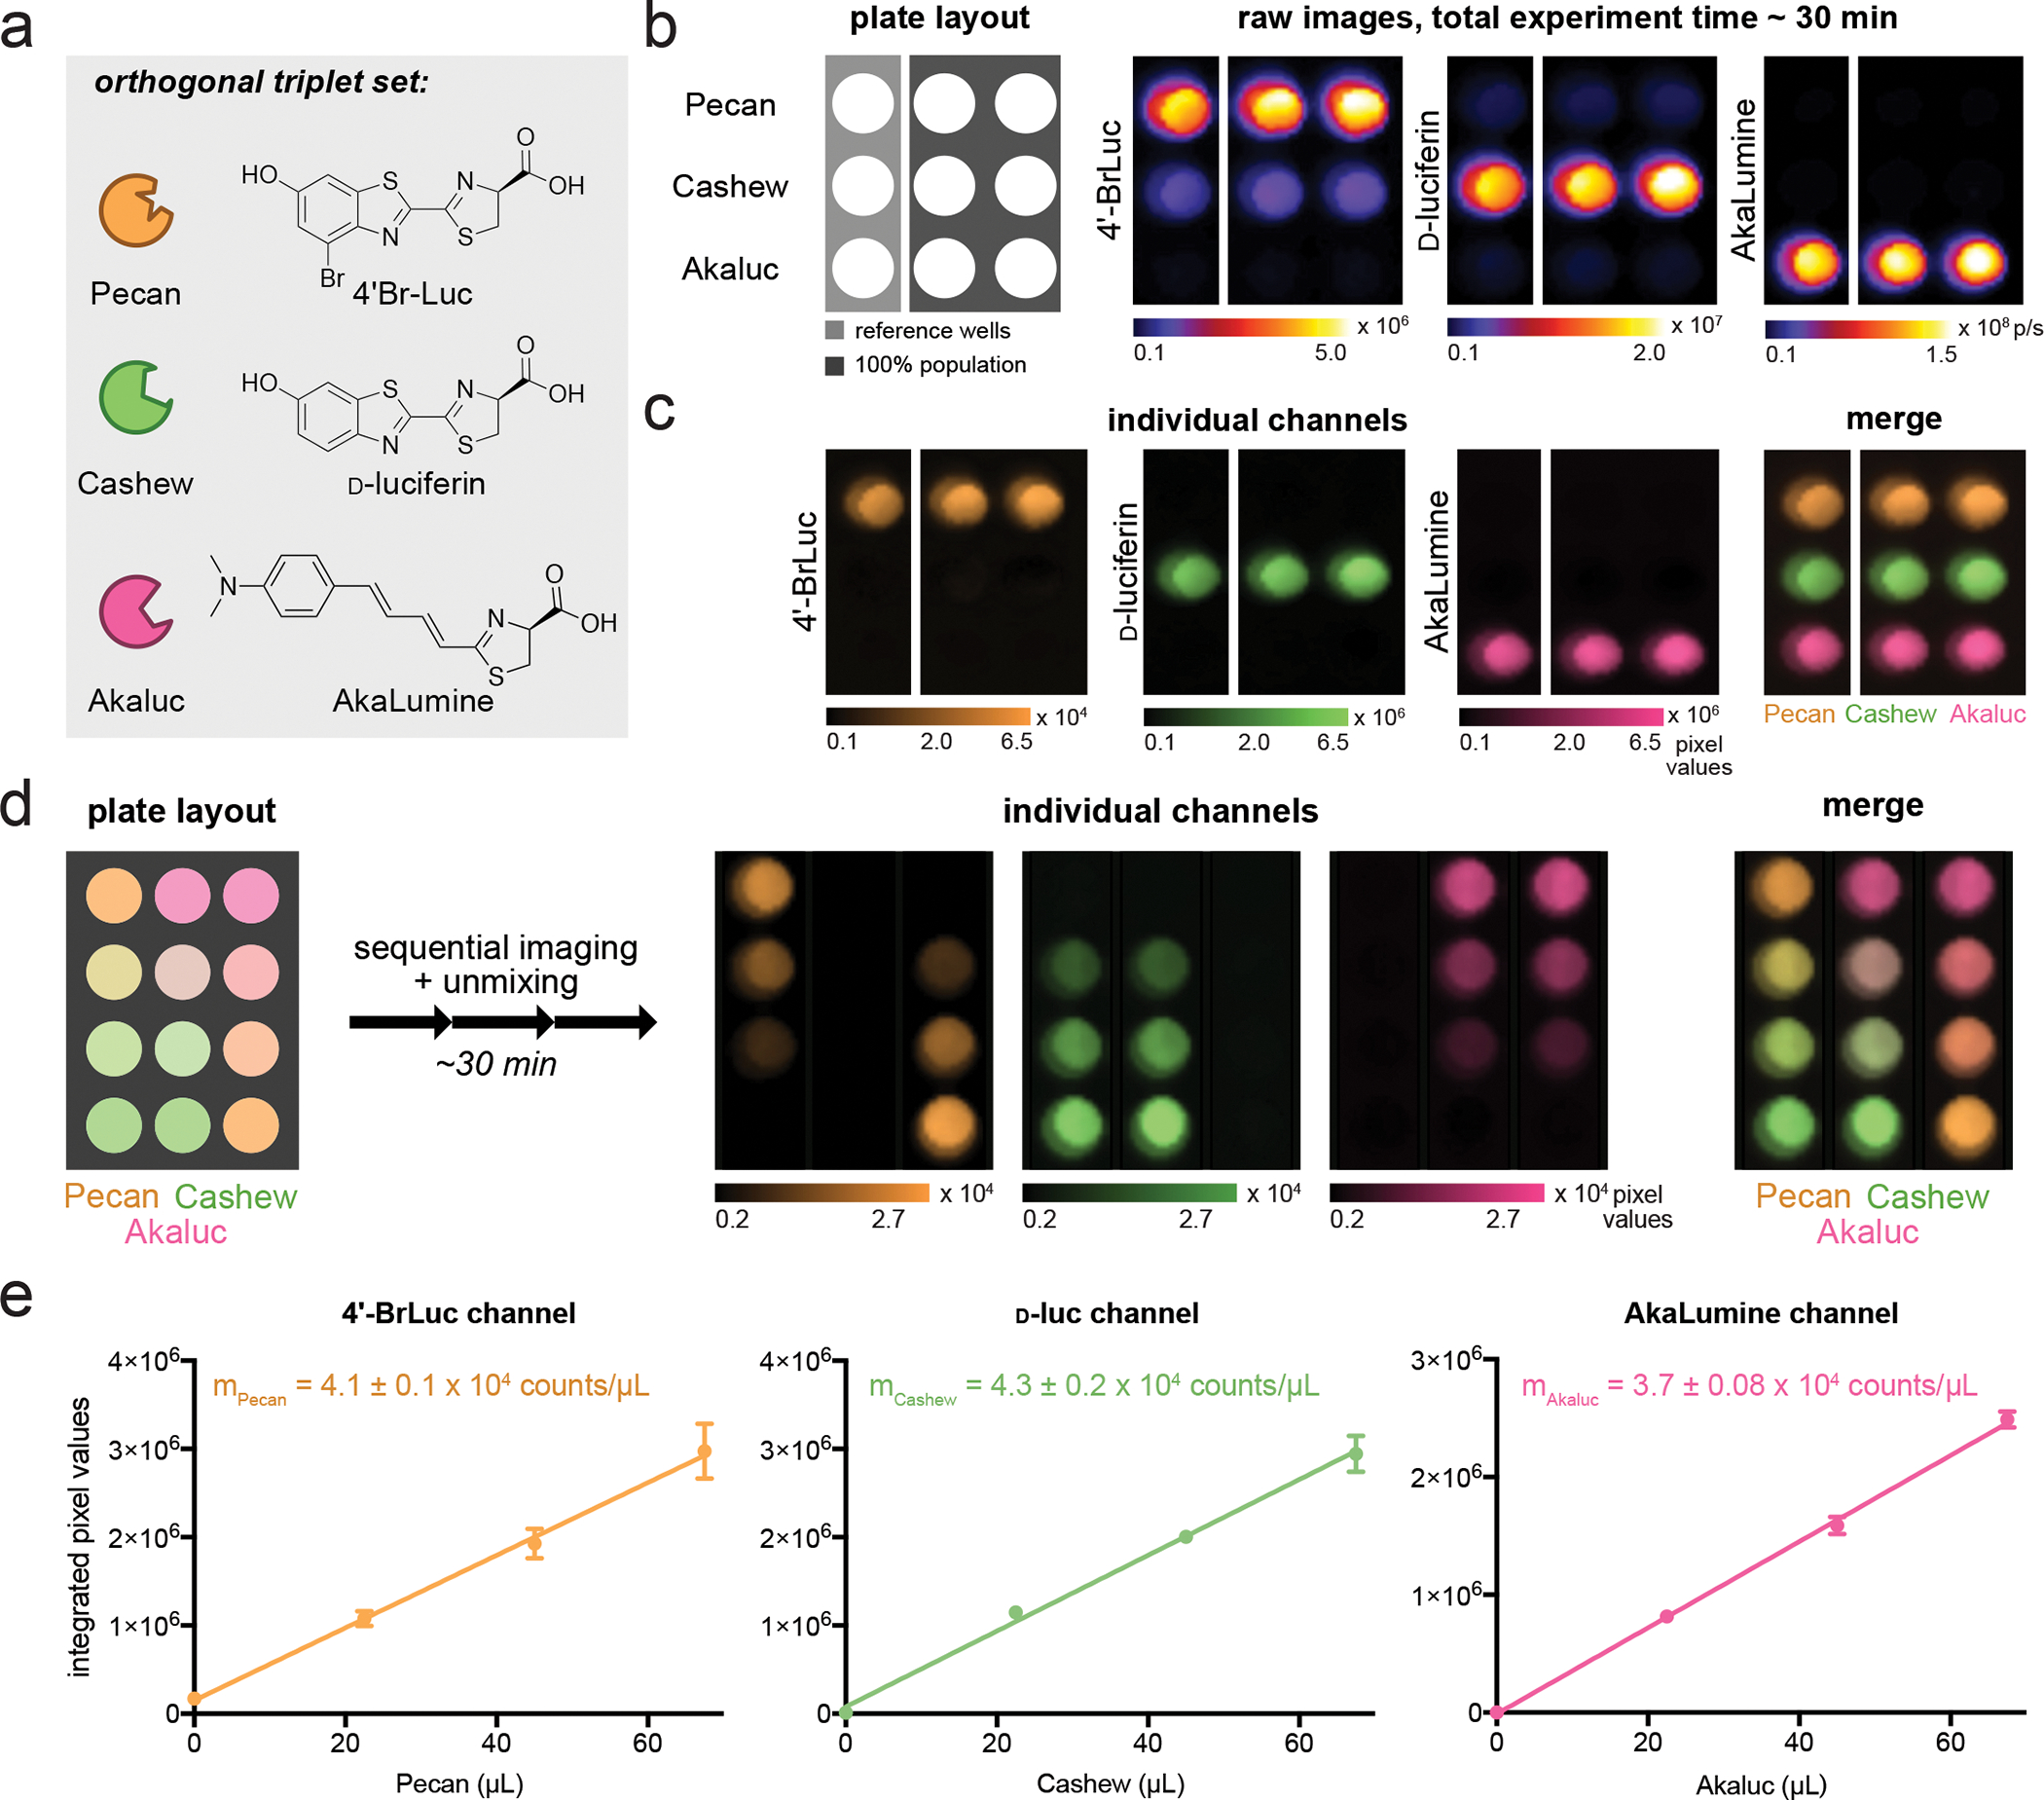
(a) The identity of luciferases and chemical structures of luciferins chosen for multiplexing. (b) DB7 cells expressing each luciferase were plated as shown. The corresponding substrates ([4ʹ-BrLuc] = [D-luc] = [AkaLumine] = 100 μM) were administered, beginning with the dimmest luciferin. Images were acquired after each addition. Image acquisition was completed within 30 minutes. (c) The raw data from (b) were unmixed using SubstrateUnmixing and false colored. (d) Bacteria expressing Pecan, Cashew, or Akaluc were plated as shown. The corresponding substrates ([4ʹ-BrLuc] = [D-luc] = [AkaLumine] = 100 μM) were administered and images were acquired after each addition. The raw data were unmixed using SubstrateUnmixing, false colored, and overlaid. (e) Linear regression analyses were performed on each channel from (a). In the 4’-BrLuc channel, the R2 value for signal from Pecan signal was 0.998. In the D-luc channel, the R2 value for signal from Cashew was 0.996. In the AkaLumine channel, the R2 value for signal from Akaluc was 0.999. Error bars represent the standard error of the mean for n = 2 replicate experiments.
We first evaluated the triplet set using bacterial and mammalian cells expressing Pecan, Cashew, or Akaluc. The cells were distributed across a 96-well plate as single populations (Figure 3b, Figure S1). 4ʹ-BrLuc was added first, and an image was acquired. When D-luc was added, the resulting image contained the expected signal from Cashew. Residual signal from 4ʹ-BrLuc was also present, but the output was much dimmer than the signal generated from D-luc. This same trend was observed when AkaLumine was added to the wells, with Akaluc emission dominating the final signal output. The raw images collected were then subjected to SubstrateUnmixing. All three enzyme-substrate pairs were readily discerned in the resulting unmixed images (Figure 3c). In this particular case, the probe set was sufficiently resolved such that the identities of the reporters were apparent from the raw images alone, prior to SubstrateUnmixing. It is important to note, though, that the unmixing platform did not interfere with the interpretation of the images. Signal deconvolution often becomes more necessary as the number of probes or overall complexity of the sample increases, resulting in images with undesired signals (e.g., Cashew lanes in Figure 3b). For these reasons, we recommend that SubstrateUnmixing be employed across all probe sets.
We anticipated that the imaging platform would be able to resolve complex mixtures of reporters. To confirm, we varied the number of bacterial cells across a 96-well plate (Figure 3d). Some wells contained two reporters, where the concentration of one was higher than the other. Substrates were administered sequentially, and an image was acquired between each addition. The reporters were successfully resolved using SubstrateUnmixing. For samples containing mixtures of reporters, the extracted pixel values correlated linearly with reporter load, suggesting efficient unmixing. Cross-talk was eliminated, as the algorithm uses the individual luciferin reactivity patterns (“barcodes”) to differentiate the luciferase reporters (Figure 3e). Notably, the imaging sessions for all triplet sets took ~30 min to complete, a drastic improvement over standard protocols requiring >24 h (Maguire et al., 2013; Rathbun et al., 2021). A second triplet set of reporters (Pecan/Akaluc/Antares) was validated using SubstrateUnmixing (Figure S2) (Yao et al., 2021b). In this case, luciferase-expressing mammalian cells were plated in gradients across a 96-well plate. Images were acquired as described above, and raw images were unmixed using a previously reported algorithm (Gammon et al., 2006), in addition to SubstrateUnmixing. Signals from “unmatched” luciferase-luciferin pairs were removed more effectively using the modified platform. Collectively, the in vitro tests demonstrated that SubstrateUnmixing can effectively deconvolute signals from luciferase reporters for multiplexed BLI.
We also examined whether SubstrateUnmixing could be used for processing in vivo images. Bioluminescence is routinely used for examining cell behavior and other biological processes in rodents and other preclinical models. In these cases, photons are typically acquired using a cooled CCD camera. The raw images generated from such acquisitions can be immediately uploaded to SubstrateUnmixing. Single populations of each luciferase reporter would then be used to generate matrix L. To evaluate the algorithm in this context, we analyzed a recently published dataset (Rathbun et al., 2021). In this experiment, different ratios of Pecan- and Cashew-expressing cells were implanted in mice. Images were acquired within ~1 h via sequential administration of 4ʹ-BrLuc and D-luc. Subjecting the data to SubstrateUnmixing successfully deconvoluted and identified the composition of engrafted mixtures (Figure S3). Collectively, these results suggest that SubstrateUnmixing can be implemented to analyze data from both in vitro and in vivo multi-component studies.
Rapid imaging with an expanded probe set.
We envisioned that four- and five-component imaging could be readily achieved by combining the Pecan-Cashew-Akaluc triplet with other well-established bioluminescent tools. One potential candidate was PhOH-Luc, a pi-extended luciferin, and its complementary luciferase, Almond (Yao et al., 2020). Given its unique structure, PhOH-Luc would likely exhibit a different emission barcode than 4ʹ-BrLuc, D-luc, or AkaLumine with a collection of luciferases. Indeed, we had previously shown that Almond/PhOH-Luc could be resolved from other bioluminescent reporters using a conventional workflow, where each substrate was supplied and imaged separately (Yao et al., 2020). The photon output from Almond/PhOH-Luc is also lower than that of the other probes within the triplet set, providing the necessary intensity resolution for rapid imaging. When the four reporters were treated with luciferins in succession, multiplexed imaging was complete in ~40 minutes (Figure S4a–c).
In addition to Almond/PhOH-Luc, we selected a marine luciferase, NanoLuc, to form a quartet of bioluminescent reporters (Hall et al., 2012). NanoLuc and FRZ are commonly used in combination with insect luciferases for dual-component imaging (Rathbun et al., 2021; Stacer et al., 2013; Su et al., 2020). The unique structural features of FRZ and its blue emission make NanoLuc a versatile reporter for both spectral and substrate multiplexing. NanoLuc is also substantially brighter than the Pecan, Cashew, and Akaluc probes, and can thus be intensity resolved. When integrated into the substrate unmixing workflow, combinations of NanoLuc and the other luciferases were resolved in less than 1 h (Figure S4d–f). This result highlights the “plug-and-play” nature of the SubstrateUnmixing algorithm, in that different combinations of reporters could be imaged without the need for additional enzyme or substrate engineering.
We further generated a quintet of reporters by combining Almond, Pecan, Cashew, Akaluc, and NanoLuc (Figure 4a). The order of luciferin addition necessary to achieve intensity resolution was PhOH-Luc, 4ʹ-BrLuc, D-luc, AkaLumine, then FRZ. When subjected to the luciferins, bacterial cells produced five sets of distinguishable barcodes (Figure 4b). Mixtures of luciferase-expressing bacteria were also examined. In this case, varying numbers of Almond-, Pecan-, Cashew, Akaluc- or NanoLuc-expressing cells were combined (Figure 4c–d). Serial imaging with the corresponding luciferins and unmixing enabled five-component imaging. Linear regression with the unmixed, pseudo-colored pixels further revealed the expected compositions (Figure S5). Similar to the preceding examples, the multicomponent experiments were completed within 1 hour (~10 min per reporter). Using conventional imaging conditions, such analyses would take several days.
Figure 4. Rapid, five-component BLI via SubstrateUnmixing.
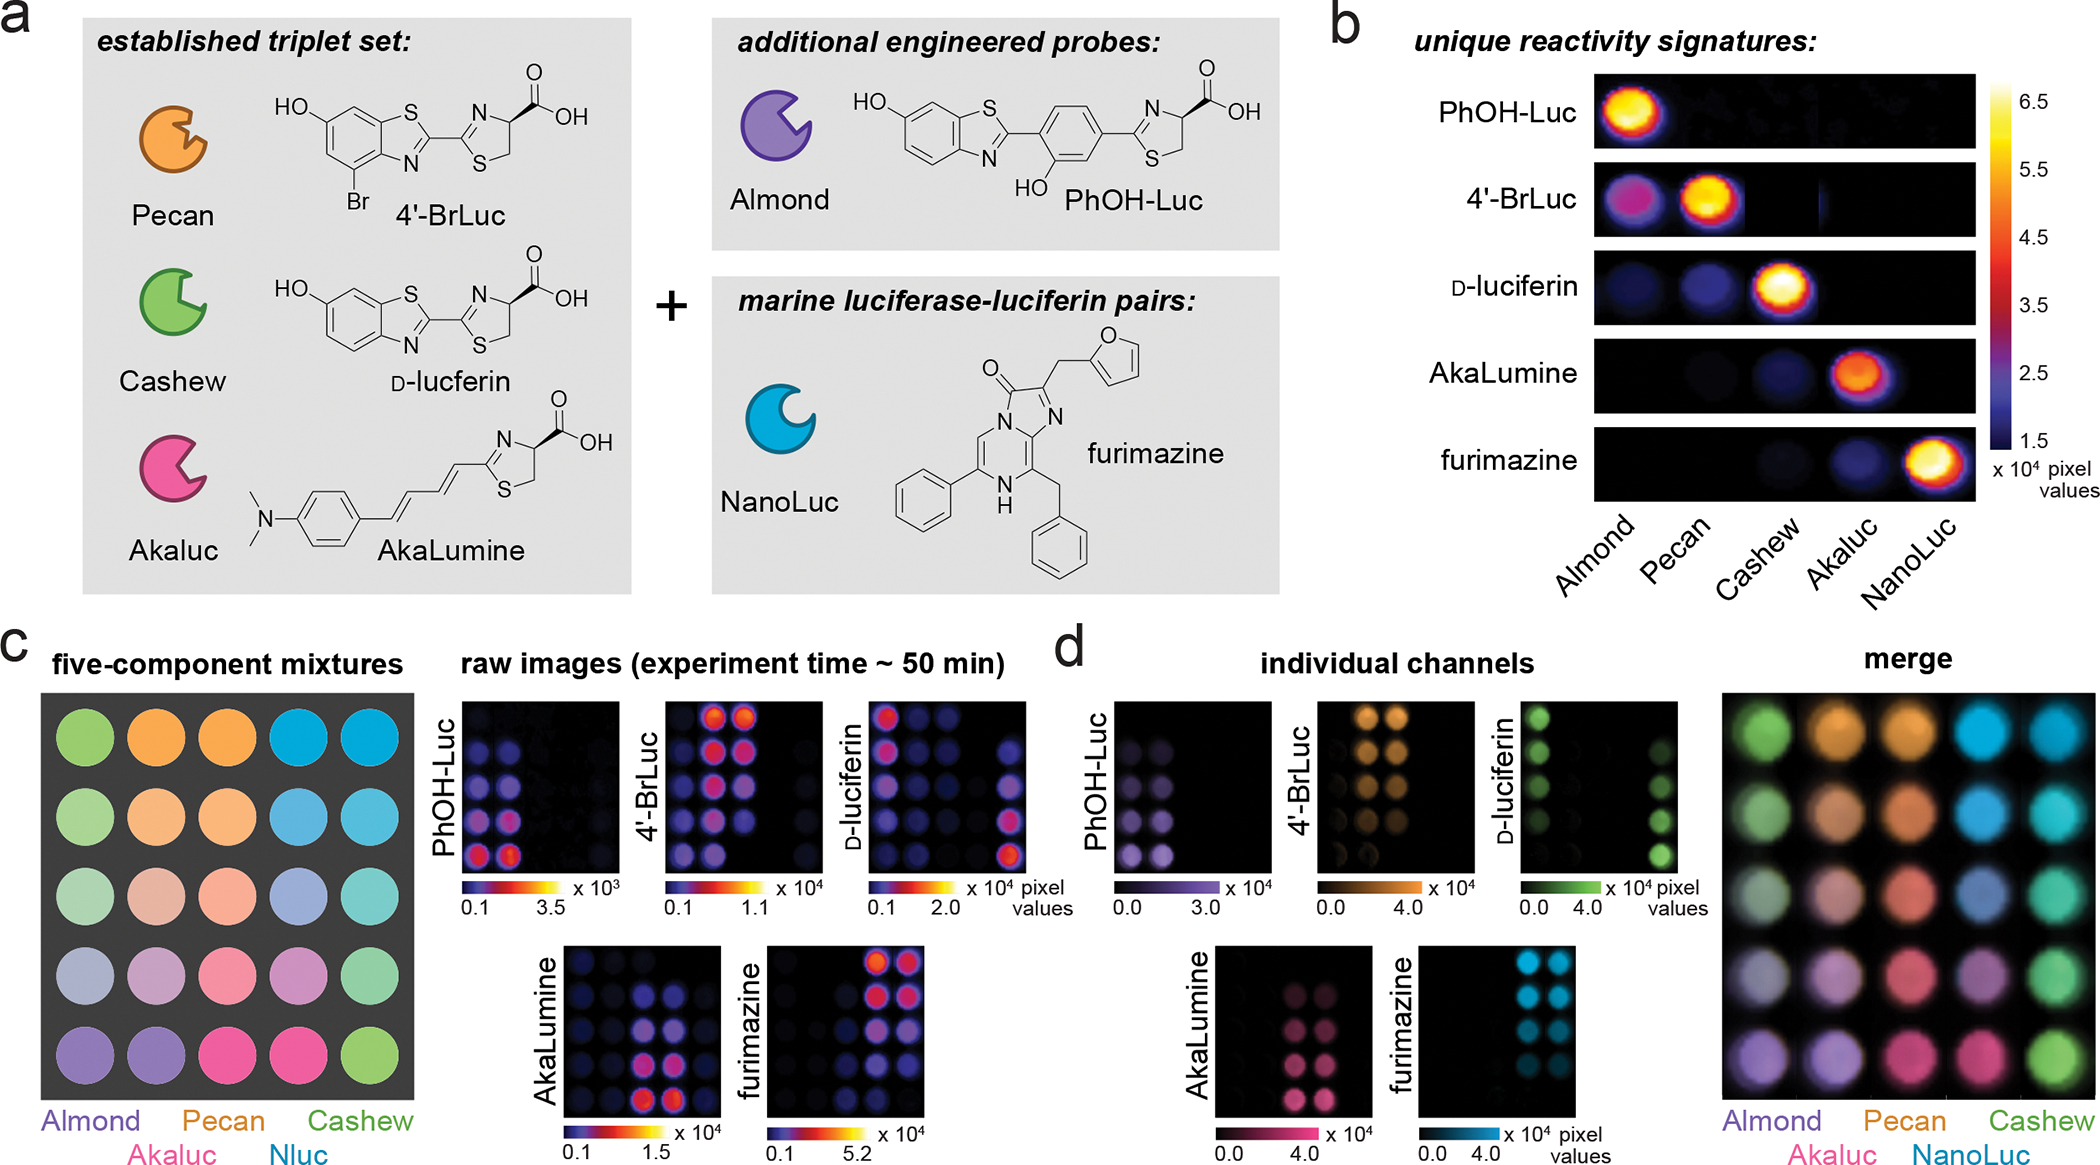
(a) The identity of luciferases and chemical structures of luciferins chosen for multiplexing. (b) Unique emission barcodes produced from luciferin addition. Signal intensities were normalized to highlight the distinct patterns. (c) Gradients of Almond, Pecan, Cashew, Akaluc and NanoLuc were plated as shown. The corresponding substrates were administered in the following order: PhOH-Luc (250 μM), 4′-BrLuc (100 μM), D-luc (100 μM), AkaLumine (100 μM), then furimazine (FRZ, 1:100 dilution from commercial stocks). An image was acquired after each addition. (d) The raw data from (c) were subjected to SubstrateUnmixing, unmixed, false colored, and overlaid.
Deconvoluting changes in reporter ratio.
Bioluminescent probes are often used to monitor relative changes in cell count or reporter expression within biological samples (Chaincy et al., 2007; Doyle et al., 2004; Gammon et al., 2006). We aimed to examine whether SubstrateUnmixing could report on such changes. Toward this end, we expressed the triplet set of reporters (Pecan, Cashew, and Akaluc) and diluted each culture to achieve altered reporter concentrations. The samples were then mixed such that the amount of one reporter was systematically varied and the other two were held constant (Figure 5a–c). Images were acquired and analyzed via SubstrateUnmixing (Figure S6a–b). As shown in Figure 5, the expected changes in luciferase signal were reflected in the intensity of the pseudo-colored pixels. Signals from channels where the reporters were held constant also remained stable across the range of ratios tested. The unmixed signals were highly correlated with the amount of culture present, as revealed by linear regression analyses (Figure 5d and Figure S6c). Similar results were obtained using mixtures of mammalian cells (Figure S7).
Figure 5. Analyzing changes in reporter ratio with SubstrateUnmixing.
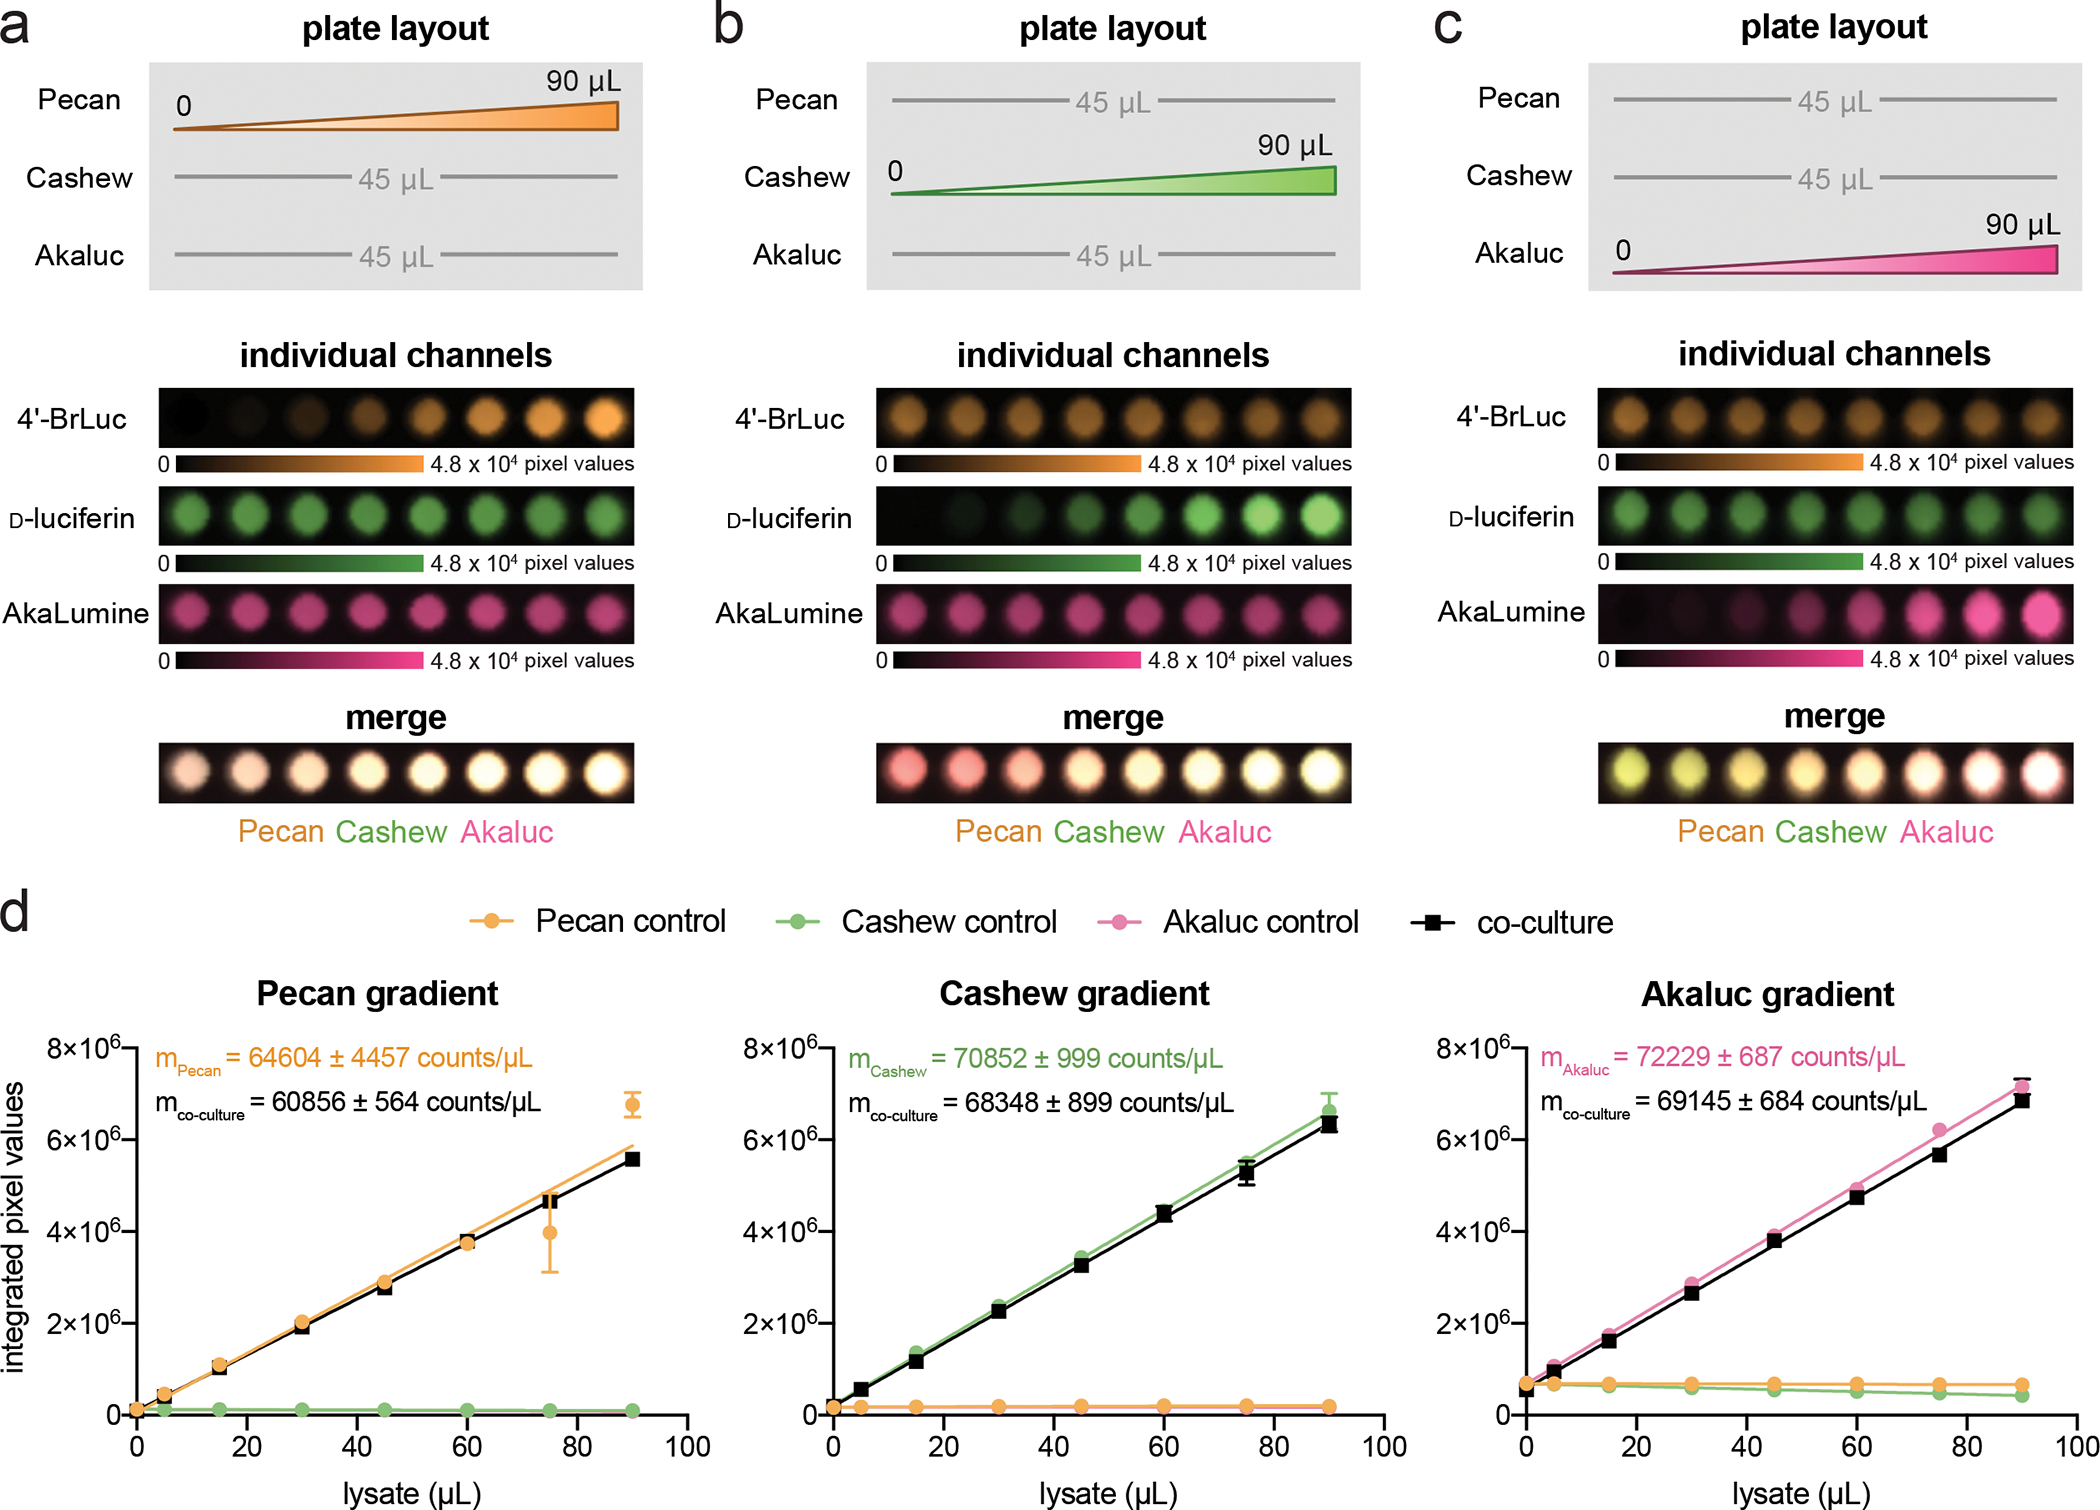
(a) Pecan, (b) Cashew, and (c) Akaluc were plated in a gradient (as shown). The amount of one reporter was diluted to mimic a change in reporter expression over time. The other two reporters were kept constant. The samples were treated with 4′-BrLuc (100 μM), D-luc (100 μM), and AkaLumine (100 μM) in succession. Raw images were acquired after each substrate addition and processed by the algorithm. The substrate-specific signals were unmixed, assigned false colors, and overlaid. (d) Quantification of images from (a)–(c), processed via SubstrateUnmixing and fit via linear regression. Pecan, Cashew, and Akaluc controls represent samples that only contained a gradient of one reporter (not shown). In each scenario, the unmixed signals correlated linearly with the amount of reporter in the single population (R2 = 0.938 for 4ʹ-BrLuc channel, R2 = 0.997 for D-luc channel, and R2 = 0.999 for AkaLumine channel) and co-culture samples (R2 = 0.999 for Pecan channel, R2 = 0.997 for D-luc channel, R2 = 0.999 for AkaLumine channel).
SubstrateUnmixing was further applied to monitor changes in substrate concentration. Bacteria cells expressing Pecan, Cashew, or Akaluc were plated in equal ratios (Figure S8). During sequential substrate administration, cells were treated with either a constant amount of luciferin or varying levels. Changes in substrate concentration were successfully deconvoluted with SubstrateUnmixing. In all cases, unmixed signals correlated linearly with the substrate being varied.
Quantitative multicomponent analysis via SubstrateUnmixing.
In addition to multiplexed imaging in heterogeneous samples, SubstrateUnmixing can be used for quantitative analyses of bioluminescent mixtures. Determining reporter concentrations from bioluminescent images requires standard curves and external validation. Such curves are rarely generated for in vivo experiments due to the complexities of photon absorption and scatter in tissue environments (Doyle et al., 2004; Gammon et al., 2006). Thus, BLI typically involves tracking relative changes in expression levels or cell growth (similar to Figure 5). Standardizing bioluminescent signals is more common for in vitro analyses, but traditionally limited to one reporter at a time. Each reporter must be separately calibrated with each substrate, and this approach becomes impractical when larger numbers of reporters are involved.
With substrate unmixing, we reasoned that simplified standard curves could be readily integrated into the rapid imaging pipeline. Only one set of standardized reporters would be required per experiment. This hypothesis was tested using a blinded setup with the Almond-Pecan-Cashew-Akaluc reporter set. Bacterial cultures comprising each luciferase were randomly mixed to create 12 samples of unknown composition (Figure 6a). Each mixture was plated in duplicate over a 96-well plate, and a standard curve was included. Substrates were administered to both the unknowns and standards simultaneously with minimal delay (Figure S9a–b, total experiment time = 40 min). SubstrateUnmixing was then used to analyze the images. Pixel values were quantified from each well, and the amount of luciferase present was calculated using the standard curve. The approach successfully predicted the composition of the 12 mixtures (m = 0.78–0.99, Figure 6b), with the calculated values in agreement with the actual quantity of each reporter present (Figure S9c). SubstrateUnmixing was also successfully able to deconvolute mixtures of reporters in heterogeneous matrices. Bacterial cultures comprising Pecan, Cashew, or Akaluc were suspended in an agarose matrix to mimic a tissue environment (Figure S10a). The cultures were plated over a 96-well plate either as random mixtures or as a standard curve, similar to the experiment in Figure 6. Images were acquired at peak emission, approximately 20 minutes after each substrate administration. The amount of culture present in the mixtures was accurately estimated based on the pixel intensities after unmixing (Figure S10b). These data set the stage for further applications for streamlined, multiplexed imaging in whole animal models.
Figure 6. Multicomponent, quantitative BLI via SubstrateUnmixing.
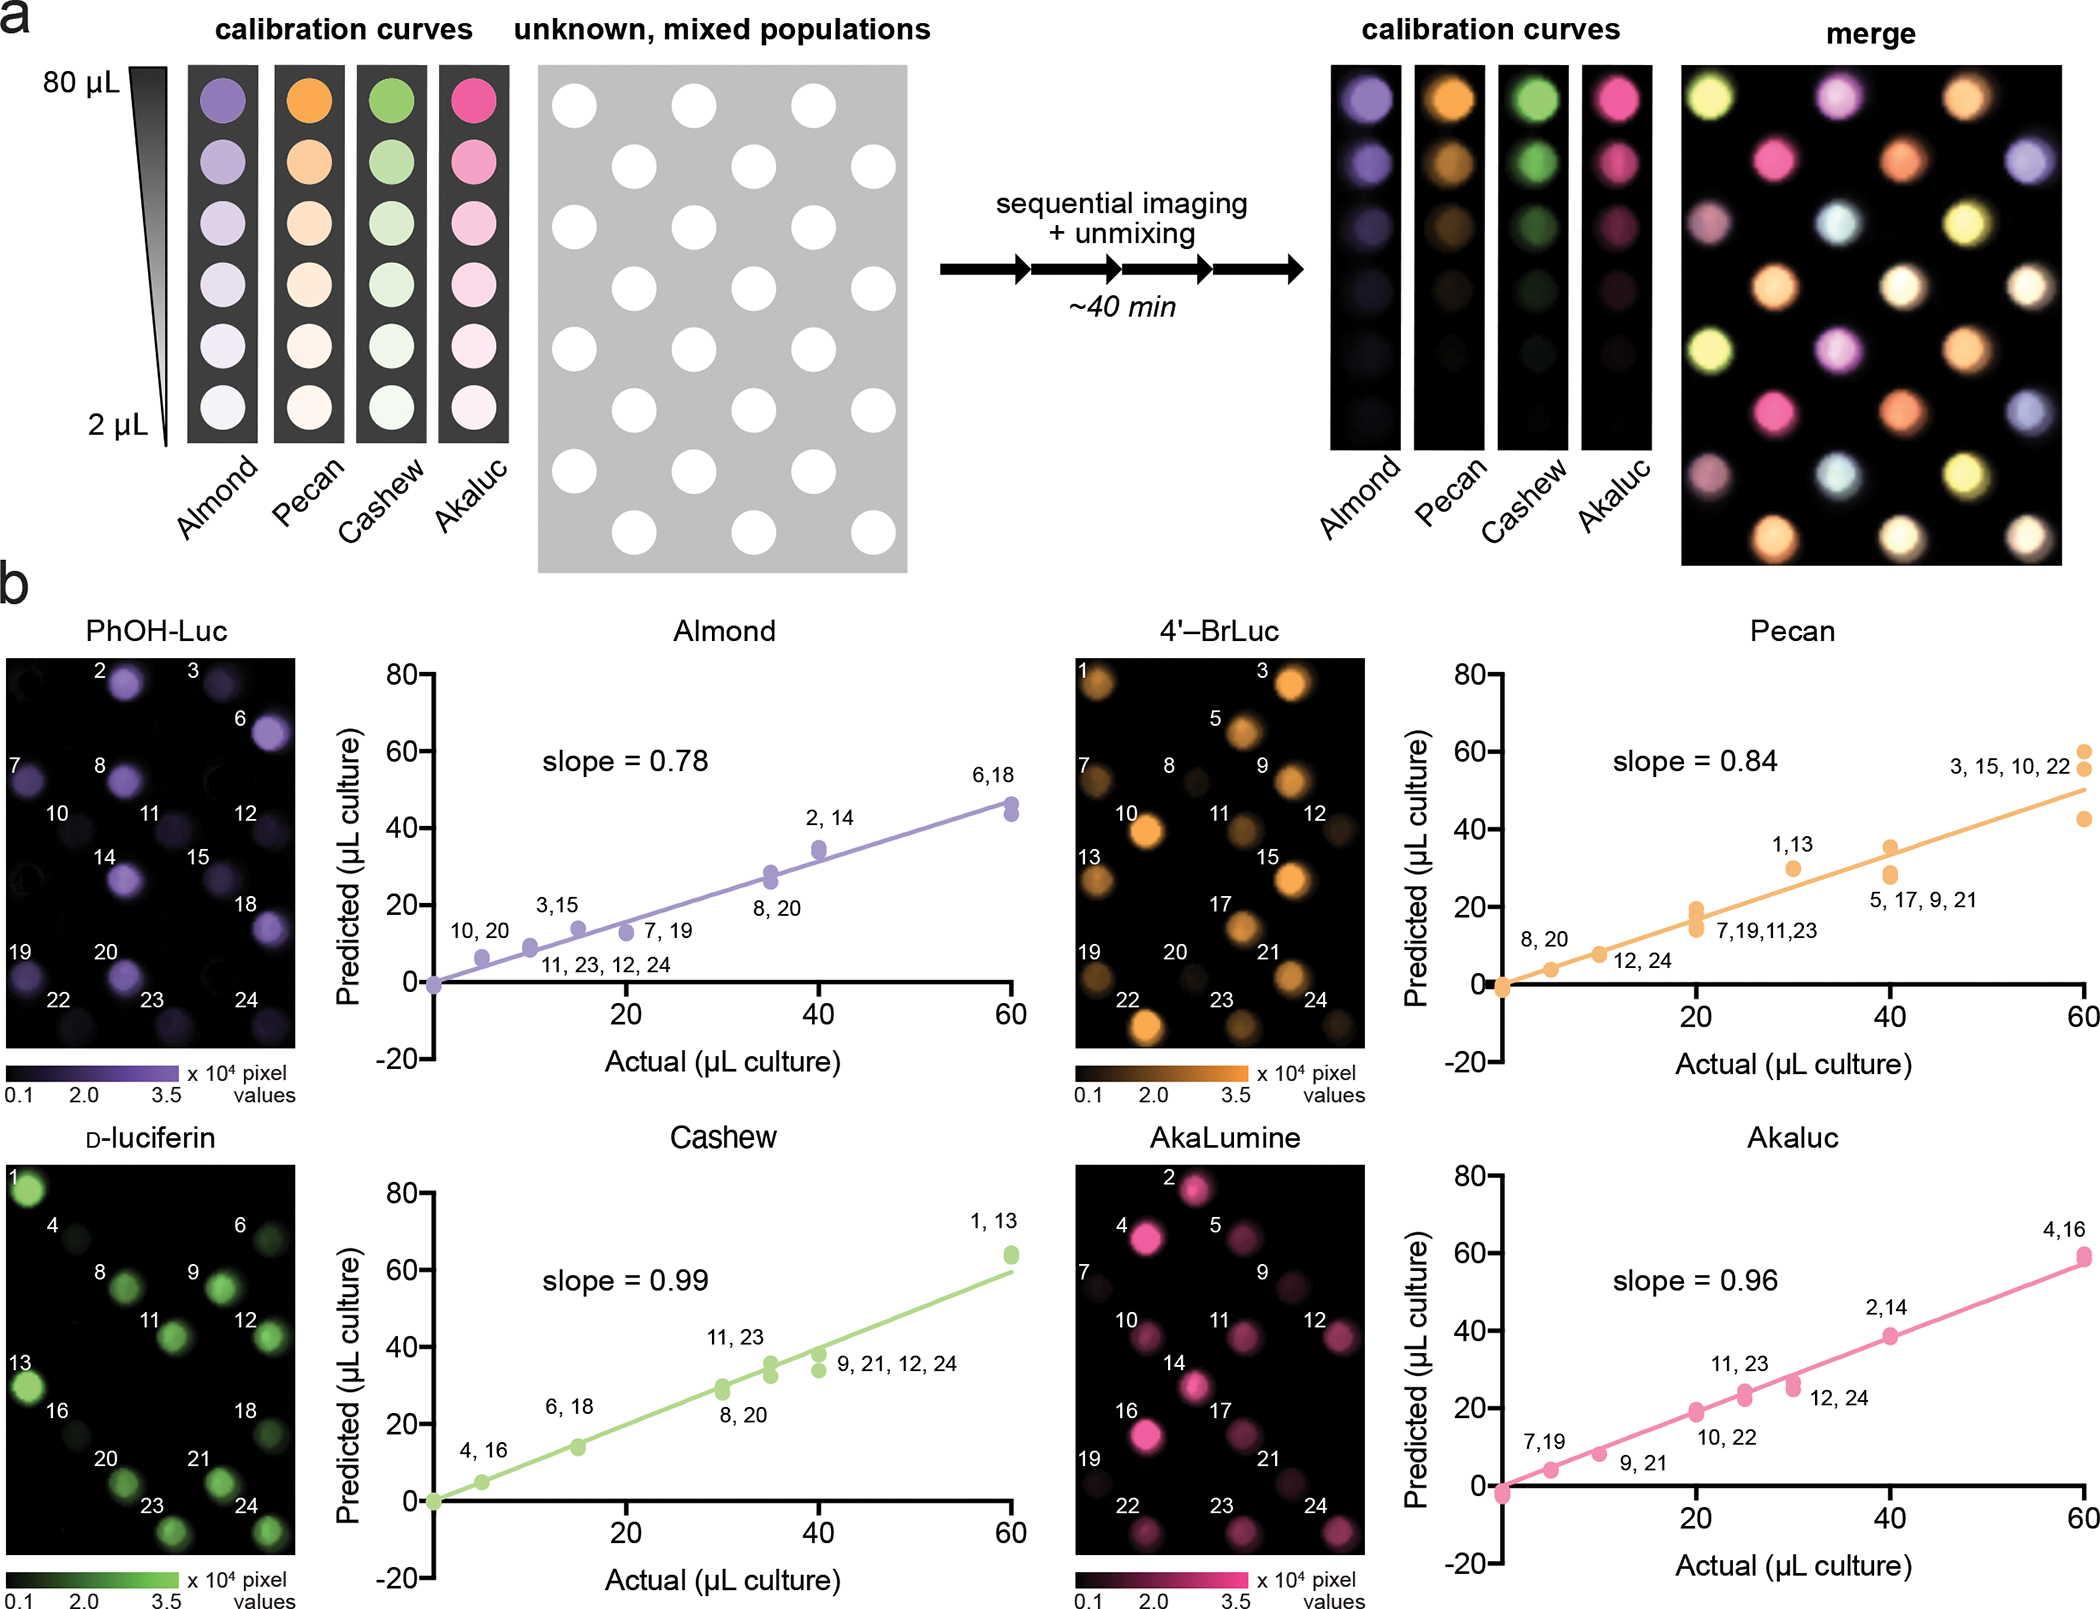
(a) Different amounts of Almond, Pecan, Cashew, and Akaluc were mixed, and distributed across a 96-well plate as shown. A total of twelve unique mixtures, comprising two, three, or four reporters, were analyzed. A calibration curve for each luciferase was also plated on the same plate. The samples were treated sequentially with PhOH-Luc (250 μM), 4′-BrLuc (100 μM), D-luc (100 μM), and AkaLumine (100 μM). Raw images were acquired after each substrate addition, unmixed, and overlaid. (b) From each unmixed channel, a standard curve was computed using unmixed signal from the calibration wells. The amount of luciferase in the unknown wells was computed, and plotted against the actual amount of reporter plated. Values indicate the well number of the mixed population.
Monitoring dynamic changes over time.
BLI is uniquely suited for longitudinal imaging, as fluctuations in photon intensity correlate with biological changes (e.g., cell growth or gene expression) (Aalipour et al., 2019; Matta et al., 2018). However, monitoring heterogeneous samples over time remains difficult with traditional protocols. Most multiplexed BLI applications require sequential administration of the complementary luciferins, with lengthy times required for substrate clearance between each administration. Imaging times can be dramatically improved via rapid substrate application in conjunction with SubstrateUnmixing. To showcase the utility of the multi-component workflow, we imaged a heterogeneous mixture of breast cancer cells. The cells derive from organ-specific metastases in the MMTV-PyMT mouse model, and serve as useful reagents for analyzing cancer growth in complex environments (Ionkina et al., 2021). Tumor cells from the mammary fat pad (MFP), lymph node (LN), and lung were engineered to express different luciferase-fluorescent protein fusions (MFP Pecan-eGFP, LN Cashew-mNeptune, and lung Akaluc-TagBFP). The cells were then plated as single populations or three-component mixtures. The samples were then monitored over time via sequential substrate administration and SubstrateUnmixing (Figure 7a). For all time points, the populations were successfully deconvoluted (Figure 7b). Changes in luminescence correlated with changes in fluorescence (as measured by flow cytometry) and cell counts (Figures 7c–d and Figures S11–S14). Interestingly, we observed that the lymph node derived cells grew more rapidly than cells derived from the primary tumor or lung. Differences in proliferation were also observed depending on whether the cells were grown in isolation or as mixtures.
Figure 7. Heterogeneous cell populations can be monitored over time with SubstrateUnmixing.
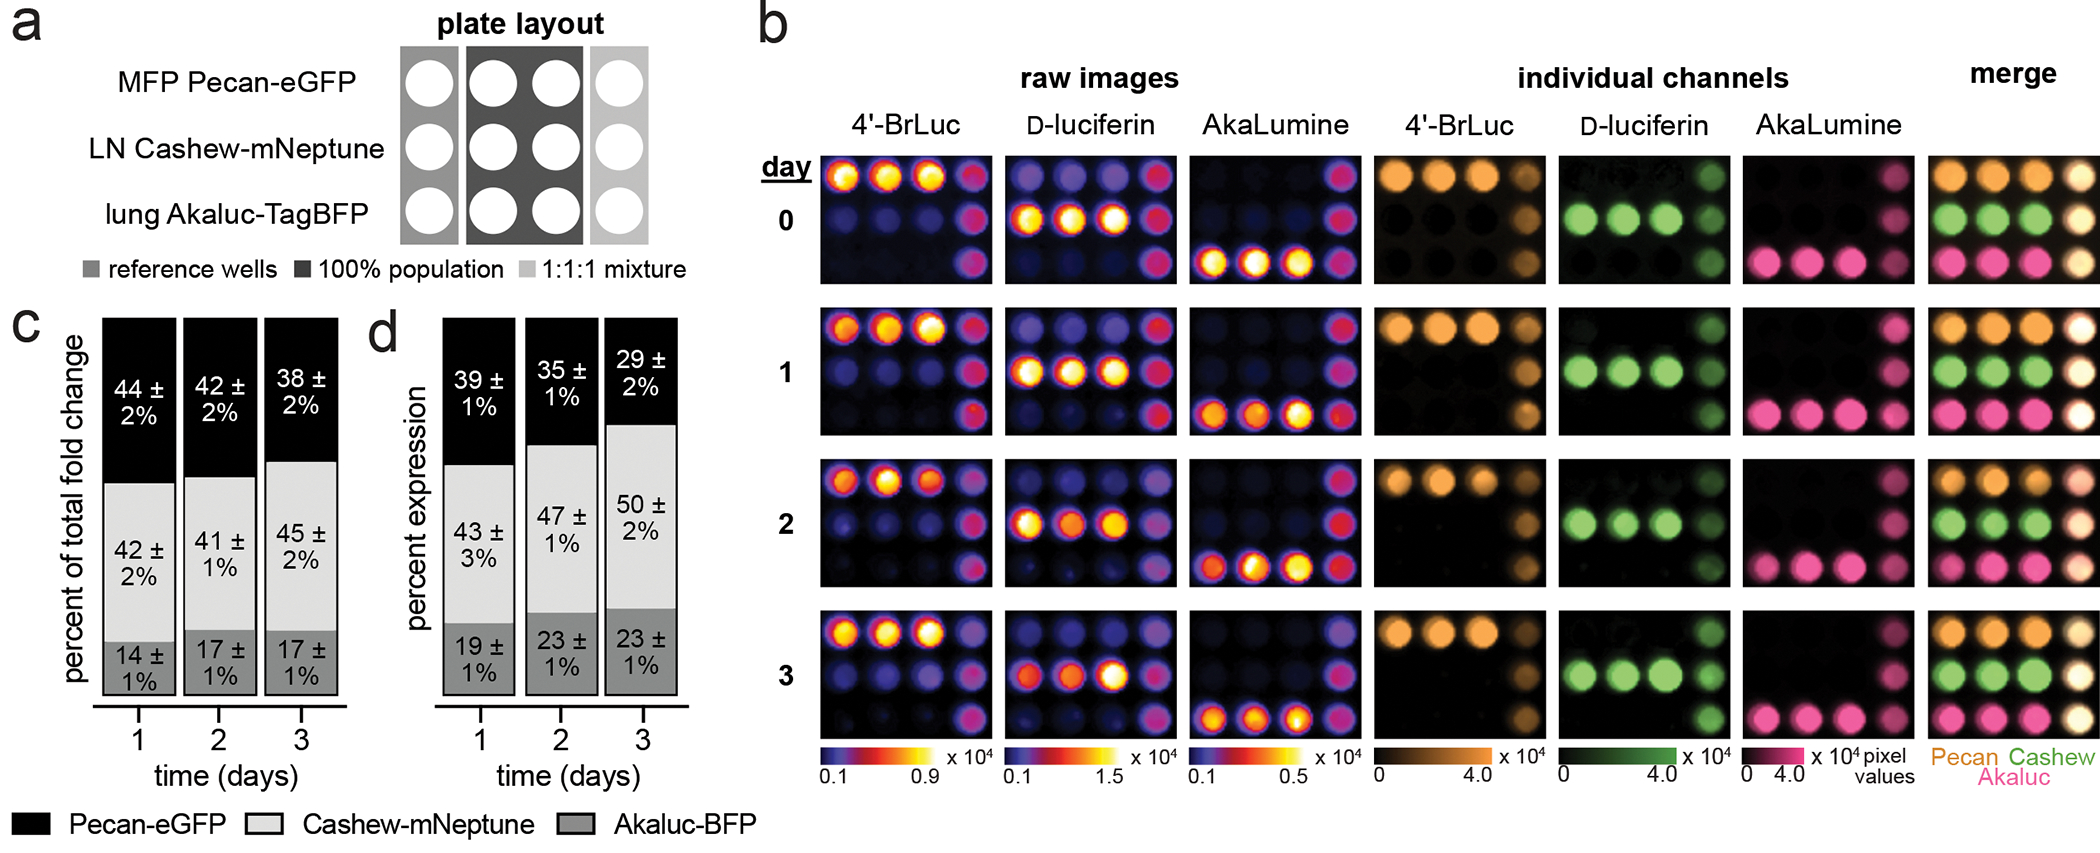
(a) MFP cells expressing Pecan-eGFP, LN cells expressing Cashew-mNeptune, and lung cells expressing Akaluc-BFP were plated as shown at the time of imaging. Cells were imaged on the day of seeding (day 0) and three subsequent days. (b) On each day the samples were treated with 4′-BrLuc (100 μM), D-luc (100 μM), and AkaLumine (100 μM) in succession. Raw images were acquired after each substrate addition and processed by SubstrateUnmixing. The substrate-specific signals were unmixed, assigned false colors, and overlaid. (c) Quantification of luminescence values (p/s) plotted as the fold change versus day 0 & normalized to expression of fluorescent reporter. (d) Quantification of 1:1:1 mixture by flow cytometry normalized to expression of the single population.
DISCUSSION
We developed a general platform for rapid, multiplexed imaging with bioluminescent probes. A MATLAB-based linear unmixing algorithm (SubstrateUnmixing) was written and used to deconvolute mixtures of luciferases in bacterial cells, mammalian cells, and mice. Probe differentiation relies on the unique emission barcodes generated from luciferin administration. The luciferins are simply added from dimmest to brightest, and the resulting patterns of emission provide a readout on the luciferases present. Using this approach, combinations of 3–5 luciferase reporters were readily distinguished in under one hour. SubstrateUnmixing is compatible with probes commonly used in the field (e.g., Akaluc/AkaLumine and NanoLuc/FRZ) and quantitative imaging is also possible. We further applied the imaging platform to monitoring changes in reporter ratios over time, including in a model of heterogeneous breast cancer.
The improved speed and multiplexing capabilities of SubstrateUnmixing will enable new BLI applications, including heterogeneous biological processes such as immune system activation, host-pathogen interactions, and cancer metastasis. In these experiments, multiple cell types or reporters can be monitored simultaneously in a single sample rather than over multiple days. Dynamic changes substrate ratios could also be easily deconvoluted, suggesting that the imaging platform can be integrated with studies where measuring luciferin levels is critical (e.g., caged probe release). Calibration curves can be readily integrated with SubstrateUnmixing, increasing the range of quantitative experiments that can be applied to the platform. In addition, we anticipate that additional engineered luciferase-luciferin pairs can be integrated with this approach, thus maximizing the number of reporters that can be imaged in tandem.
Future studies will address whether more generalized reference signals (and associated matrices for unmixing) can be developed and used broadly between experiments. Such studies will be especially important in the context of tissues and in vivo models, where reporter attenuation is likely to be more pronounced. Bioluminescent probes with longer emission wavelengths (e.g., Akaluc/AkaLumine) are less susceptible to these effects and are thus desirable for in vivo work. Several efforts are underway in our lab and others to generate additional red-emitting probes. We will also explore whether additional modifications to the algorithm (e.g., using pseudo-imaging algorithms) can expand the number of imaging targets or improve the accuracy of multi-substrate calibration (Seo et al., 2022). Such advances will further expand the scope of the SubstrateUnmixing platform.
LIMITATIONS OF THE STUDY
While multi-substrate BLI with SubstrateUnmixing provides many advantages over conventional imaging protocols, limitations remain. For example, monitoring changes in mixed populations without a calibration curve or fluorescent protein standard remains challenging. Pixel values in unmixed images are quantified relative to a reference population, so they cannot be directly compared to other channels. Additionally, the requirement for a reference can be limiting in certain applications, especially in vivo. The bioavailability of luciferins in desired imaging locales is also an important consideration for future multiplexed imaging applications. Differences in pharmacokinetics and biodistribution could influence the observed reactivity patterns in tissues and other environments. While SubstrateUnmixing should be able to deconvolute signals as long as the fingerprint remains distinct, the reference matrix will likely need to be empirically determined to account for differences in substrate accessibility.
SIGNIFICANCE
Bioluminescence imaging (BLI) is a powerful tool for sensitive detection of cellular changes over time in vitro and in vivo. However, traditional BLI workflows do not allow for simultaneous imaging of live cell populations containing three or more reporters. We developed a platform, SubstrateUnmixing, for multi-substrate imaging of heterogeneous cell mixtures. The approach is compatible with readily available BLI tools and can provide quantitative, rapid deconvolution of 3–5 reporters. The imaging strategy was used to monitor the dynamics of cell growth in a heterogenous model of breast cancer.
STAR METHODS
RESOURCE AVALIABILITY
Lead contact
Further information and requests for resources and reagents should be directed to and will be fulfilled by the lead contact, Jennifer A. Prescher (jpresche@uci.edu)
Materials availability
Materials generated in this study are available upon request. Depending on the reagent and institution of origin, an MTA might be required.
Data and code availability
All data reported in this paper will be shared by the lead contact upon request.
All original code has been deposited at https://github.com/ckbrenna/Substrate-Unmixing and is publicly available as of the date of publication. DOIs are listed in the key resources table.
Any additional information required to reanalyzed the data reported in this work is avaliable from the lead contact upon request.
KEY RESOURCE TABLE.
| REAGENT or RESOURCE | SOURCE | IDENTIFIER |
|---|---|---|
| Bacterial and virus strains | ||
| BL21(DE3) Competent E. coli | New England BioLabs | C2527I |
| Chemicals, peptides, and recombinant proteins | ||
| d-luciferin Firefly, potassium salt | Biosynth Carbosynth | Cat#L-8220 |
| (S)-2-(4-Bromo-6-hydroxybenzo[d]thiazol-2-yl)-4,5-dihydrothiazole-4-carboxylic acid (4’-BrLuc) | (Steinhardt et al., 2017) | N/A |
| AkaLumine-HCl (TokeOni) | Aobious | AOB9983 |
| (S)-2-(3-hydroxy-4-(6-hydroxybenzo[d]thiazol-2-yl)phenyl)-4,5-dihydrothiazole-4-carboxylic acid (PhOH-Luc) | (Yao et al., 2020) | N/A |
| Nano-Glo® Luciferase Assay System (furmazine) | Promega Corporation | Cat#N1120 |
| Dulbecco’s Modified Eagle’s Medium (DMEM) | Corning | Cat#10-017-CV |
| Fetal Bovine Serum | Gibco | Cat#10082147 |
| Penicillin-Streptomycin (10,000 U/mL) | Gibco | Cat#15140122 |
| Puromycin Dihydrochloride | Gibco | Cat#A1113802 |
| Trypsin-EDTA (0.05%), phenol red | Gibco | Cat#25300054 |
| Glycerol | Fisher Scientific | Cat#S25342A |
| Kanamycin Monosulfate | GoldBio | Cat#K-120-5 |
| LB Broth (Miller) | Genesee Scientific | Cat#11-121 |
| Isopropyl-beta-D-thiogalactoside | GoldBio | Cat#I2481C |
| Tris Base | Fisher Scientific | Cat#BP152-500 |
| NaCl | Fisher Scientific | Cat#S271-500 |
| Tween® 20 | Fisher Scientific | Cat#BP337-100 |
| MgCl•H2O | Fisher Scientific | Cat#M33-500 |
| Adenosine-5’-Triphosphate (ATP) | GoldBio | Cat#A-081-25 |
| Agarose | Fisher Scientific | Cat#BP160-500 |
| Trypan Blue Stain (0.4%) | Gibco | Cat#15250061 |
| Experimental models: Cell lines | ||
| MMTV-PyMT MFP | (Ionkina et al., 2021) | N/A |
| MMTV-PyMT LN | (Ionkina et al., 2021) | N/A |
| MMTV-PyMT Lung | (Ionkina et al., 2021) | N/A |
| MMTV-PyMT MFP Pecan-eGFP | This paper | N/A |
| MMTV-PyMT LN Cashew-mNeptune | This paper | N/A |
| MMTV-PyMT Lung Akaluc-BFP | This paper | N/A |
| DB7 Pecan-eGFP | (Rathbun et al., 2021) | N/A |
| DB7 Cashew-mNeptune | (Rathbun et al., 2021) | N/A |
| DB7 Akaluc-BFP | (Rathbun et al., 2021) | N/A |
| Recombinant DNA | ||
| pET28a Cashew | (Rathbun et al., 2017) | N/A |
| pET28a Pecan | (Rathbun et al., 2017) | N/A |
| pET28a Akaluc | (Yao et al., 2021a) | N/A |
| pET28a NanoLuc | (Yao et al., 2021a) | N/A |
| pET28a Almond | (Yao et al., 2021a) | N/A |
| AAVS1 Pecan-eFGP-T2A-Puro | (Rathbun et al., 2021) | N/A |
| AVVS1 Cashew-mNeptune-T2A-Puro | (Rathbun et al., 2021) | N/A |
| AAVS1 Akaluc-TagBFP-T2A-Puro | (Rathbun et al., 2021) | N/A |
| hCas9 (Addgene Plasmid #41815) | Gift from George Church | N/A |
| pSQT1313 (Addgene Plasmid #53370) | Gift from Keith Joung | N/A |
| Software and algorithms | ||
| Living Image Analysis Software | Perkin Elmer | N/A |
| ChemDraw v21.0.0 | Perkin Elmer | N/A |
| ImageJ (installed under the FIJI package) | NIH | N/A |
| NovoExpress Software | ACEA Biosciences | N/A |
| MATLAB R2019b | MathWorks | N/A |
| GraphPad Prism 9 | GraphPad Prism Software, Inc. | N/A |
| SubstrateUnmixing pipeline | This paper | DOI: 10.5281/zenodo.7072808 |
EXPERIMENTAL MODEL AND SUBJECT DETAILS
All data are generated from the datasets provided in the KRT.
Cell culture conditions
MMTV-PyMT primary cell lines (MFP, LN, and lung) were originally derived from 10–12-week female FVB/NJ MMTV-PyMT mice (courtesy of the Kessenbrock lab, UCI) as reported in previous work (Ionkina et al., 2021). Both CD44low/EpCAMhigh and CD44high/ EpCAMhigh cells were used for imaging. These cells or DB7 cells were engineered to express Pecan-eGFP, Cashew-mNeptune, or Akaluc-TagBFP via CRISPR-mediated gene insertion as previously described (Rathbun et al., 2021). All cells were cultured in DMEM (Corning) supplemented with 10% (v/v) fetal bovine serum (FBS, Life Technologies), penicillin (100 U/mL), and streptomycin (100 μg/mL). Cells expressing luciferases were further cultured with puromycin (2 μg/mL) to ensure gene integration. All cells were maintained in a 5% CO2 water-saturated incubator at 37 °C. Cells were serially passaged using trypsin-EDTA (0.25% in HBSS, Gibco). The cell lines were not authenticated prior to use.
METHOD DETAILS
Compound handling and preparation
All reagents purchased from commercial supplies were of analytical grade and used without further purification. 4’-BrLuc and PhOH-Luc were prepared and used as described previously (Steinhardt et al., 2017; Yao et al., 2020). All compounds were stored dry at −80 °C until needed and then dissolved in DMSO or phosphate buffer (100 mM buffer, pH 8). Stock solutions were prepared at concentrations that varied with compound apparent solubility (10 mM in phosphate buffer for D-luc, 4’-BrLuc; 50 mM in DMSO for PhOH-Luc and AkaLumine).
Synthesis of 4′Br-Luc
4′Br-Luc was synthesized as described in the literature from commercially available 4-isopropoxy aniline (Steinhardt et al., 2017). The desired luciferin was isolated via acidification with 1 M NaHSO4 and extraction with ethyl acetate, yielding a yellow solid. 1H NMR (500 MHz, D2O) δ 7.01 (m, 2H), 5.21 (m, 1H), 3.84 (m, 1H), 3.64 (m, 1H); 13C NMR (500 MHz, D2O) δ 180.4, 168.3, 169.8, 159.3, 146.7, 139.9, 123.3, 119.2, 109.0, 82.8, 39.3. In accordance with literature (Steinhardt et al., 2017).
Synthesis of PhOH-Luc
PhOH-Luc was synthesized as described in the literature from commercially available 6-methoxybenzo[d]thiazol-2-amine (Yao et al., 2020). The final compound was isolated from the reaction mixture following acidification with 1 M NaHSO4 and extraction with ethyl acetate. PhOH-Luc was isolated as an orange solid. 1H NMR (600 MHz, (CD3)2SO) δ 11.7 (s, 1H), 10.0 (s, 1H), 8.25 (d, J = 8.3 Hz 1H), 7.85 (d, J = 8.2 Hz, 1H), 7.53 (d, J = 8.8 Hz, 1H), 7.44 (d, J = 1.7 Hz, 1H), 7.40 (dd, J = 8.3, 1.7 Hz, 1H), 7.03 (dd, J = 8.8, 2.4 Hz, 1H), 5.33 (dd, J = 9.5, 8.3 Hz, 1H), 3.74 (dd, J = 11, 9.6 Hz, 1H), 3.64 (dd, J = 11, 8.2 Hz, 1H); 13C (150 MHz, (CD3)2SO) δ 172.2, 168.1, 160.3, 156.2, 155.9, 145.6, 137.0, 135.0, 129.0, 123.6, 122.3, 119.9, 116.8, 116.5, 106.7, 78.9, 35.3. In accordance with literature (Yao et al., 2020).
Bioluminescence imaging
All assays were performed in black 96-well plates (Grenier Bio One). Plates containing luminescent reagents were imaged in a light-proof chamber with an IVIS Lumina (Xenogen) CCD camera chilled to −90 °C. The stage was kept at 37 °C during the imaging session, and the camera was controlled using Living Image software. For all assays, exposure times were set to 1–180 s, and data binning levels were set to medium. Total flux values for regions of interest were analyzed using Living Image software. Integrated pixel values were analyzed using ImageJ (Installed under the FIJI package, NIH). The data were analyzed using GraphPad Prism (version 9.0 for Macintosh, GraphPad Software).
SubstrateUnmixing analysis
Substrate unmixing experiments were designed as previously described (Rathbun et al., 2021). Substrate unmixing was conducted with MATLAB R2020a (See Supplementary Discussion). Luminescence images containing the raw CCD counts (as TIFF files) were loaded into MATLAB. Images were subjected to a 2-pixel median filter (using the medfilt2 function with a 5×5 neighborhood around the corresponding pixel). Next, the signal at each pixel was normalized to lie between 0 and 65536 (the maximum value that can be stored in a 16-bit image). As a result, the brightest pixel in each image had a value of 65536, and the dimmest had a value of 0. Regions of interest (ROIs) were generated by identifying the image coordinate of the reference well and input dimensions. Once assigned, the MATLAB algorithm was run to perform the unmixing. After unmixing, text images were imported into ImageJ (installed under the FIJI package). Integrated pixel values for regions of interest were analyzed using the “Measure” tool. Pseudocolors were assigned with the “Merge Channels” tool. In some cases, Bland-Altman plots were used to evaluate deviations in measurements obtained from unmixed images versus control samples. The averages of the deviations were shown as biases, and the standard deviations were indicated as 95% limits of agreements. All analyzes were performed using GraphPad Prism 9.
Bacterial cell analysis of luciferase mutants
E. coli BL21 cells expressing mutant luciferases (glycerol stocks, 50% v/v) were streaked on agar plates containing kanamycin sulfate (Kan, 40 μg/mL final concentration, Fisher Scientific). After overnight growth, colonies were picked and incubated in LB media (Genesee Scientific) supplemented with Kan (LB-Kan) at 37 °C with shaking (250 rpm) for 16–18 h. Aliquots of the starter cultures (100–200 μL) were used to inoculate 5 mL of LB-Kan media and grown to OD600 = 0.8–0.9. Protein expression was induced with 1 M isopropyl β-D-1-thiogalactopyranoside (IPTG, 2.5 μL, 500 μM final concentration, Gold Biotechnology), and the cultures were grown for 18 h with shaking (250 rpm). The cells were pelleted at 4000 rpm for 5 min, and then resuspended in 600 μL buffer (50 mM Tris-HCl, 500 mM NaCl, 0.5% (v/v) Tween® 20, 5 mM MgCl2, pH 7.4). Unless otherwise noted, samples were diluted prior to plating to remain in the linear range of detection (1:10 for Cashew, Pecan, Akaluc and Almond, 1:100 for NanoLuc). Cell lysate (90 μL) was added to black 96-well plates, followed by luciferin solution (10 μL, 100 μM for D-luc, 4ʹ-BrLuc, and AkaLumine, 250 μM for PhOH-Luc with 1 mM ATP final concentration, 1:100 dilution for furimazine (Promega Corporation)). Plates were imaged and analyzed as described above.
Analysis of luciferase mutants in a tissue mimic
E. coli BL21 cells expressing Cashew, Pecan, or Akaluc were induced for protein expression as described above. After pelleting, the cells were resuspended in 2.5 mL buffer (50 mM Tris-HCl, 500 mM NaCl, 0.5% (v/v) Tween® 20, 5 mM MgCl2, pH 7.4). Calibration curves and mixtures were prepared in resuspension buffer and 50 μL of each suspension was mixed with 50 μL of agarose (1% w/v in H2O). The mixtures were plated across black 96-well plates and allowed to solidify. Buffer (90 μL) was added, followed by luciferin solution (10 μL, 100 μM with 1 mM ATP final concentration), Plates were imaged and analyzed as described above.
Mammalian cell analysis of luciferase mutants
DB7 or MMTV-PyMT cells stably expressing luciferases were added to black 96-well plates. Cells were treated with a luciferin solution (10 μL, 100 μM for D-luc, 4ʹ-BrLuc, and AkaLumine). Plates were imaged and analyzed as described above.
Flow cytometry methods
Samples were transferred to Eppendorf tubes and pelleted (500 × g, 5 min) using a tabletop centrifuge (Thermo Fisher Sorvall Legend Micro 17). The resulting supernatants were discarded, and cells were washed with PBS (2 × 100 μL). Cells were then analyzed on a Novocyte Quanteon flow cytometer (ACEA Biosciences Inc). Live cells were gated and TagBFP+, eGFP+, and mNeptune+ cells were further gated. For each sample, 10,000 events were collected on the “Live cell” gate (see Figure S10 for raw plots). TagBFP, eGFP, and mNeptune fluorescence were analyzed and quantified using NovoExpress software (ACEA Biosciences Inc.).
Longitudinal imaging of luciferase-expressing cells
MMTV-PyMT cells derived from either the mammary fat pad (MFP), lymph node (LN), or lung expressing Pecan-eGFP, Cashew-mNeptune, or Akaluc-TagBFP, respectively, or a mixture of the three cell lines were seeded in triplicate in tissue culture treated 24-well plates (Corning, 5 × 10⁴ cells per well). On day of seeding, cells were added to 96-well plates (100 μL, 2.5 × 10⁴ cells per well). On each subsequent day, cells were lifted with trypsin (100 μL) with DMEM (Corning, 100 μL) supplemented with 10% (v/v) fetal bovine serum (FBS, Life Technologies), penicillin (100 U/mL), and streptomycin (100 μg/mL). A portion of the cells (100 μL) were analyzed via flow cytometry as described above. The remaining cells (100 μL) were added to 96-well plates. On each day including the day of seeding, a portion of the cells (10 μL) were counted using Trypan Blue (10 μL, 0.4%, Gibco) and Countess II FL Automated Cell Counter (Fisher Scientific). The remaining cells (90 μL) were imaged and analyzed as described above.
QUANTIFICATION AND STATISICAL ANALYSIS
Unless indicated otherwise, experiments were performed with at least 3 independent replicates (n) and analyzed using Graphpad Prism (V. 9.2.1 or 7). Values are expressed as mean ± standard deviation of the mean or SEM of the replicates, as indicated in the figure legends.
Supplementary Material
Highlights.
Multiplexed bioluminescence imaging is possible with streamlined algorithm
SubstrateUnmixing provides rapid readouts on mixture composition
Mixtures of luciferase reporters can be readily quantified
SubstrateUnmixing enables serial tracking of heterogenous cell populations
ACKNOWLEDGEMENTS
This work was supported by the U.S. National Institutes of Health (R01 GM107630 to J.A.P.). C.K.B was supported by the UCI Physical Sciences Machine Learning NEXUS program. Z.Y. was supported by the National Science Foundation via the BEST IGERT (DGE-1144901) program. Z.Y. and C.M.R. were supported by National Science Foundation Graduate Research Fellowships (DGE-1321846). A.I. was supported by the U.S. National Institutes of Health institutional Cancer Biology Training Grant (T32-CA009054). B.S. was supported by the UCI Undergraduate Research Opportunities Program. We thank M. Shapiro (Caltech) for help with writing the unmixing algorithm. We also thank members of the Prescher Lab for helpful discussions.
Footnotes
DECLARATION OF INTERESTS
J.A.P. is a member of the Editorial Advisory Board for Cell Chemical Biology.
Publisher's Disclaimer: This is a PDF file of an unedited manuscript that has been accepted for publication. As a service to our customers we are providing this early version of the manuscript. The manuscript will undergo copyediting, typesetting, and review of the resulting proof before it is published in its final form. Please note that during the production process errors may be discovered which could affect the content, and all legal disclaimers that apply to the journal pertain.
REFERENCES
- Aalipour A, Chuang HY, Murty S, D’Souza AL, Park SM, Gulati GS, Patel CB, Beinat C, Simonetta F, Martinić I, et al. (2019). Engineered immune cells as highly sensitive cancer diagnostics. Nat. Biotechnol. 37, 531–539. [DOI] [PMC free article] [PubMed] [Google Scholar]
- Aswendt M, Vogel S, Schäfer C, Jathoul A, Pule M, and Hoehn M (2019). Quantitative in vivo dual-color bioluminescence imaging in the mouse brain. Neurophotonics 6, 025006. [DOI] [PMC free article] [PubMed] [Google Scholar]
- Berezin MY, and Achilefu S (2010). Fluorescence Lifetime Measurements and Biological Imaging. Chem. Rev. 110, 2641–2684. [DOI] [PMC free article] [PubMed] [Google Scholar]
- Chaincy K, Olivier C, Tamara LT, Heng X, and Bradley WR (2007). Three-dimensional reconstruction of in vivo bioluminescent sources based on multispectral imaging. J. Biomed. Opt. 12, 1–12. [DOI] [PubMed] [Google Scholar]
- Chu J, Oh Y, Sens A, Ataie N, Dana H, Macklin JJ, Laviv T, Welf ES, Dean KM, Zhang F, et al. (2016). A bright cyan-excitable orange fluorescent protein facilitates dual-emission microscopy and enhances bioluminescence imaging in vivo. Nat. Biotechnol. 34, 760–767. [DOI] [PMC free article] [PubMed] [Google Scholar]
- Contag CH, and Bachmann MH (2002). Advances in In Vivo Bioluminescence Imaging of Gene Expression. Ann. Rev. Biomed. Eng. 4, 235–260. [DOI] [PubMed] [Google Scholar]
- Dale NC, Johnstone EKM, White CW, and Pfleger KDG (2019). NanoBRET: The Bright Future of Proximity-Based Assays. Front. Bioeng. Biotechnol. 7, 56. [DOI] [PMC free article] [PubMed] [Google Scholar]
- Datta R, Heaster TM, Sharick JT, Gillette AA, and Skala MC (2020). Fluorescence lifetime imaging microscopy: fundamentals and advances in instrumentation, analysis, and applications. Journal of biomedical optics 25, 1–43. [DOI] [PMC free article] [PubMed] [Google Scholar]
- Dixon AS, Schwinn MK, Hall MP, Zimmerman K, Otto P, Lubben TH, Butler BL, Binkowski BF, Machleidt T, Kirkland TA, et al. (2016). NanoLuc Complementation Reporter Optimized for Accurate Measurement of Protein Interactions in Cells. ACS Chem. Biol. 11, 400–408. [DOI] [PubMed] [Google Scholar]
- Doyle TC, Burns SM, and Contag CH (2004). Technoreview: In vivo bioluminescence imaging for integrated studies of infection. Cellular Microbiology 6, 303–317. [DOI] [PubMed] [Google Scholar]
- Elledge SK, Zhou XX, Byrnes JR, Martinko AJ, Lui I, Pance K, Lim SA, Glasgow JE, Glasgow AA, Turcios K, et al. (2021). Engineering luminescent biosensors for point-of-care SARS-CoV-2 antibody detection. Nat. Biotechnol. 39, 928–935. [DOI] [PMC free article] [PubMed] [Google Scholar]
- Eng C-HL, Lawson M, Zhu Q, Dries R, Koulena N, Takei Y, Yun J, Cronin C, Karp C, Yuan G-C, et al. (2019). Transcriptome-scale super-resolved imaging in tissues by RNA seqFISH+. Nature 568, 235–239. [DOI] [PMC free article] [PubMed] [Google Scholar]
- Fan F, and Wood KV (2007). Bioluminescent assays for high-throughput screening. ASSAY and Drug Development Technologies 5, 127–136. [DOI] [PubMed] [Google Scholar]
- Farhadi A, Ho GH, Sawyer DP, Bourdeau RW, and Shapiro MG (2019). Ultrasound imaging of gene expression in mammalian cells. Science 365, 1469. [DOI] [PMC free article] [PubMed] [Google Scholar]
- Gammon ST, Leevy WM, Gross S, Gokel GW, and Piwnica-Worms D (2006). Spectral unmixing of multicolored bioluminescence emitted from heterogeneous biological sources. Anal. Chem. 78, 1520–1527. [DOI] [PMC free article] [PubMed] [Google Scholar]
- Griss R, Schena A, Reymond L, Patiny L, Werner D, Tinberg CE, Baker D, and Johnsson K (2014). Bioluminescent sensor proteins for point-of-care therapeutic drug monitoring. Nat. Chem. Biol. 10, 598–603. [DOI] [PubMed] [Google Scholar]
- Gross S, Abraham U, Prior JL, Herzog ED, and Piwnica-Worms D (2007). Continuous delivery of D-luciferin by implanted micro-osmotic pumps enables true real-time bioluminescence imaging of luciferase activity in vivo. Mol. Imaging 6, 121–130. [PubMed] [Google Scholar]
- Guo S-M, Veneziano R, Gordonov S, Li L, Danielson E, de Arce KP, Park D, Kulesa AB, Wamhoff E-C, Blainey PC, et al. (2019). Multiplexed and high-throughput neuronal fluorescence imaging with diffusible probes. Nat. Commun. 10, 4377. [DOI] [PMC free article] [PubMed] [Google Scholar]
- Hall MP, Unch J, Binkowski BF, Valley MP, Butler BL, Wood MG, Otto P, Zimmerman K, Vidugiris G, Machleidt T, et al. (2012). Engineered luciferase reporter from a deep sea shrimp utilizing a novel imidazopyrazinone substrate. ACS Chem. Biol. 7, 1848–1857. [DOI] [PMC free article] [PubMed] [Google Scholar]
- Ionkina AA, Balderrama-Gutierrez G, Ibanez KJ, Phan SHD, Cortez AN, Mortazavi A, and Prescher JA (2021). Transcriptome analysis of heterogeneity in mouse model of metastatic breast cancer. Breast Cancer Res. 23, 93. [DOI] [PMC free article] [PubMed] [Google Scholar]
- Iwano S, Obata R, Miura C, Kiyama M, Hama K, Nakamura M, Amano Y, Kojima S, Hirano T, Maki S, et al. (2013). Development of simple firefly luciferin analogs emitting blue, green, red, and near-infrared biological window light. Tetrahedron 69, 3847–3856. [Google Scholar]
- Iwano S, Sugiyama M, Hama H, Watakabe A, Hasegawa N, Kuchimaru T, Tanaka KZ, Takahashi M, Ishida Y, Hata J, et al. (2018). Single-cell bioluminescence imaging of deep tissue in freely moving animals. Science 359, 935–939. [DOI] [PubMed] [Google Scholar]
- Jones KA, Porterfield WB, Rathbun CM, McCutcheon DC, Paley MA, and Prescher JA (2017). Orthogonal luciferase–luciferin pairs for bioluminescence imaging. J. Am. Chem. Soc. 139, 2351–2358. [DOI] [PMC free article] [PubMed] [Google Scholar]
- Kitada N, Saitoh T, Ikeda Y, Iwano S, Obata R, Niwa H, Hirano T, Miyawaki A, Suzuki K, Nishiyama S, et al. (2018). Toward bioluminescence in the near-infrared region: Tuning the emission wavelength of firefly luciferin analogues by allyl substitution. Tet. Lett. 59, 1087–1090. [Google Scholar]
- Kleinovink JW, Mezzanotte L, Zambito G, Fransen MF, Cruz LJ, Verbeek JS, Chan A, Ossendorp F, and Löwik C (2019). A Dual-Color Bioluminescence Reporter Mouse for Simultaneous in vivo Imaging of T Cell Localization and Function. Front. Immunol. 9, 3097. [DOI] [PMC free article] [PubMed] [Google Scholar]
- Kobayashi H, Picard L-P, Schönegge A-M, and Bouvier M (2019). Bioluminescence resonance energy transfer–based imaging of protein–protein interactions in living cells. Nat. Protoc. 14, 1084–1107. [DOI] [PubMed] [Google Scholar]
- Kuchimaru T, Iwano S, Kiyama M, Mitsumata S, Kadonosono T, Niwa H, Maki S, and Kizaka-Kondoh S (2016). A luciferin analogue generating near-infrared bioluminescence achieves highly sensitive deep-tissue imaging. Nat. Commun. 7, 11856. [DOI] [PMC free article] [PubMed] [Google Scholar]
- Liu H, Patel MR, Prescher JA, Patsialou A, Qian D, Lin J, Wen S, Chang Y-F, Bachmann MH, Shimono Y, et al. (2010). Cancer stem cells from human breast tumors are involved in spontaneous metastases in orthotopic mouse models. Proc. Natl. Acad. Sci. U.S.A. 107, 18115–18120. [DOI] [PMC free article] [PubMed] [Google Scholar]
- Love AC, and Prescher JA (2020). Seeing (and Using) the Light: Recent Developments in Bioluminescence Technology. Cell Chem. Biol. 27, 904–920. [DOI] [PMC free article] [PubMed] [Google Scholar]
- Machleidt T, Woodroofe CC, Schwinn MK, Méndez J, Robers MB, Zimmerman K, Otto P, Daniels DL, Kirkland TA, and Wood KV (2015). NanoBRET—A Novel BRET Platform for the Analysis of Protein–Protein Interactions. ACS Chem. Biol. 10, 1797–1804. [DOI] [PubMed] [Google Scholar]
- Maguire CA, Bovenberg MS, Crommentuijn MH, Niers JM, Kerami M, Teng J, Sena-Esteves M, Badr CE, and Tannous BA (2013). Triple bioluminescence imaging for in vivo monitoring of cellular processes. Mol. Ther. Nucleic Acids 2, e99. [DOI] [PMC free article] [PubMed] [Google Scholar]
- Matta H, Gopalakrishnan R, Choi S, Prakash R, Natarajan V, Prins R, Gong S, Chitnis SD, Kahn M, Han X, et al. (2018). Development and characterization of a novel luciferase based cytotoxicity assay. Sci. Rep. 8, 199. [DOI] [PMC free article] [PubMed] [Google Scholar]
- Moroz MA, Zurita J, Moroz A, Nikolov E, Likar Y, Dobrenkov K, Lee J, Shenker L, Blasberg R, Serganova I, et al. (2021). Introducing a new reporter gene, membrane-anchored Cypridina luciferase, for multiplex bioluminescence imaging. Molecular Therapy - Oncolytics 21, 15–22. [DOI] [PMC free article] [PubMed] [Google Scholar]
- Paley MA, and Prescher JA (2014). Bioluminescence: a versatile technique for imaging cellular and molecular features. MedChemComm 5, 255–267. [DOI] [PMC free article] [PubMed] [Google Scholar]
- Quijano-Rubio A, Yeh H-W, Park J, Lee H, Langan RA, Boyken SE, Lajoie MJ, Cao L, Chow CM, Miranda MC, et al. (2021). De novo design of modular and tunable protein biosensors. Nature 591, 482–487. [DOI] [PMC free article] [PubMed] [Google Scholar]
- Rabinovich BA, Ye Y, Etto T, Chen JQ, Levitsky HI, Overwijk WW, Cooper LJN, Gelovani J, and Hwu P (2008). Visualizing fewer than 10 mouse T cells with an enhanced firefly luciferase in immunocompetent mouse models of cancer. Proc. Natl. Acad. Sci. 105, 14342–14346. [DOI] [PMC free article] [PubMed] [Google Scholar]
- Rathbun CM, Ionkina AA, Yao Z, Jones KA, Porterfield WB, and Prescher JA (2021). Rapid Multicomponent Bioluminescence Imaging via Substrate Unmixing. ACS Chemical Biology, 682–690. [DOI] [PMC free article] [PubMed] [Google Scholar]
- Rathbun CM, Porterfield WB, Jones KA, Sagoe MJ, Reyes MR, Hua CT, and Prescher JA (2017). Parallel Screening for Rapid Identification of Orthogonal Bioluminescent Tools. ACS Cent. Sci. 3, 1254–1261. [DOI] [PMC free article] [PubMed] [Google Scholar]
- Rathbun CM, and Prescher JA (2017). Bioluminescent probes for imaging biology beyond the culture dish. Biochemistry 56, 5178–5184. [DOI] [PMC free article] [PubMed] [Google Scholar]
- Sanford L, and Palmer A (2017). Chapter One - Recent Advances in Development of Genetically Encoded Fluorescent Sensors. In Methods in Enzymology, Thompson RB, and Fierke CA, eds. (Academic Press; ), pp. 1–49. [DOI] [PubMed] [Google Scholar]
- Sarrion-Perdigones A, Chang L, Gonzalez Y, Gallego-Flores T, Young DW, and Venken KJT (2019). Examining multiple cellular pathways at once using multiplex hextuple luciferase assaying. Nat. Commun. 10, 5710. [DOI] [PMC free article] [PubMed] [Google Scholar]
- Seo J, Sim Y, Kim J, Kim H, Cho I, Nam H, Yoon Y-G, and Chang J-B (2022). PICASSO allows ultra-multiplexed fluorescence imaging of spatially overlapping proteins without reference spectra measurements. Nat. Commun. 13, 2475. [DOI] [PMC free article] [PubMed] [Google Scholar]
- Sim H, Bibee K, Wickline S, and Sept D (2011). Pharmacokinetic modeling of tumor bioluminescence implicates efflux, and not influx, as the bigger hurdle in cancer drug therapy. Cancer Res. 71, 686–692. [DOI] [PMC free article] [PubMed] [Google Scholar]
- Stacer AC, Nyati S, Moudgil P, Iyengar R, Luker KE, Rehemtulla A, and Luker GD (2013). NanoLuc Reporter for Dual Luciferase Imaging in Living Animals. Mol. Imaging 12, 457–469. [PMC free article] [PubMed] [Google Scholar]
- Steinhardt RC, Rathbun CM, Krull BT, Yu JM, Yang Y, Nguyen BD, Kwon J, McCutcheon DC, Jones KA, Furche F, et al. (2017). Brominated Luciferins Are Versatile Bioluminescent Probes. ChemBioChem 18, 96–100. [DOI] [PMC free article] [PubMed] [Google Scholar]
- Stowe CL, Burley TA, Allan H, Vinci M, Kramer-Marek G, Ciobota DM, Parkinson GN, Southworth TL, Agliardi G, Hotblack A, et al. (2019). Near-infrared dual bioluminescence imaging in mouse models of cancer using infraluciferin. eLife 8, e45801. [DOI] [PMC free article] [PubMed] [Google Scholar]
- Su Y, Walker JR, Park Y, Smith TP, Liu LX, Hall MP, Labanieh L, Hurst R, Wang DC, Encell LP, et al. (2020). Novel NanoLuc substrates enable bright two-population bioluminescence imaging in animals. Nat. Methods 17, 852–860. [DOI] [PMC free article] [PubMed] [Google Scholar]
- Syed AJ, and Anderson JC (2021). Applications of bioluminescence in biotechnology and beyond. Chem. Soc. Rev. 50, 5668–5705. [DOI] [PubMed] [Google Scholar]
- Thorne N, Inglese J, and Auld DS (2010). Illuminating insights into firefly luciferase and other bioluminescent reporters used in chemical biology. Chem. Biol. 17, 646–657. [DOI] [PMC free article] [PubMed] [Google Scholar]
- Thorne N, Shen M, Lea Wendy A., Simeonov A, Lovell S, Auld Douglas S., and Inglese J (2012). Firefly Luciferase in Chemical Biology: A Compendium of Inhibitors, Mechanistic Evaluation of Chemotypes, and Suggested Use As a Reporter. Chem. Biol. 19, 1060–1072. [DOI] [PMC free article] [PubMed] [Google Scholar]
- Williams SJ, and Prescher JA (2019). Building biological flashlights: Orthogonal luciferases and luciferins for in vivo imaging. Acc. Chem. Res. 52, 3039–3050. [DOI] [PMC free article] [PubMed] [Google Scholar]
- Yao Z, Brennan CK, Scipioni L, Chen H, Ng K, Digman MA, and Prescher JA (2021a). Multiplexed bioluminescence microscopy via phasor analysis. bioRxiv, 2021.2006.2018.448905. [DOI] [PMC free article] [PubMed] [Google Scholar]
- Yao Z, Caldwell DR, Love AC, Kolbaba-Kartchner B, Mills JH, Schnermann MJ, and Prescher JA (2021b). Coumarin luciferins and mutant luciferases for robust multi-component bioluminescence imaging. Chem. Sci. 12, 11684–11691. [DOI] [PMC free article] [PubMed] [Google Scholar]
- Yao Z, Zhang BS, and Prescher JA (2018). Advances in bioluminescence imaging: new probes from old recipes. Curr. Opin. Chem. Biol. 45, 148–156. [DOI] [PMC free article] [PubMed] [Google Scholar]
- Yao Z, Zhang BS, Steinhardt RC, Mills JH, and Prescher JA (2020). Multicomponent Bioluminescence Imaging with a π-Extended Luciferin. J. Am. Chem. Soc. 142, 14080–14089. [DOI] [PMC free article] [PubMed] [Google Scholar]
- Yeh H-W, and Ai H-W (2019). Development and Applications of Bioluminescent and Chemiluminescent Reporters and Biosensors. Annu. Rev. Anal. Chem. 12, 129–150. [DOI] [PMC free article] [PubMed] [Google Scholar]
- Yeh H-W, Karmach O, Ji A, Carter D, Martins-Green MM, and Ai H. w. (2017). Red-shifted luciferase–luciferin pairs for enhanced bioluminescence imaging. Nat. Methods 14, 971–974. [DOI] [PMC free article] [PubMed] [Google Scholar]
- Yeh H. w., Xiong Y, Wu T, Chen M, Ji A, Li X, and Ai H-W (2019). ATP-Independent Bioluminescent Reporter Variants To Improve in Vivo Imaging. ACS Chem. Biol. 14, 959–965. [DOI] [PMC free article] [PubMed] [Google Scholar]
- Zambito G, Hall MP, Wood MG, Gaspar N, Ridwan Y, Stellari FF, Shi C, Kirkland TA, Encell LP, Löwik C, et al. (2021). Red-shifted click beetle luciferase mutant expands the multicolor bioluminescent palette for deep tissue imaging. iScience 24, 101986. [DOI] [PMC free article] [PubMed] [Google Scholar]
Associated Data
This section collects any data citations, data availability statements, or supplementary materials included in this article.
Supplementary Materials
Data Availability Statement
All data reported in this paper will be shared by the lead contact upon request.
All original code has been deposited at https://github.com/ckbrenna/Substrate-Unmixing and is publicly available as of the date of publication. DOIs are listed in the key resources table.
Any additional information required to reanalyzed the data reported in this work is avaliable from the lead contact upon request.
KEY RESOURCE TABLE.
| REAGENT or RESOURCE | SOURCE | IDENTIFIER |
|---|---|---|
| Bacterial and virus strains | ||
| BL21(DE3) Competent E. coli | New England BioLabs | C2527I |
| Chemicals, peptides, and recombinant proteins | ||
| d-luciferin Firefly, potassium salt | Biosynth Carbosynth | Cat#L-8220 |
| (S)-2-(4-Bromo-6-hydroxybenzo[d]thiazol-2-yl)-4,5-dihydrothiazole-4-carboxylic acid (4’-BrLuc) | (Steinhardt et al., 2017) | N/A |
| AkaLumine-HCl (TokeOni) | Aobious | AOB9983 |
| (S)-2-(3-hydroxy-4-(6-hydroxybenzo[d]thiazol-2-yl)phenyl)-4,5-dihydrothiazole-4-carboxylic acid (PhOH-Luc) | (Yao et al., 2020) | N/A |
| Nano-Glo® Luciferase Assay System (furmazine) | Promega Corporation | Cat#N1120 |
| Dulbecco’s Modified Eagle’s Medium (DMEM) | Corning | Cat#10-017-CV |
| Fetal Bovine Serum | Gibco | Cat#10082147 |
| Penicillin-Streptomycin (10,000 U/mL) | Gibco | Cat#15140122 |
| Puromycin Dihydrochloride | Gibco | Cat#A1113802 |
| Trypsin-EDTA (0.05%), phenol red | Gibco | Cat#25300054 |
| Glycerol | Fisher Scientific | Cat#S25342A |
| Kanamycin Monosulfate | GoldBio | Cat#K-120-5 |
| LB Broth (Miller) | Genesee Scientific | Cat#11-121 |
| Isopropyl-beta-D-thiogalactoside | GoldBio | Cat#I2481C |
| Tris Base | Fisher Scientific | Cat#BP152-500 |
| NaCl | Fisher Scientific | Cat#S271-500 |
| Tween® 20 | Fisher Scientific | Cat#BP337-100 |
| MgCl•H2O | Fisher Scientific | Cat#M33-500 |
| Adenosine-5’-Triphosphate (ATP) | GoldBio | Cat#A-081-25 |
| Agarose | Fisher Scientific | Cat#BP160-500 |
| Trypan Blue Stain (0.4%) | Gibco | Cat#15250061 |
| Experimental models: Cell lines | ||
| MMTV-PyMT MFP | (Ionkina et al., 2021) | N/A |
| MMTV-PyMT LN | (Ionkina et al., 2021) | N/A |
| MMTV-PyMT Lung | (Ionkina et al., 2021) | N/A |
| MMTV-PyMT MFP Pecan-eGFP | This paper | N/A |
| MMTV-PyMT LN Cashew-mNeptune | This paper | N/A |
| MMTV-PyMT Lung Akaluc-BFP | This paper | N/A |
| DB7 Pecan-eGFP | (Rathbun et al., 2021) | N/A |
| DB7 Cashew-mNeptune | (Rathbun et al., 2021) | N/A |
| DB7 Akaluc-BFP | (Rathbun et al., 2021) | N/A |
| Recombinant DNA | ||
| pET28a Cashew | (Rathbun et al., 2017) | N/A |
| pET28a Pecan | (Rathbun et al., 2017) | N/A |
| pET28a Akaluc | (Yao et al., 2021a) | N/A |
| pET28a NanoLuc | (Yao et al., 2021a) | N/A |
| pET28a Almond | (Yao et al., 2021a) | N/A |
| AAVS1 Pecan-eFGP-T2A-Puro | (Rathbun et al., 2021) | N/A |
| AVVS1 Cashew-mNeptune-T2A-Puro | (Rathbun et al., 2021) | N/A |
| AAVS1 Akaluc-TagBFP-T2A-Puro | (Rathbun et al., 2021) | N/A |
| hCas9 (Addgene Plasmid #41815) | Gift from George Church | N/A |
| pSQT1313 (Addgene Plasmid #53370) | Gift from Keith Joung | N/A |
| Software and algorithms | ||
| Living Image Analysis Software | Perkin Elmer | N/A |
| ChemDraw v21.0.0 | Perkin Elmer | N/A |
| ImageJ (installed under the FIJI package) | NIH | N/A |
| NovoExpress Software | ACEA Biosciences | N/A |
| MATLAB R2019b | MathWorks | N/A |
| GraphPad Prism 9 | GraphPad Prism Software, Inc. | N/A |
| SubstrateUnmixing pipeline | This paper | DOI: 10.5281/zenodo.7072808 |