

Summary
This is the first 5-year analysis among persons with HIV (PWH) that reports both trabecular bone score (TBS), which is a novel index that estimates bone microarchitecture, and bone mineral density (BMD) over time to evaluate the long-term impact of antiretroviral therapy (ART) on bone health.
Purpose
HIV infection and antiretroviral therapy (ART) have been associated with decreased bone mineral density (BMD). This study aims to evaluate long-term changes in trabecular bone score (TBS), a novel index that estimates bone microarchitecture, and BMD among Chinese persons with HIV (PWH) treated with ART.
Methods
We conducted a retrospective chart review of adult PWH at a large tertiary care hospital in China. Patients who had a DXA scan prior to ART and at least one follow-up DXA after ART initiation were included. Subgroup analyses examined the TBS and BMD changes in patients who switch from a non-TDF-containing regimen to one containing TDF, as compared to those who did not switch.
Results
Four hundred fifty-nine PWH were included. Among 68 patients ≥ 50 years, 13 patients (19.1%) had a normal BMD but partially degraded or degraded TBS. The mean percent decrease in lumbar spine (LS) BMD nadired at 48 weeks after ART initiation and then gradually improved. Percent decrease in femoral neck (FN) and total hip (TH) BMD nadired at 96 weeks and remained stably low thereafter. After switch to a TDF-containing regimen, only percent change in TH BMD was significant (−3.2%, p = 0.006). In the regression analyses, switch to a TDF-containing regimen was not associated with long-term change in TBS or BMD.
Conclusion
This is the first study among PWH to evaluate the long-term impact of ART on TBS and BMD. At baseline, approximately 20% of patients had a normal BMD but impaired bone microstructure based upon TBS. For patients with 5 years of exposure to ART, there is a stabilization of TBS and BMD after initial nadir in the first 144 weeks. However, FN BMD, TH BMD, and TBS remained low at 5 years relative to baseline.
Keywords: Human immunodeficiency virus (HIV), Antiretroviral therapy (ART), Trabecular bone score (TBS), Bone mineral density (BMD), Tenofovir disoproxil fumarate (TDF)
Introduction
Expanded access to antiretroviral therapy (ART) has resulted in dramatically decreased mortality and improved life expectancy of persons with human immunodeficiency virus (PWH) in the last two decades [1, 2]. As PWH live longer, non-acquired immunodeficiency syndrome (AIDS)-related comorbidities such as osteoporosis and fragility fractures are increasing and becoming a new focus of HIV/AIDS care [3, 4].
An estimated 1,250,000 individuals live with HIV in China and the incidence of newly diagnosed cases continues to rise [5, 6]. In 2003, the China National Free Antiretroviral Treatment Program (NFATP) was established. Since that time, more than 750,000 Chinese PWH have been initiated on free government sponsored ART [7] and overall mortality from HIV/AIDS has decreased from 39.3 per 100 person-years in 2002 to 14.2 in 2009 [3]. To date, no studies have evaluated the long-term impact of ART on bone mineral density (BMD) among Chinese PWH, and there are no guidelines for the management of bone health in this specific population.
BMD measured by dual-energy X-ray absorptiometry (DXA) is the gold standard for the diagnosis of osteoporosis according to the WHO [8]. However, osteoporosis is conceptually defined as a systemic skeletal disease characterized by decreased bone mass and microarchitectural deterioration [9]. Up to 40–60% of fragility fractures occur in individuals with BMD in the osteopenic or even normal range [10]. This highlights the limited sensitivity of DXA alone for predicting fractures, because it only provides information regarding bone mass. In addition to bone mass, bone quality also includes other determinants, such as bone microarchitecture [11]. Trabecular bone score (TBS) is a recently developed tool which indirectly estimates bone microarchitecture. It is a textural index that evaluates pixel gray-level variations from the lumbar spine DXA image [12, 13] and has been shown to predict fracture risk assessment independent of BMD [14, 15]. Compared to the large number of studies that have measured BMD in PWH worldwide, few studies have evaluated changes in TBS, particularly in Asia. None have examined change in TBS measures after long-term exposure to ART, either continuously with one regimen or in the setting of switching regimens.
In order to address these gaps, we designed a retrospective study to evaluate changes in BMD and TBS among Chinese PWH treated for up to 5 years with ART. We hypothesized that HIV-infected patients receiving ART would demonstrate decreased BMD and TBS, but there would be different changes in TBS compared with BMD.
Materials and methods
Study design and population
A retrospective chart review was performed of adult outpatients receiving medical care for HIV at the Infectious Diseases Department of Peking Union Medical College Hospital (PUMCH), which is a large tertiary care hospital in Beijing, between April 2007 and April 2019.
Patients with a confirmed diagnosis of HIV (by Western blot) and who had a DXA scan prior to ART initiation and at least one follow-up DXA after ART initiation were eligible for inclusion. Patients with the following conditions were excluded from this study: pregnant or nursing women, patients who interrupted ART, patients who had a body mass index (BMI) outside of the validated range (15–37 kg/m2) for TBS interpretation, and patients with poor-quality DXA images.
Because tenofovir disoproxil fumarate (TDF) has been associated in the literature with more pronounced impact on BMD and fractures compared with other regimens [16, 17], and because it has been the backbone of the current free ART regimen provided by the NFATP since 2011 [18], we further examined the subgroup of patients (called the “Switch Group”) whose ART were treated with a non-TDF-based regimen for at least 48 weeks, and subsequently switched to a TDF-based regimen, and had a DXA scan at the time of switch and at least 48 weeks after switch. The Switch Group was compared with the “Non-Switch Group,” composed of patients consistently treated with non-TDF-based ART who had a DXA scan after at least 96 weeks of treatment.
This study was reviewed and exempt by the Peking Union Medical College Hospital Institutional Review Board.
Measures
For each patient included, we obtained information from the medical record regarding general demographic and clinical history, HIV diagnosis and treatment history, and BMD and TBS information.
Lumbar spine and right femur BMD of all patients were measured by the same DXA scanner (GE Lunar Prodigy Advance, GE Healthcare, Madison, WI) at baseline and subsequent follow-up visits. Regions of interest (ROI) of lumbar spine (LS) and right femur were L1–L4, femoral neck (FN), and total hip (TH), respectively. Both scan acquisition and analysis used the same software (enCORE version 10.50.086). The precision of the DXA operators were within acceptable limits of the International Society for Clinical Densitometry (ISCD). The least significant change (LSC) of L1–L4, femoral neck, and total hip BMD was 2.6, 4.8, and 2.0%, respectively, in the study.
The WHO criteria were used for diagnostic purposes: a T-score of ≥ −1.0 denotes normal bone mineral density; low bone density (or osteopenia) is defined as a T-score between −1.0 and −2.5; and a T-score of ≤ −2.5 denotes osteoporosis for postmenopausal women and men age 50 and older [8]. Due to the retrospective nature of this study, we were unable to collect details regarding menopausal status; therefore, 50 years was also used as the age threshold for postmenopausal status, based upon data showing the average age for menopause in China is 45–50 years [19]. For patients who were under the age of 50, a Z-score of ≤ −2.0 was defined as below the expected range for age and a Z-score > −2.0 was defined as within the expected range for age according to the ISCD [20].
TBS was measured using the iNsight v2.1 software (Med-Imaps, Merignac, France). The ROI of TBS was the same as that used for lumbar spine BMD. TBS value ≥ 1.310 was considered to be normal. TBS value between 1.230 and 1.310 referred to partially degraded bone microarchitecture and a value ≤ 1.230 implied degraded microarchitecture [14]. The precision was 1.1% and the LSC was 3.2% for TBS.
Plasma CD4+ cell counts were measured with three-color flow cytometry (Beckman Coulter, Brea, CA, USA) according to the manufacturer’s instructions. The Cobas AmpliPrep/Cobas TaqMan real-time RT-PCR Assay (Roche, CA, USA) was used to detect HIV plasma viral load (VL). Plasma CD4+ cell counts and VL analysis were performed at baseline.
Statistical analysis
Descriptive statistics were expressed as mean ± standard deviations (SD) or number (percentage) as appropriate. T-tests and χ2 tests or Fisher’s exact tests were used to compare quantitative and categorical variables, respectively. Repeated measures analysis was used to compare change in BMD and TBS over time in the Switch Group. A univariate analysis using linear regression evaluated factors [including age, gender, BMI, hepatitis B virus (HBV) co-infection, route of HIV transmission, baseline CD4+ T cell count, baseline HIV VL, TDF switch, baseline BMD at each site, and baseline TBS] associated with percent changes in BMD and TBS in subgroup analyses. Factors with univariate p values < 0.20 were included in multivariable models. We also added age, sex, and BMI into the full model regardless of their p values in the univariable analyses.
All statistical analysis was performed using the software package SPSS 22.0 (SPSS Inc., Chicago, IL, USA). p values of < 0.05 were considered statistically significant and all p-values were 2-sided.
Results
Baseline characteristics
A total of 459 patients were included in this analysis. The baseline characteristics of all patients are detailed in Table 1. There were 421 men (91.7%) and 38 women (8.3%). The mean age of the overall sample was 36.1 ± 11.3 years (range from 20.2 to 77.8 years) and the mean BMI was 22.5 ± 3.5 g/cm2. The major route of transmission was sexual transmission (371 patients, 80.8%), with blood transmission as the second common route of transmission (7 patients, 1.5%). The mean baseline CD4+ T cell count was 258 ± 178 cells/mm3, and plasma HIV VL was 4.79 ± 0.69 log10 copies/ml. Two hundred sixty-two patients in the sample had been screened for HBV infection with a hepatitis B virus surface antigen (HBsAg) test, of which 21 patients (8.0%) were positive. Four patients had a positive hepatitis C virus (HCV) antibody among the 262 patients who had a HCV test documented in the medical record.
Table 1.
Demographic and clinical characteristics, BMD and TBS measures at baseline
| Characteristics | N = 459 |
|---|---|
|
| |
| Age (years) | 36.1 ± 11.3 |
| Men, mean ± SD | 35.6 ± 11.2 |
| Women, mean ± SD | 42.3 ± 11.2 |
| < 50 years, n (%) | 391 (85.2%) |
| ≥ 50 years, n (%) | 68 (14.8%) |
| Sex, n (%) | |
| Male | 421 (91.7%) |
| Female | 38 (8.3%) |
| BMI (kg/m2) | 22.5 ± 3.5 |
| CD4 + T cell count (cells/mm3) | 258 ± 178 |
| HIV RNA load (log10 copies/mL) | 4.79 ± 0.69 |
| HBsAg positive, n (%) | 21/262 (8.0%) |
| HCV antibody positive, n (%) | 4/262 (1.5%) |
| Route of HIV transmission, n (%) | |
| Sexual intercourse | 371 (80.8%) |
| Homosexual | 307 (66.9%) |
| Heterosexual | 57 (12.4%) |
| Bisexual | 7 (1.5%) |
| Blood transmission | 11 (2.4%) |
| Unknown | 77 (16.8%) |
| BMD (g/cm2) | |
| Lumbar spine | 1.175 ± 0.139 |
| Femoral neck | 0.994 ± 0.138 |
| Total hip | 1.030 ± 0.134 |
| Z-score category (for patients< 50 years), n (%) | 391 (85.2%) |
| BMD within the expected range for age (Z-score > −2.0) | 381 (97.4%) |
| BMD below the expected range for age (Z-score ≤ −2.0) | 10 (2.6%) |
| T-score category (≥ 50 years), n (%) | 68 (14.8%) |
| Normal (T-score ≥ −1.0) | 52 (76.5%) |
| Low bone density (−2.5 < T-score < −1.0) | 15 (22.1%) |
| Osteoporosis (T-score ≤ −2.5) | 1 (1.5%) |
| TBS | 1.404 ± 0.084 |
| < 50 years | 1.410 ± 0.081 |
| ≥ 50 years | 1.369 ± 0.094 |
| TBS category, n (%) | |
| Normal (≥ 1.310) | 397 (86.5%) |
| Partly degraded (1.230~1.310) | 52 (11.3%) |
| Degraded (≤ 1.230) | 10 (2.2%) |
Values are expressed as mean ± SD or percentage of participants
BMI, body mass index; HBsAg, hepatitis B virus surface antigen; HCV, hepatitis C virus; BMD, bone mineral density; TBS, trabecular bone score
BMD and TBS measures at baseline
The mean baseline BMD of the overall sample was 1.175 ± 0.139 g/cm2 at the LS, 0.994 ± 0.138 g/cm2 at the FN, and 1.030 ± 0.134 g/cm2 at the TH. Among 391 patients (85.2%) who were under 50 years, BMD of 381/391 patients (97.4%) was within the expected range for age, and 10/391 patients (2.6%) was below the expected range for age for at least one site. There were 68 patients (14.8%) aged 50 and older. Low bone density (or osteopenia) was diagnosed in 15/68 patients (22.1%) and only 1/68 patients (1.5%) had a BMD consistent with osteoporosis for at least one site (Table 1).
The mean TBS of the overall study population was 1.404 ± 0.084, with 397/459 patients (86.5%) having a normal TBS, 52/459 patients (11.3%) with a partially degraded TBS, and 10/459 patients (2.2%) with a degraded TBS. Among patients who were under 50 years, the mean TBS was 1.410 ± 0.081 and among patients who aged 50 and older, the mean TBS was 1.369 ± 0.094 (Table 1).
Among patients < 50 years, 40/391 patients (10.2%) had BMD within the expected range for age but partially degraded TBS (34/391 patients, 8.7%) or degraded TBS (6/391 patients, 1.5%). Among patients ≥ 50 years, 13/68 patients (19.1%) had a normal BMD but partially degraded TBS (10/68 patients, 14.7%) or degraded TBS (3/68 patients, 4.4%).
Change in BMD and TBS in HIV patients after long-term ART
All 459 participants had BMD and TBS measurements at baseline. At week 48, week 96, week 144, week 192, and week 240, the number of patients who had follow-up DXA scans available was 233, 157, 116, 96, and 72, respectively. It should be noted that patients differed in terms of which follow-up time point(s) they had DXA results available. Figure 1 shows the percent changes in BMD and TBS measures from baseline to each follow-up time point.
Fig. 1.
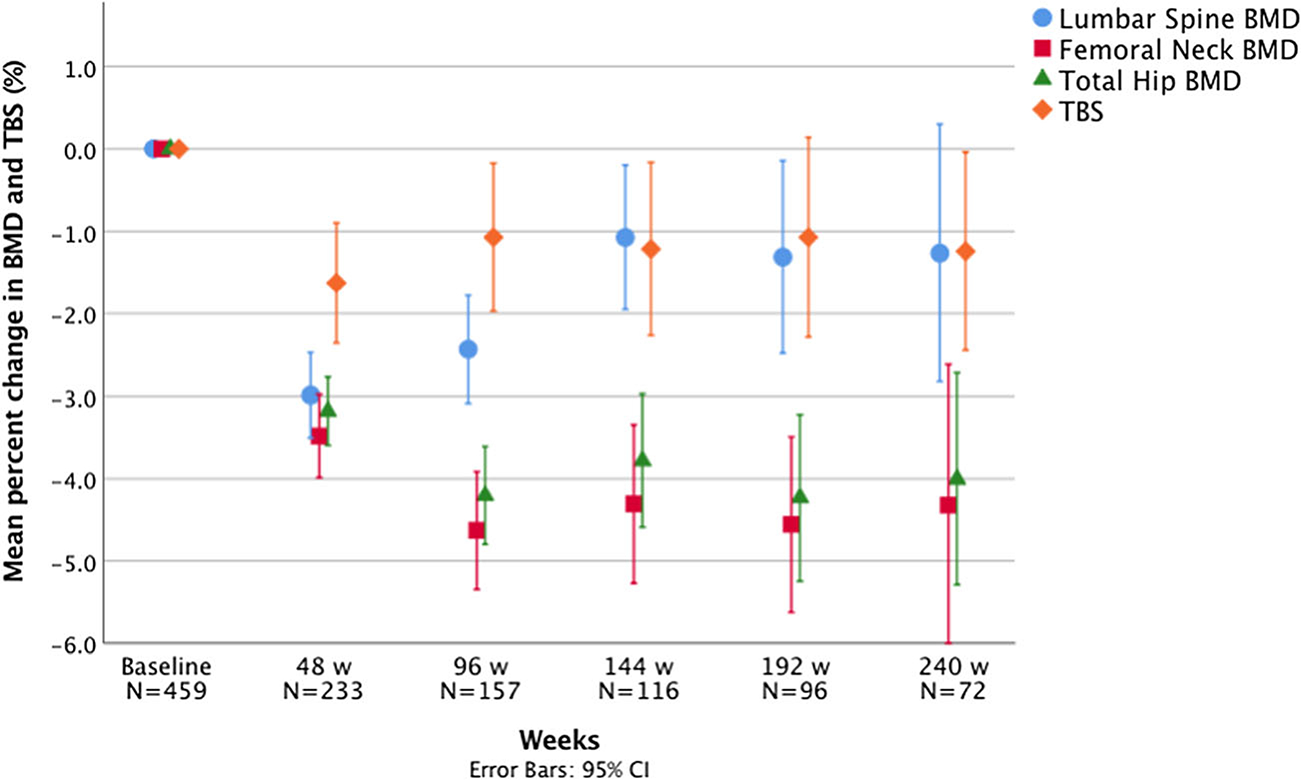
Percent changes in BMD and TBS from baseline to 48, 96, 144, 192, and 240 weeks
Lumbar spine BMD
The mean LS BMD decrease was significant from baseline to 48 weeks (1.171 ± 0.142 vs. 1.136 ± 0.145 g/cm2, p < 0.001), baseline to 96 weeks (1.182 ± 0.146 vs. 1.152 ± 0.143 g/cm2, p<0.001), baseline to 144 weeks (1.193 ± 0.141 vs. 1.180 ± 0.146 g/cm2, p = 0.012), and baseline to 192 weeks (1.197 ± 0.143 vs. 1.180 ± 0.150 g/cm2, p = 0.016). However, there was no statistically significant difference in LS BMD between baseline and 240 weeks (1.183 ± 0.144 vs. 1.168 ± 0.161 g/cm2, p = 0.118). The mean percent change in LS BMD from baseline to 48 weeks (−3.0 ± 4.0%) was not significantly different from the mean percent decrease from baseline to 96 weeks (−2.4 ± 4.1%, p = 0.196). The percent change observed from baseline to 96 weeks was larger than the percent change observed from baseline to 144 weeks (−1.1 ± 4.8%, p = 0.015), which was similar to the percent change from baseline to 192 weeks (−1.3 ± 5.8%, p = 0.747) (Fig. 1).
Femoral neck BMD
BMD at the FN decreased by −3.5 ± 3.9% (p < 0.001) from baseline to 48 weeks, and a larger decrease (p = 0.008) was observed from baseline to 96 weeks (−4.6 ± 4.5%, p < 0.001). The percent change from baseline to 96 weeks, 144 weeks (−4.3 ± 5.2%, p < .001), 192 weeks (−4.6 ± 5.3%, p <0.001), and 240 weeks (−4.3 ± 7.3%, p < 0.001) were similar (p = 0.946) (Fig. 1). The mean FN BMD at 240 weeks was significantly lower than baseline (1.004 ± 0.142 vs. 0.952 ± 0.148 g/cm2, p < 0.001).
Total hip BMD
A decrease in TH BMD was also observed from baseline to 48 weeks (−3.2 ± 3.2%, p < 0.001), with a larger percent decrease observed (p = 0.004) from baseline to 96 weeks (−4.2 ± 3.8%, p < 0.001). The mean percent change from baseline to 96 weeks, 144 weeks (−3.8 ± 4.4%, p < 0.001), 192 weeks (−4.2 ± 5.0%, p < 0.001), and 240 weeks (−4.0 ± 5.5%, p < 0.001) was not statistically different (p = 0.798) (Fig. 1). The mean TH BMD at 240 weeks was significantly lower than baseline (1.049 ± 0.141 vs. 0.997 ± 0.148 g/cm2, p < 0.001).
TBS
A decrease in TBS was observed from baseline to 48 weeks (−1.6 ± 5.7%, p < 0.001). There were no statistically significant differences between the mean percent decrease from baseline to 48 weeks and from baseline to 96 weeks (p = 0.345). The mean percent change in TBS from baseline to 96 weeks (−1.1 ± 5.7%, p = 0.009), 144 weeks (−1.2 ± 5.7%, p = 0.010), 192 weeks (−1.1 ± 6.0%, p < 0.001), and 240 weeks (−1.2 ± 5.1%, p = 0.033) was not statistically significant different (p = 0.922) (Fig. 1). The mean TBS at 240 weeks was significantly lower than baseline (1.405 ± 0.088 vs. 1.387 ± 0.099, p = 0.033).
Changes in BMD and TBS measures in the Switch and Non-Switch Groups
In our subgroup analysis, a total of 43 patients met criteria for inclusion in the Switch Group and 50 patients in the Non-Switch Group (Table 2). At baseline, the mean ages of patients in the Switch Group and Non-Switch Groups were 36.9 ± 10.1 years and 38.9 ± 14.1 years, respectively (p = 0.483). The mean duration from baseline to the last follow-up point was 7.0 ± 2.8 years in the Switch Group versus 6.4 ± 3.1 years in the Non-Switch Group (p = 0.296). Most demographic and clinical parameters were well balanced between these two groups (Table 2).
Table 2.
Baseline demographic and clinical characteristics and BMD and TBS measures at both baseline and the last follow-up point in the Switch and Non-Switch Groups
| Characteristics | Switch Group | Non-Switch Group | p value |
|---|---|---|---|
|
| |||
| N | 43 | 50 | |
| Age (years) | 36.9 ± 10.1 | 38.9 ± 14.1 | 0.483 |
| Treatment duration (years) | 7.0 ± 2.8 | 6.4 ± 3.1 | 0.296 |
| Sex, n (%) | 0.510 | ||
| Male | 37 (86.0%) | 44 (88.0%) | |
| Female | 6 (14.0%) | 6 (12.0%) | |
| BMI (kg/m2) | 21.9 ± 3.2 | 21.9 ± 3.3 | 0.840 |
| CD4 + T cell count (cells/mm3) | 160 ± 188 | 207 ± 201 | 0.307 |
| HIV RNA load (log10 copies/mL) | 4.9 ± 0.8 | 4.8 ± 0.6 | 0.418 |
| Route of HIV transmission, n (%) | 0.419 | ||
| Sexual intercourse | 35 (81.4%) | 35 (70.0%) | |
| Homosexual | 25 (58.1%) | 26 (52.0%) | |
| Heterosexual | 9 (20.9%) | 8 (16.0%) | |
| Bisexual | 1 (2.3%) | 1 (2.0%) | |
| Blood transmission | 3 (7.0%) | 4 (8.0%) | |
| Unknown | 5 (11.6%) | 11 (22.0%) | |
| BMD at baseline (g/cm2) | |||
| Lumbar spine | 1.172 ± 0.121 | 1.162 ± 0.176 | 0.743 |
| Femoral neck | 0.977 ± 0.122 | 0.968 ± 0.149 | 0.757 |
| Total hip | 1.020 ± 0.126 | 1.017 ± 0.160 | 0.908 |
| BMD at the last follow-up point (g/cm2) | |||
| Lumbar spine | 1.168 ± 0.155 | 1.163 ± 0.185 | 0.883 |
| Femoral neck | 0.921 ± 0.134 | 0.931 ± 0.145 | 0.718 |
| Total hip | 0.965 ± 0.133 | 0.984 ± 0.160 | 0.539 |
| TBS at baseline | 1.402 ± 0.070 | 1.418 ± 0.099 | 0.368 |
| TBS category at baseline, n (%) | 0.833 | ||
| Normal (≥ 1.310) | 36 (83.7%) | 44 (88.0%) | |
| Partly degraded (1.230~1.310) | 6 (14.0%) | 5 (10.0%) | |
| Degraded (≤ 1.230) | 1 (2.3%) | 1 (2.0%) | |
| TBS at the last follow-up point | 1.374 ± 0.093 | 1.390 ± 0.097 | 0.402 |
| TBS category at the last follow-up point, n (%) | 0.781 | ||
| Normal (≥ 1.310) | 34 (79.1%) | 39 (78.0%) | |
| Partly degraded (1.230~1.310) | 7 (16.3%) | 7 (14.0%) | |
| Degraded (≤ 1.230) | 2 (4.7%) | 4 (8.0%) | |
| Percent change (from baseline to the last follow-up point) | |||
| Lumbar spine BMD | −0.5 ± 6.8% | 0.1 ± 6.2% | 0.683 |
| Femoral neck BMD | −5.7 ± 7.8% | −3.7 ± 5.6% | 0.145 |
| Total hip BMD | −5.5 ± 5.5% | −3.2 ± 4.5% | 0.031 |
| TBS | −2.0 ± 5.8% | −1.7 ± 6.6% | 0.109 |
Values are expressed as mean ± SD or percentage of participants
BMI, body mass index; BMD, bone mineral density; TBS, trabecular bone score
In the Switch Group, duration from baseline to the switch point was 3.5 ± 2.0 years and 3.5 ± 2.2 years from the switch point to the last follow-up point (p = 0.515). From baseline to the switch point, FN BMD (Fig. 2b), TH BMD (Fig. 2c), and TBS (Fig. 2d) decreased significantly. However, from the switch point to the last follow-up point, only TH BMD deceased significantly (0.985 ± 0.129 vs. 0.965 ± 0.133 g/cm2, p = 0.006) (Fig. 2c) and no differences in LS BMD (Fig. 2a), FN BMD (Fig. 2b), or TBS (Fig. 2d) were detected.
Fig. 2.
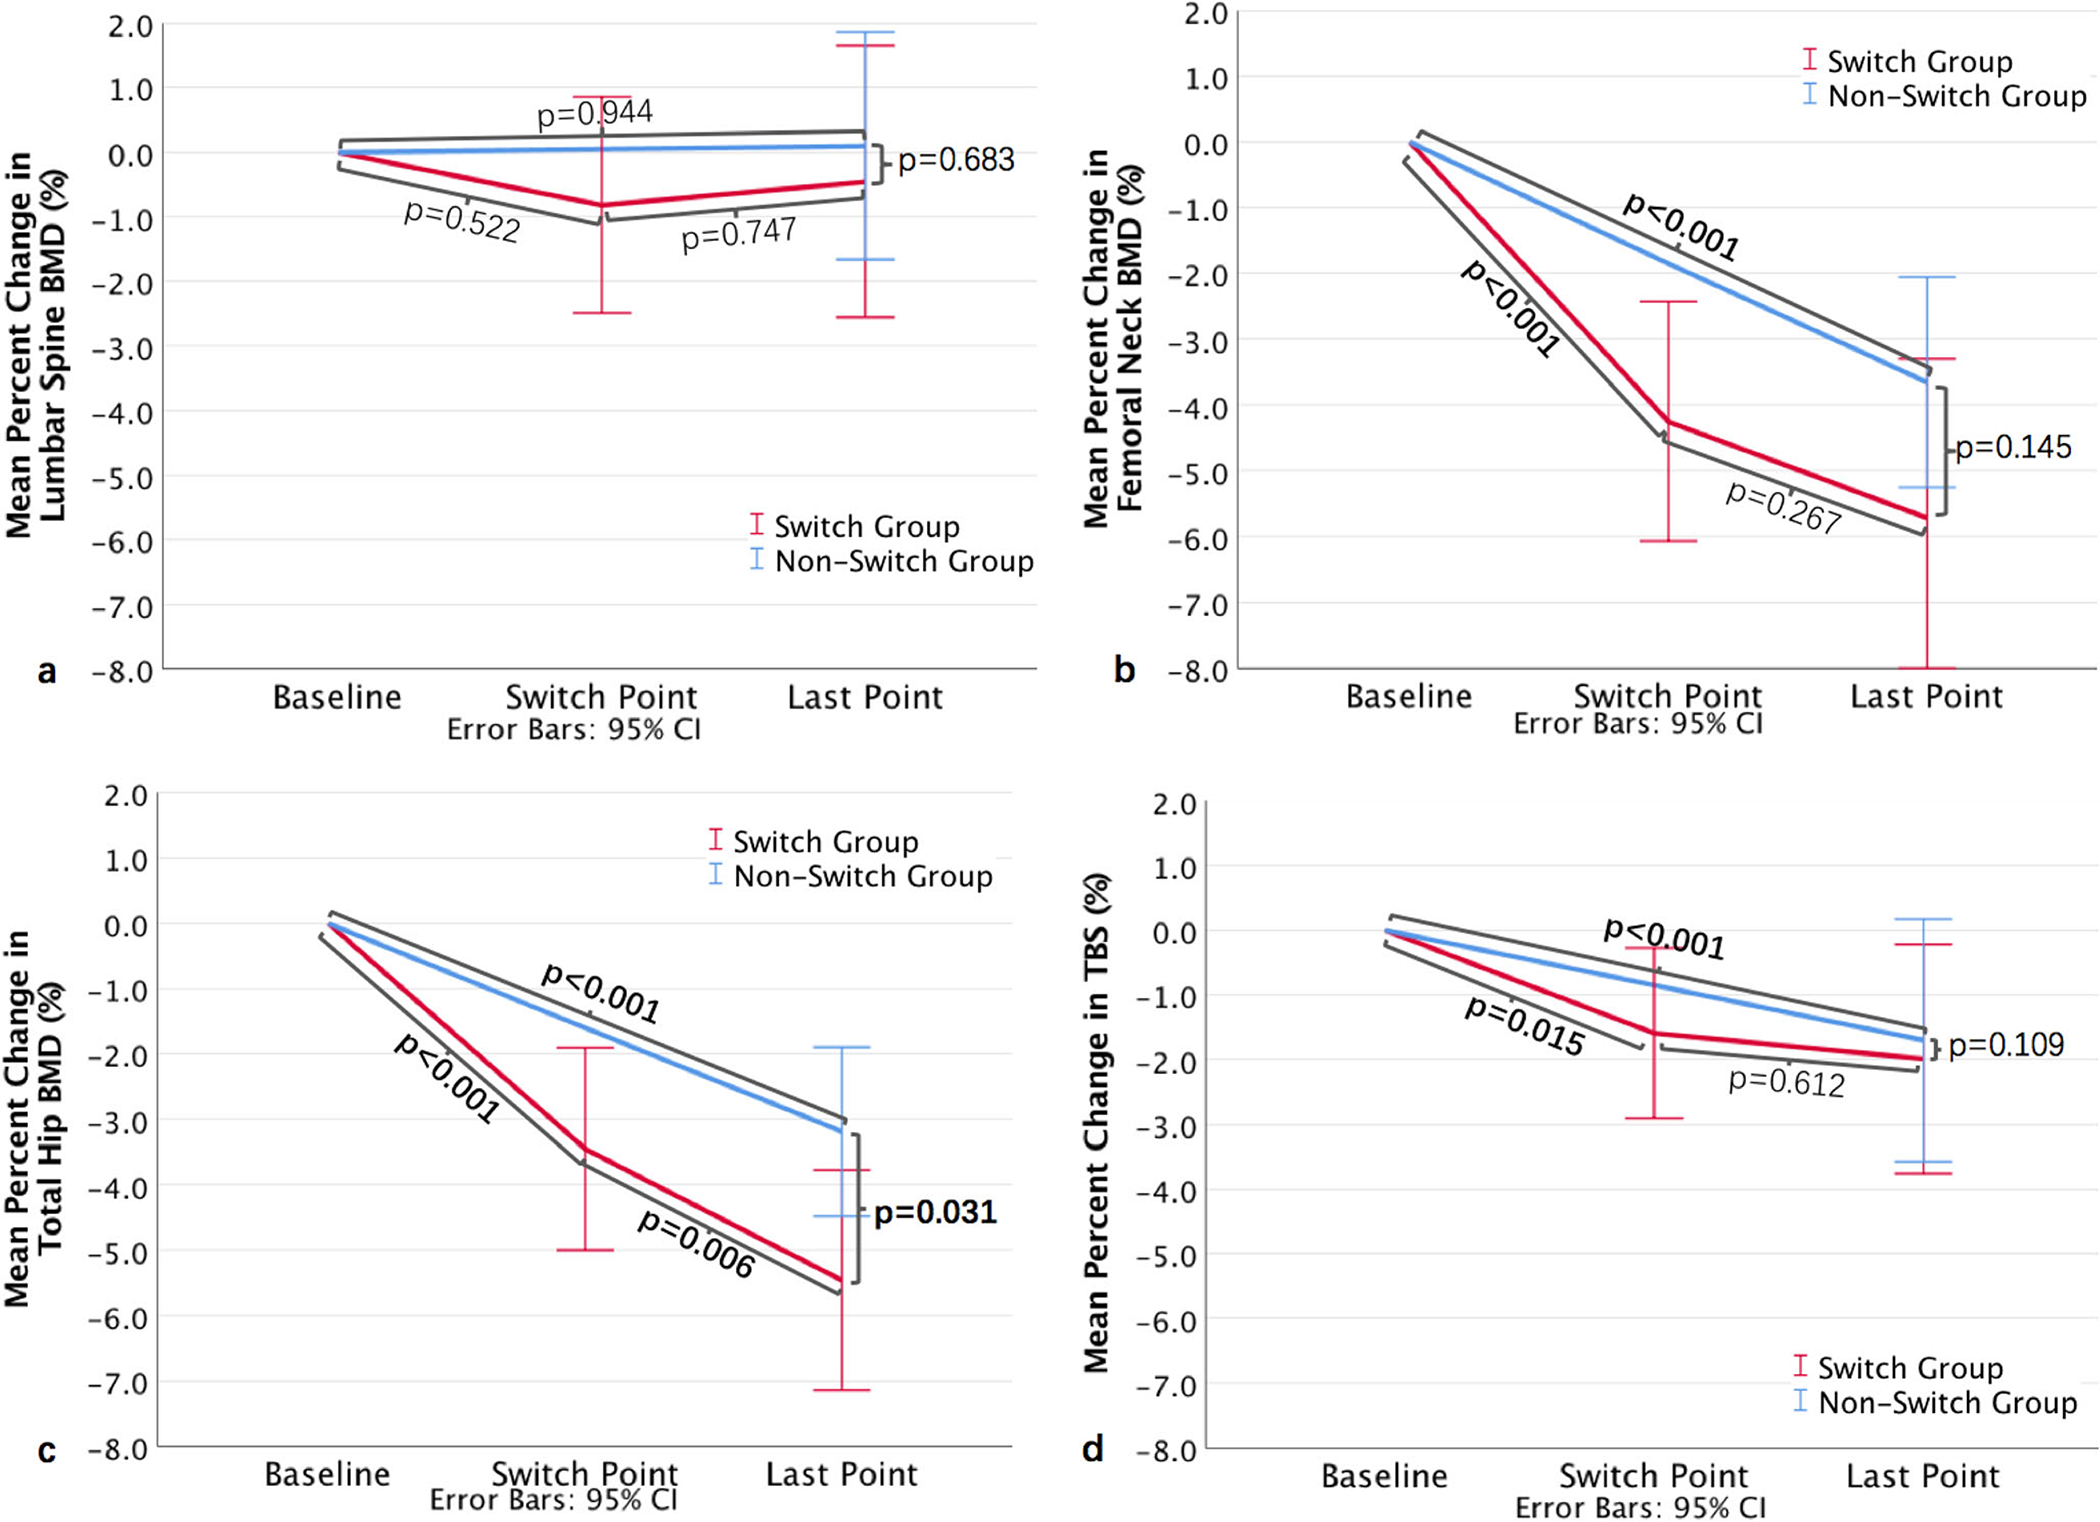
The mean percent change in BMD of the a lumbar spine; b femoral neck; c total hip; and d TBS from baseline to the last follow-up point in the Switch Group and Non-Switch Group
At baseline and at the last follow-up point, no statistically significant differences were observed in BMD, TBS, or distribution across TBS categories between the Switch Group and Non-Switch Group (Table 2). From baseline to the last follow-up point, with the exception of LS BMD, the other three measures all decreased significantly both in the Switch Group and in the Non-Switch Group. There were significant differences in percent decrease in TH BMD between the Switch Group (−5.5 ± 5.5%) and the Non-Switch Group (−3.2 ± 4.5%, p = 0.031) (Fig. 2c), while no differences in percent change were observed in LS BMD (Fig. 2a), FN BMD (Fig. 2b), or TBS (Fig. 2d) between the two groups.
In the multivariable analysis, switching to TDF was not associated with BMD loss at the LS, FN, and TH, nor with decrease in TBS. From baseline to the last follow-up point, older age was associated with larger declines in LS BMD [β (95%CI): 0.175 (0.046, 0.304), p = 0.009] and higher baseline HIV VL was associated with greater declines in FN BMD [3.987 (1.686, 6.288), p = 0.001] and TH BMD [2.900 (1.249, 4.551), p = 0.001]. Significant associations were also found between lower BMI and greater decline in TBS [−0.553 (−0.965, 0.140), p = 0.009] (Table 3).
Table 3.
Factors associated with decease in lumbar spine, femoral neck, total hip BMD, and TBS from baseline to the last follow-up point in 93 HIV-infected patients in Switch Group and Non-Switch Group
| Variable | Lumbar spine BMD |
Femoral neck BMD |
Total hip BMD |
TBS |
||||
|---|---|---|---|---|---|---|---|---|
| β (95% CI) | p value | β (95% CI) | p value | β (95% CI) | p value | β (95% CI) | p value | |
|
| ||||||||
| Age | 0.175 (0.046, 0.304) | 0.009 | −0.024 (−0.169, 0.122) | 0.745 | −0.030 (−0.129, 0.070) | 0.556 | 0.078 (−0.041, 0.196) | 0.196 |
| Sex | −2.624 (−6.792, 1.543) | 0.213 | −1.405 (−5.805, 2.995) | 0.526 | −1.268 (−4.426, 1.891) | 0.426 | −3.011 (−6.652, 0.630) | 0.103 |
| BMI | −0.065 (−0.510, 0.380) | 0.772 | 0.003 (−0.471, 0.477) | 0.991 | 0.109 (−0.235, 0.453) | 0.531 | −0.553 (−0.965, 0.140) | 0.009 |
| Baseline HIV VL | 2.148 (−0.007, 4.303) | 0.051 | 3.987 (1.686, 6.288) | 0.001 | 2.900 (1.249, 4.551) | 0.001 | 1.250 (−0.653, 3.154) | 0.194 |
| Baseline LS BMD | −3.979 (−14.574, 6.617) | 0.456 | NA | NA | NA | NA | NA | NA |
| Baseline FN BMD | NA | NA | 6.835 (−6.065, 19.735) | 0.294 | NA | NA | NA | NA |
| Baseline TH BMD | NA | NA | NA | NA | 1.301 (−7.089, 9.692) | 0.758 | NA | NA |
| Baseline TBS | NA | NA | NA | NA | NA | NA | 3.933 (−7.851, 15.716) | 0.484 |
| TDF switch | 1.164 (−1.805, 4.133) | 0.437 | 1.039 (−2.124, 4.202) | 0.514 | 1.502 (−0.765, 3.769) | 0.191 | 1.455 (−1.195, 4.104) | 0.277 |
CI, confidence interval; BMI, body mass index; VL, viral load; BMD, bone mineral density; TBS, trabecular bone score; TDF, tenofovir disoproxil fumarate; NA, not applicable
Discussion
Few studies have evaluated TBS as compared with BMD in PWH on long-term ART, particularly in Asia. Longer term studies have been limited to reporting BMD measures, whereas those evaluating TBS have generally only looked at differences over 48 to 96 weeks [21, 22]. To our knowledge, we present the first 5-year analysis among PWH that reports both BMD and TBS measures over time. Before ART initiation, among patients ≥ 50 years, 19.1% had normal BMD but degraded or partially degraded TBS. While there is a stabilization in BMD and TBS after the first 3 years of ART, FN BMD, TH BMD, and TBS remain persistently low. Only LS BMD was not significantly different from baseline after 5 years of ART exposure. After switch to a TDF-containing regimen, statistically significant BMD loss was observed only at the total hip. However, no associations were found between TDF switch and decrease in BMD or TBS.
As a tool for noninvasive and indirect evaluation of bone microarchitecture, TBS correlates with 3D measurements of bone trabecular microstructure and reflects qualitative aspects of bone structure that are complementary to BMD [23, 24]. Ciullini et al. found that vertebral fracture risk was reduced by 44% for each SD increase in TBS in a study of predominantly Caucasian middle-aged men with HIV [15]. Our study is the first to report that among PWH with normal BMD, 10.2% of patients < 50 years and 19.1% of patients ≥ 50 years had abnormal TBS, which means if DXA alone were used to assess for fracture risk, about 10 to 20% of patients with impaired bone microarchitecture would not have been identified. Studies have shown that TBS may help on the identification of patients at risk for fracture due to certain secondary causes of osteoporosis where BMD changes can be misleading or delayed, including type 2 diabetes [25] and chronic kidney disease [26]. TBS has also been incorporated as an adjustment parameter for the fracture risk assessment tool (FRAX) and can provide support to guide individualized treatment decisions for patients whose BMD is near the intervention threshold [12].
In our study, among patients aged 50 years and older, only 22.2% of patients were classified as having low bone density and 1.5% as having osteoporosis, based upon T-score. These percentages were significantly lower than prior studies from other countries, which range from 40 to 70% for low bone density and 10 to 15% for osteoporosis [27]. In China, homosexual contact among men who have sex with men (MSM) has overtaken blood-borne and heterosexual transmission as the predominant route of transmission [28]. Due to this change, young males have become the largest demographic group of Chinese PWH [3], which may account for the lower proportions of low bone density and osteoporosis in our cohort. Another possible reason may be racial and regional differences. Finally, we analyzed Z-scores among patients < 50 years and T-scores in patients ≥ 50 years as recommended; however, this may lead to slightly different proportions compared with studies using T-scores only for the evaluation of osteoporosis across all study populations.
Many previous studies have shown that the greatest BMD loss (2–6%) among PWH occurs during the first 48–96 weeks after ART initiation and then is followed by periods of BMD stability or increases, regardless of the choice of therapy [16, 21, 29]. We reported a similar but not identical trend in BMD change. Mean percent decrease in BMD from baseline “stabilized” at different time points for different BMD sites: after a nadir at 48 weeks, mean percent decrease in LS BMD became less pronounced and stabilized after 144 weeks, and FN and TH BMD reached their nadir at 96 weeks but remained stable thereafter without subsequent improvement. Our study further demonstrated stability in TBS beyond 48 weeks of ART. It is worth-while to point out that among patients with 5 years of ART exposure, LS BMD at 240 weeks was not statistically different from baseline levels; however, this finding could have been impacted by the smaller sample size at this time point. For FN and TH BMD, statistically significant differences were present at 240 weeks post-ART initiation. Similar results were found in the Switch and Non-Switch Group. Studies have shown that cortical and trabecular bone may be affected differently in PWH [29–31], which may explain the differences in percent BMD change observed at different sites in our study. Compared with regions of greater cortical bone (femoral neck and total hip), the lumbar vertebra, which is highly trabecular in nature, may be more subject to bone turnover and remodeling [16], which may explain why only LS BMD at 5 years was similar to baseline in our study and why the LS BMD and TBS followed an obviously different trend than the changes in TH and FN BMD. By contrast, the percent change in FN and TH BMD from baseline did not lessen over time, suggesting that this region may remain vulnerable. These future prospective studies are needed to confirm this finding and larger scale studies are also needed to understand if this persistent depression of FN and TH BMD ultimately correlates with increased risk for hip fractures among Chinese PWH.
In previous studies, exposure to TDF-containing ART led to greater BMD loss compared with non-TDF-containing ART [16, 17]. Güerri-Fernández and colleagues conducted a cross-sectional study in 63 Spanish patients with HIV undergoing treatment with TDF-FTC or ABC-3TC for over 5 years and reported that LS BMD in patients on TDF-FTC was significantly lower than that of those on ABC-3TC, but there were no significant differences in the FN BMD, TH BMD, or TBS [32]. In our study, after switch to TDF-containing regimens, we only found a decline in TH BMD. No decreases of BMD at the LS and FN and TBS were observed, and no associations were found between TDF switch and changes in BMD and TBS. The etiology of damage to skeletal tissue is multifactorial, with contributions from HIV infection [33], ART [34–36], and traditional osteoporosis risk factors such as malnutrition, low physical activity, smoking, and alcohol use [29]. After 3.5 years of ART, most patients displayed good treatment adherence and undetectable HIV viral loads in our study. Effective antiretroviral treatment leading to decreased viral load [37], immunological reconstitution [38], and improved overall health from having established health care [39] may mitigate some of the deleterious effects of ART on bone health.
This study has some limitations. First, the relatively small sample size of HIV-infected individuals in the Switch and Non-Switch Groups reduced our power to detect potentially relevant associations. Second, the retrospective nature of this study prevented us from evaluating some important risk factors, such as menopause (among women), smoking, and alcohol status as these data were not consistently extractable from the medical records. Then, we recognize that there may be selection bias in our retrospective study, so our study may overestimate the incidence of abnormal BMD and TBS. Finally, we acknowledge that our study represents data from one tertiary hospital located in an economically developed region of China, so we only have Asian population in our study and thus may not be generalizable to other regions and races. Future prospective multicenter studies with larger sample sizes investigating the mechanisms behind bone loss associated with HIV infection and ART are still needed.
In conclusion, this is the first study among Chinese PWH to evaluate the long-term impact of ART on TBS and BMD. At baseline, we found that approximately 10% of patients < 50 years and 20% of patients ≥ 50 years had a normal BMD, but partially degraded or degraded TBS, suggesting there may be a role for TBS in fracture-risk screening algorithms. However, further work is needed to confirm this finding. For patients with 5 years of exposure to ART, there is a stabilization in BMD and TBS after the first 3 years; then TBS, FN BMD, and TH BMD remained low at 5 years relative to baseline. Only LS BMD at 5 years was similar to baseline. Future studies are needed to see whether this is associated with increased risk for fractures, particularly hip fractures, over time in this population. Furthermore, our analysis of patients who switched from a non-TDF-containing regimen to a TDF-containing regimen demonstrated only a significant decrease in TH BMD compared with baseline. These collective findings shed greater light on the long-term impact of ART on BMD and TBS among Chinese PWH and will inform the development of future guidelines for the management of bone health in this vulnerable population.
Acknowledgments
We thank the patients and their families for their participation during this study.
Funding
This study was funded by the National Key Technologies Research and Development Program for the 13th Five-Year Plan (2017ZX10202101) and the Chinese Academy of Medical Sciences (CAMS) Innovation Fund for Medical Sciences (2017–12M-1–014). This publication was also made possible by CTSA grant number UL1 TR001863 from the National Center for Advancing Translational Science (NCATS), components of the National Institutes of Health (NIH), and NIH roadmap for Medical Research. Its contents are solely the responsibility of the authors and do not necessarily represent the official view of NIH. Dr. Guan is supported by the 2019 Peking Union Medical College Doctoral Student Short-term Visiting Fund. Dr. Hsieh is supported by NIH/Fogarty International Center K01TW009995.
Footnotes
Conflicts of interest Wenmin Guan, Wei Pan, Wei Yu, Wei Cao, Qiang Lin, Zaizhu Zhan, Xiaojing Song, Yanling Li, Junping Tian, Ying Xu, Taisheng Li, and Evelyn Hsieh declare that they have no conflict of interest.
References
- 1.Teeraananchai S, Kerr SJ, Amin J, Ruxrungtham K, Law MG (2017) Life expectancy of HIV-positive people after starting combination antiretroviral therapy: a meta-analysis. HIV Med 18(4): 256–266. 10.1111/hiv.12421 [DOI] [PubMed] [Google Scholar]
- 2.Bigna JJ, Ndoadoumgue AL, Nansseu JR, Tochie JN, Nyaga UF, Nkeck JR, Foka AJ, Kaze AD, Noubiap JJ (2020) Global burden of hypertension among people living with HIV in the era of increased life expectancy: a systematic review and meta-analysis. J Hypertens 38(9):1659–1668. 10.1097/HJH.0000000000002446 [DOI] [PubMed] [Google Scholar]
- 3.Cao W, Hsieh E, Li T (2020) Optimizing treatment for adults with HIV/AIDS in China: successes over two decades and remaining challenges. Curr HIV/AIDS Rep 17(1):26–34. 10.1007/s11904-019-00478-x [DOI] [PMC free article] [PubMed] [Google Scholar]
- 4.Smit M, Brinkman K, Geerlings S, Smit C, Thyagarajan K, Sighem A, de Wolf F, Hallett TB (2015) Future challenges for clinical care of an ageing population infected with HIV: a modelling study. Lancet Infect Dis 15(7):810–818. 10.1016/S1473-3099(15)00056-0 [DOI] [PMC free article] [PubMed] [Google Scholar]
- 5.National Health Commission of the People’s Republic of China (2020) Regular press conference: Progress in the prevention and treatment of AIDS in China. http://ncaidschinacdccn.com/xxgx/yqxx/201811/t20181123_197488.htm. Accessed 23 February 2020.
- 6.Zhao DC, Wen Y, Ma Y, Zhao Y, Zhang Y, Wu YS, Liu X, Au E, Liu ZF, Zhang FJ (2012) Expansion of China’s free antiretroviral treatment program. Chin Med J 125(19):3514–3521. 10.3760/cma.j.issn.0366-6999.2012.19.028 [DOI] [PubMed] [Google Scholar]
- 7.Zhang F, Haberer JE, Wang Y, Zhao Y, Ma Y, Zhao D, Yu L, Goosby EP (2007) The Chinese free antiretroviral treatment program: challenges and responses. AIDS 21(Suppl 8):S143–S148. 10.1097/01.aids.0000304710.10036.2b [DOI] [PubMed] [Google Scholar]
- 8.Kanis JA (1994) Assessment of fracture risk and its application to screening for postmenopausal osteoporosis: synopsis of a WHO report. WHO Study Group. Osteoporos Int 4(6):368–381. 10.1007/BF01622200 [DOI] [PubMed] [Google Scholar]
- 9.Kanis JA, Melton LJ 3rd, Christiansen C, Johnston CC, Khaltaev N (1994) The diagnosis of osteoporosis. J Bone Miner Res 9(8):1137–1141. 10.1002/jbmr.5650090802 [DOI] [PubMed] [Google Scholar]
- 10.(1993) Consensus development conference: diagnosis, prophylaxis, and treatment of osteoporosis. Am J Med 94(6):646–650. 10.1016/0002-9343(93)90218-e [DOI] [PubMed] [Google Scholar]
- 11.Dalle Carbonare L, Giannini S (2004) Bone microarchitecture as an important determinant of bone strength. J Endocrinol Investig 27(1):99–105. 10.1007/BF03350919 [DOI] [PubMed] [Google Scholar]
- 12.Hans D, Stenova E, Lamy O (2017) The trabecular bone score (TBS) complements DXA and the FRAX as a fracture risk assessment tool in routine clinical practice. Curr Osteoporos Rep 15(6):521–531. 10.1007/s11914-017-0410-z [DOI] [PubMed] [Google Scholar]
- 13.Martineau P, Leslie WD (2017) Trabecular bone score (TBS): method and applications. Bone 104:66–72. 10.1016/j.bone.2017.01.035 [DOI] [PubMed] [Google Scholar]
- 14.McCloskey EV, Oden A, Harvey NC et al. (2016) A meta-analysis of trabecular bone score in fracture risk prediction and its relationship to FRAX. J Bone Miner Res 31(5):940–948. 10.1002/jbmr.2734 [DOI] [PubMed] [Google Scholar]
- 15.Ciullini L, Pennica A, Argento G, Novarini D, Teti E, Pugliese G, Aceti A, Conti FG (2018) Trabecular bone score (TBS) is associated with sub-clinical vertebral fractures in HIV-infected patients. J Bone Miner Metab 36(1):111–118. 10.1007/s00774-017-0819-6 [DOI] [PubMed] [Google Scholar]
- 16.McComsey GA, Kitch D, Daar ES, Tierney C, Jahed NC, Tebas P, Myers L, Melbourne K, Ha B, Sax PE (2011) Bone mineral density and fractures in antiretroviral-naive persons randomized to receive abacavir-lamivudine or tenofovir disoproxil fumarate-emtricitabine along with efavirenz or atazanavir-ritonavir: Aids Clinical Trials Group A5224s, a substudy of ACTG A5202. J Infect Dis 203(12):1791–1801. 10.1093/infdis/jir188 [DOI] [PMC free article] [PubMed] [Google Scholar]
- 17.Stellbrink HJ, Orkin C, Arribas JR et al. (2010) Comparison of changes in bone density and turnover with abacavir-lamivudine versus tenofovir-emtricitabine in HIV-infected adults: 48-week results from the ASSERT study. Clin Infect Dis 51(8):963–972. 10.1086/656417 [DOI] [PubMed] [Google Scholar]
- 18.AIDS Professional Group (2011) Society of Infectious Diseases Chinese Medical Association: guidelines for diagnosis and treatment of HIV/AIDS in China. Chin J Infect Dis 4(6):321–330. 10.3760/cma.j.issn.1674-2397.2011.06.001 [DOI] [Google Scholar]
- 19.Chinese Medical Association Menopause Professional Group (2018) Guidelines for diagnosis of menopause and treatment of menopausal hormone therapy in China (2018). Chin J Obstet Gynecol 53(11):729–739. 10.3969/j.issn.1674-9081.2018.06.007 [DOI] [Google Scholar]
- 20.Adult Official Positions of the International Society for Clinical Densitometry. http://www.iscd.org/offcialpositions/offcial ISCD position-adult (English). Accessed 25 February 2020.
- 21.Grant PM, Kitch D, McComsey GA et al. (2016) Long-term bone mineral density changes in antiretroviral-treated HIV-infected individuals. J Infect Dis 214(4):607–611. 10.1093/infdis/jiw204 [DOI] [PMC free article] [PubMed] [Google Scholar]
- 22.Güerri-Fernández R, Lerma-Chippirraz E, Fernandez Marron A et al. (2018) Bone density, microarchitecture, and tissue quality after 1 year of treatment with tenofovir disoproxil fumarate. AIDS 32(7): 913–920. 10.1097/QAD.0000000000001780 [DOI] [PubMed] [Google Scholar]
- 23.Silva BC, Leslie WD, Resch H, Lamy O, Lesnyak O, Binkley N, McCloskey EV, Kanis JA, Bilezikian JP (2014) Trabecular bone score: a noninvasive analytical method based upon the DXA image. J Bone Miner Res 29(3):518–530. 10.1002/jbmr.2176 [DOI] [PubMed] [Google Scholar]
- 24.Silva BC, Leslie WD (2017) trabecular bone score: a new DXA-derived measurement for fracture risk assessment. Endocrinol Metab Clin N Am 46(1):153–180. 10.1016/j.ecl.2016.09.005 [DOI] [PubMed] [Google Scholar]
- 25.Choi YJ, Ock SY, Chung YS (2016) Trabecular bone score (TBS) and TBS-adjusted fracture risk assessment tool are potential supplementary tools for the discrimination of morphometric vertebral fractures in postmenopausal women with type 2 diabetes. J Clin Densitom 19(4):507–514. 10.1016/j.jocd.2016.04.001 [DOI] [PubMed] [Google Scholar]
- 26.Ramalho J, Marques IDB, Hans D, Dempster D, Zhou H, Patel P, Pereira RMR, Jorgetti V, Moyses RMA, Nickolas TL (2018) The trabecular bone score: relationships with trabecular and cortical microarchitecture measured by HR-pQCT and histomorphometry in patients with chronic kidney disease. Bone 116:215–220. 10.1016/j.bone.2018.08.006 [DOI] [PubMed] [Google Scholar]
- 27.Brown TT, Qaqish RB (2006) Antiretroviral therapy and the prevalence of osteopenia and osteoporosis: a meta-analytic review. AIDS 20(17):2165–2174. 10.1097/QAD.0b013e32801022eb [DOI] [PubMed] [Google Scholar]
- 28.Pan SW, Smith MK, Carpiano RM, Fu H, Ong JJ, Huang W, Tang W, Tucker JD (2020) Supernatural explanatory models of health and illness and HIV antiretroviral therapy use among young men who have sex with men in China. Int J Behav Med, online ahead of print. 10.1007/s12529-020-09883-8 [DOI] [PubMed] [Google Scholar]
- 29.Bolland MJ, Wang TK, Grey A, Gamble GD, Reid IR (2011) Stable bone density in HAART-treated individuals with HIV: a meta-analysis. J Clin Endocrinol Metab 96(9):2721–2731. 10.1210/jc.2011-0591 [DOI] [PubMed] [Google Scholar]
- 30.Yin MT, Shu A, Zhang CA, Boutroy S, McMahon DJ, Ferris DC, Colon I, Shane E (2013) Trabecular and cortical microarchitecture in postmenopausal HIV-infected women. Calcif Tissue Int 92(9):557–565. 10.1007/s00223-013-9716-8 [DOI] [PMC free article] [PubMed] [Google Scholar]
- 31.Yin MT, Lund E, Shah J et al. (2014) Lower peak bone mass and abnormal trabecular and cortical microarchitecture in young men infected with HIV early in life. AIDS 28(3):345–353. 10.1097/QAD.0000000000000070 [DOI] [PMC free article] [PubMed] [Google Scholar]
- 32.Güerri-Fernández R, Molina-Morant D, Villar-García J, Herrera S, González-Mena A, Guelar A, Trenchs-Rodríguez M, Díez-Pérez A, Knobel H (2017) Bone density, microarchitecture, and tissue quality after long-term treatment with tenofovir/emtricitabine or abacavir/lamivudine. J Acquir Immune Defic Syndr 75(3):322–327. 10.1097/QAI.0000000000001396 [DOI] [PubMed] [Google Scholar]
- 33.Borderi M, Gibellini D, Vescini F, De Crignis E, Cimatti L, Biagetti C, Tampellini L, Re MC (2009) Metabolic bone disease in HIV infection. AIDS 23(11):1297–1310. 10.1097/QAD.0b013e32832ce85a [DOI] [PubMed] [Google Scholar]
- 34.Bolland MJ, Grey A, Reid IR (2015) Skeletal health in adults with HIV infection. Lancet Diabetes Endocrinol 3(1):63–74. 10.1016/S2213-8587(13)70181-5 [DOI] [PubMed] [Google Scholar]
- 35.Hsieh E, Fraenkel L, Han Y, Xia W, Insogna KL, Yin MT, Zhu T, Cheng X, Li T (2016) Longitudinal increase in vitamin D binding protein levels after initiation of tenofovir/lamivudine/efavirenz among individuals with HIV. AIDS 30(12):1935–1942. 10.1097/QAD.0000000000001131 [DOI] [PMC free article] [PubMed] [Google Scholar]
- 36.Havens PL, Long D, Schuster GU, Gordon CM, Price G, Wilson CM, Kapogiannis BG, Mulligan K, Stephensen CB (2018) Tenofovir disoproxil fumarate appears to disrupt the relationship of vitamin D and parathyroid hormone. Antivir Ther 23(7):623–628. 10.3851/IMP3269 [DOI] [PubMed] [Google Scholar]
- 37.Grant PM, Kitch D, McComsey GA et al. (2013) Low baseline CD4+ count is associated with greater bone mineral density loss after antiretroviral therapy initiation. Clin Infect Dis 57(10):1483–1488. 10.1093/cid/cit538 [DOI] [PMC free article] [PubMed] [Google Scholar]
- 38.Gea-Banacloche JC, Clifford Lane H (1999) Immune reconstitution in HIV infection. AIDS 13(Suppl A):S25–S38 [PubMed] [Google Scholar]
- 39.Hsieh E, Fraenkel L, Bradley EH, Xia W, Insogna KL, Cui Q, Li K, Li T (2014) Osteoporosis knowledge, self-efficacy, and health beliefs among Chinese individuals with HIV. Arch Osteoporos 9(1):201. 10.1007/s11657-014-0201-4 [DOI] [PMC free article] [PubMed] [Google Scholar]