

SUMMARY
BRAF is frequently mutated in human cancer and the RASopathy syndromes, with RASopathy mutations often observed in the cysteine-rich domain (CRD). Although the CRD participates in phosphatidylserine (PS) binding, the RAS-RAF interaction, and RAF autoinhibition, the impact of these activities on RAF function in normal and disease states is not well-characterized. Here, we analyze a panel of CRD mutations and show that they increase BRAF activity by relieving autoinhibition and/or enhancing PS binding, with relief of autoinhibition being the major factor determining mutation severity. Further, we show that CRD-mediated autoinhibition prevents constitutive plasma membrane localization of BRAF and increased RAS-dependent and RAS-independent function. Comparison of the BRAF- and CRAF-CRDs also indicates that the BRAF-CRD is a stronger mediator of autoinhibition and PS binding, and given the increased catalytic activity of BRAF, our studies reveal a more critical role for CRD-mediated autoinhibition in BRAF regulation.
Keywords: BRAF, CRAF, cysteine-rich domain, CRD, autoinhibition, phosphatidylserine, RAS, RASopathies
Graphical Abstract

eTOC Blurb
Spencer-Smith et al. demonstrate that RASopathy mutations in the BRAF cysteine-rich domain (CRD) increase BRAF biological activity by relieving autoinhibition and/or enhancing membrane binding. Importantly, they show that CRD-mediated autoinhibition is essential for preventing aberrant BRAF signaling, while the CRAF CRD plays a lesser role in autoinhibition and membrane binding.
INTRODUCTION
RAF family kinases (ARAF, BRAF, and CRAF) are primary effectors of the RAS GTPases and essential members of the pro-proliferative/anti-apoptotic RAS-ERK MAPK pathway. The RAFs can be divided into two functional domains: the C-terminal catalytic domain (CAT) and the N-terminal regulatory (REG) domain, the latter of which contains a conserved RAS binding domain (RBD), a cysteine-rich domain (CRD), and a serine/threonine rich region (Terrell and Morrison, 2019; Figure 1A). Under normal signaling conditions, RAF kinases cycle between three major states: 1) an autoinhibited, monomeric conformation that localizes to the cytosol (Cutler et al., 1998; Nan et al., 2013), 2) an activated, RAS-bound dimeric configuration at the plasma membrane (Freeman et al., 2013; Hu et al., 2013); and 3) a signaling-incompetent monomeric form that has been inactivated and released from the membrane via signal-induced feedback phosphorylation (Dougherty et al., 2005; Ritt et al., 2010). This regulatory cycle can be disrupted by mutational events to promote upregulated RAF signaling in human disease states, with somatic and germline mutations being causative for cancer and the developmental RASopathy syndromes, respectively (Schubbert et al., 2007). Although the vast majority of oncogenic RAF mutations occur in BRAF, driver mutations in the RASopathies are observed in both BRAF and CRAF (Hebron et al., 2022).
Figure 1. Identification of BRAF-CRD Mutations that Modulate PS Binding.
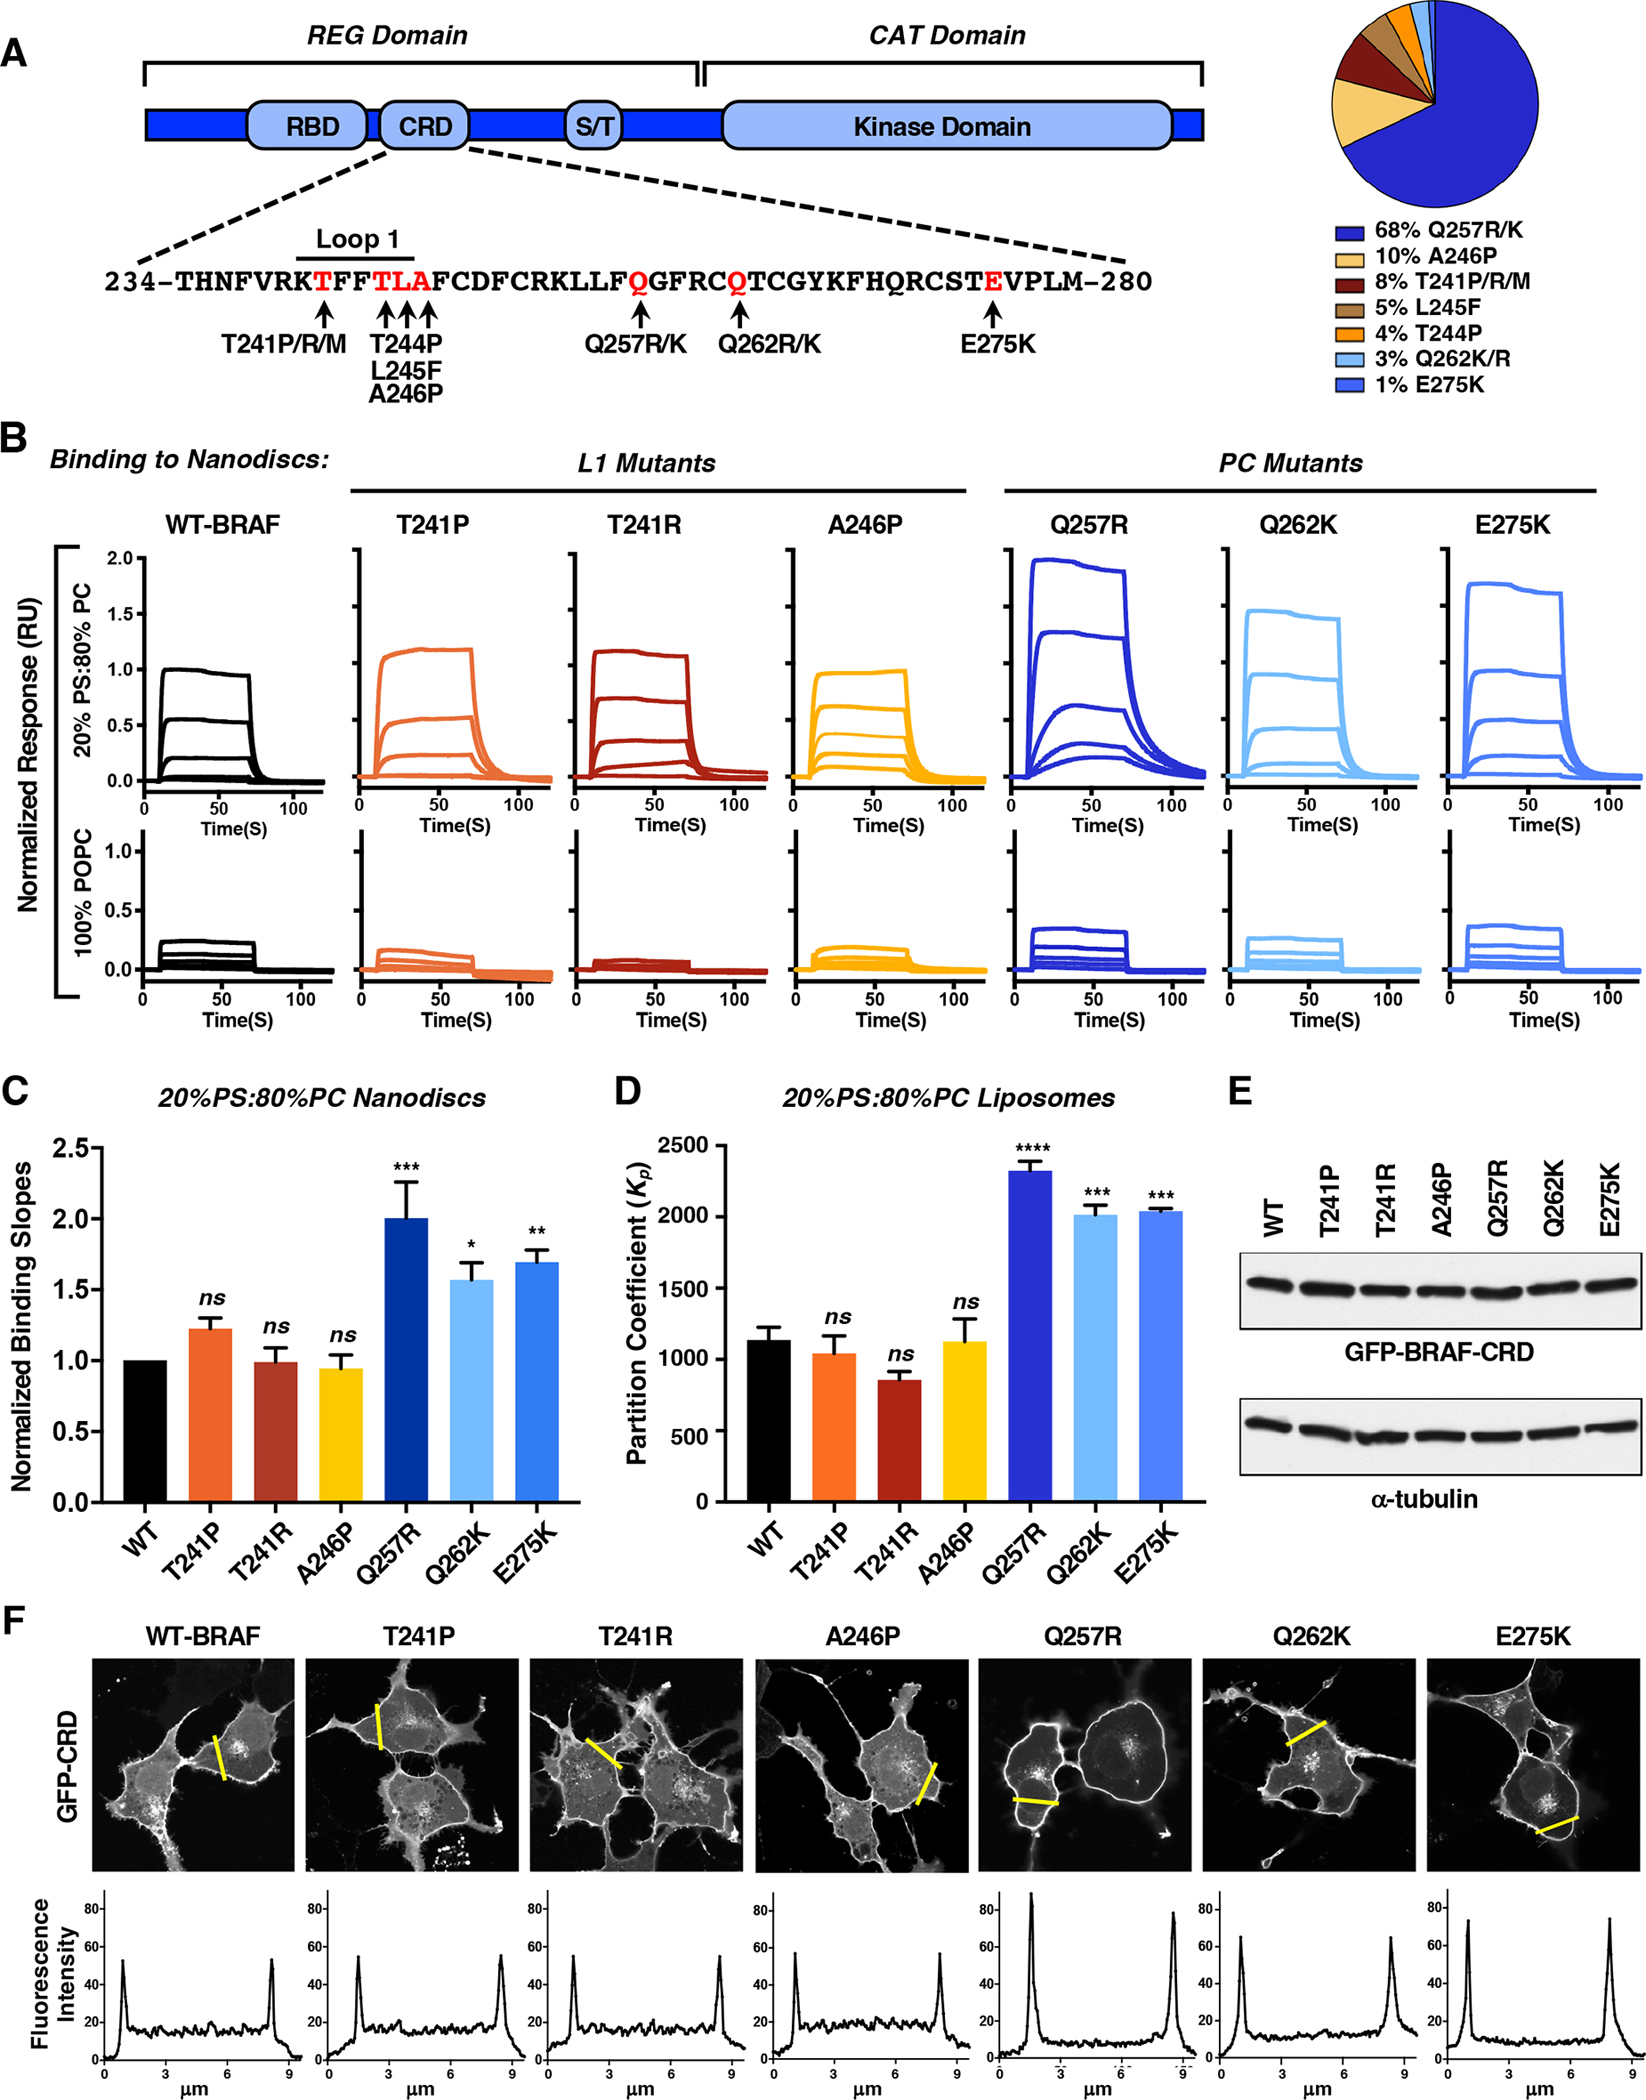
(A) BRAF domain structure and amino acid sequence of the CRD. Arrows indicate the RASopathy-associated mutations (left). The percent occurrence of a particular BRAF-CRD mutation is also shown (right). Data were collected from nseuronet.com.
(B) Binding responses of the BRAF-CRD variants to nanodiscs containing 20% POPS/80% POPC or 100% POPC were determined by SPR. Sensorgrams were normalized to the WT-BRAF-CRD binding response.
(C) Binding slopes of the CRD mutants were normalized to that of WT-CRD (with WT equaling 1). Graph represents the mean of 3 independent experiments ± SD.
(D) Partitioning coefficients for binding of the BRAF-CRDs to liposomes containing 20% POPS/80% POPC were determined, and the graph represents the mean of 3 independent experiments ± SD.
(E, F) Serum-starved COS-7 cells transiently expressing the GFP-CRD variants were examined by immunoblot analysis (E) and by confocal microscopy (F). A tracing depicting the GFP intensity in the area indicated by the yellow line is shown. The images are representative of 2 independent experiments with similar results.
For statistical analysis (C and D), student’s t-test (two-tailed, assuming unequal variance) was performed. ns, not significant; *, P < 0.05, P **, P < 0.01; ***, P < 0.001, and ****, P < 0.0001.
The RASopathies are a group of developmental disorders caused by germline mutations in components of the RAS-ERK/MAPK pathway (Rauen, 2013). These disorders, which include cardiofaciocutaneous (CFC), Costello, and Noonan syndromes, are characterized by distinct craniofacial abnormalities, developmental delays, cardiac defects, and an increased risk of certain childhood cancers (Tidyman and Rauen, 2016). With regard to the RAF kinases, RASopathy mutations in BRAF versus CRAF tend to occur in different regions of the proteins and are primarily associated with different RASopathy syndromes. In particular, germline alterations in BRAF are mainly associated with CFC (75% of CFC cases), and these mutations are most commonly observed either in the kinase domain (~62% of mutations) or the cysteine-rich domain (CRD; ~38% of mutations; Niihori et al., 2006; Rodriguez-Viciana et al., 2006).
CRDs (also known as C1 domains) are zinc-finger domains known to mediate lipid and protein interactions (Colon-Gonzalez and Kazanietz, 2006). The ligand binding interface of a CRD consists of two flexible loops (Loop 1 and 2) that contain hydrophobic residues able to insert into the membrane bilayer and basic residues that can interact with lipid head groups (Medkova and Cho, 1999; Xu et al., 1997). Characterization of the RAF-CRDs has indicated an interaction with both phosphatidylserine and RAS, which contributes to the stable plasma membrane recruitment of RAF and is required for RAS-driven ERK activation (Brtva et al., 1995; Daub et al., 1998; Ghosh et al., 1994; Hekman et al., 2002; Hu et al., 1995; Roy et al., 1997; Tran et al., 2021). The CRD has also been shown to play a prominent role in mediating the autoinhibitory effect of the RAF regulatory domain, which maintains RAF in an inactive state prior to signaling events. Indeed, mutation of the zinc-coordinating cysteine residues within the CRAF-CRD has been shown to prevent the regulatory domain from inhibiting the catalytic domain (Cutler et al., 1998; Winkler et al., 1998). More recently, cryoEM structures of inactive BRAF monomers have revealed that the CRD makes direct contact with both the kinase domain and a bound 14-3-3 dimer to stabilize the autoinhibited conformation (Martinez Fiesco et al., 2022; Park et al., 2019).
Taken together, these prior studies have established the complex role of the CRD as both a facilitator of RAS-RAF binding and RAF activation under signaling conditions and as a mediator of autoinhibition during quiescent conditions. However, the interplay between these opposing activities and their relative importance in modulating RAF function has not been well-characterized. Here, analysis of a panel of RASopathy-associated BRAF-CRD mutations provides key insights regarding BRAF regulation and reveals functional differences between RAF members that are relevant to the molecular etiology of the RASopathies.
RESULTS
Effect of BRAF-CRD Mutations on Phosphatidylserine Binding
RASopathy-associated mutations in the BRAF-CRD can be broadly divided into two groups – those that cluster around Loop 1 (hereon referred to as L1 mutations; Figures 1A and S1A) and those outside of Loop 1 that often introduce additional positively charged residues into the CRD (referred to as PC mutations), with Q257R being the most common CRD mutation (Figure 1A). To determine how the CRD mutations impact BRAF function, a panel of L1 (T241P, T241R, A246P) and PC (Q257R, Q262K and E275K) mutants were selected for investigation. Because a well-established property of the RAF-CRDs is their ability to interact with phosphatidylserine (PS), which contributes to the plasma membrane recruitment of RAF for kinase activation, we first examined the effect of the BRAF-CRD mutations on PS binding. For these experiments, surface plasmon resonance (SPR) was used to monitor the binding of purified WT or mutant CRD proteins (amino acids 232–284) to both nanodiscs and liposomes that contained PS (20% POPS/80% POPC). As expected, the WT-CRD demonstrated significant levels of binding to the PS-containing nanodiscs and liposomes (Figures 1B and S1B). No significant change in binding was observed for CRDs containing the L1 mutations. In contrast, CRDs containing the PC mutations displayed increased binding to PS-containing surfaces, with the Q257R-CRD demonstrating the highest level of interaction as reflected in the normalized binding curves for the nanodisc assays and in the partition coefficients for the liposome assays (Figures 1C and 1D). As a control, binding of the CRDs to nanodiscs and liposomes that lacked PS (100% POPC) was also evaluated, and for all the CRDs, binding was reduced ~80–97% (Figures 1B and S1B), demonstrating the preferential binding of the CRDs to lipid surfaces that contain PS. Finally, when the isolated CRD proteins were fused to GFP and their localization examined in COS-7 cells, the fusion proteins could be detected at the PS-containing cell periphery, and this localization correlated with the PS binding activity observed in the SPR analysis (Figures 1E and 1F).
Effect of BRAF-CRD Mutations on RAF Autoinhibitory Interactions
The CRD is also known to play a role in RAF autoinhibition, which must be relieved for kinase activation to occur. To assess RAF autoinhibition, a proximity-based NanoBRET assay (Machleidt et al., 2015) was developed in which RAF autoinhibitory interactions could be quantified under live cell conditions. When co-expressed as separate proteins, the isolated RAF regulatory (REG) domain can bind the catalytic (CAT) domain to suppress its signaling activity and that the autoinhibitory function of the REG domain has been shown to require an intact CRD (Chong and Guan, 2003; Cutler et al., 1998; Tran et al., 2005). Therefore, we generated expression constructs in which BRAFREG (residues 1–435) contained a Halo energy acceptor tag and BRAFCAT (residues 435–766) was fused to a NanoLuc energy donor tag. When co-expressed in 293FT cells, BRAFREG-Halo was found to interact with Nano-BRAFCAT, as evidenced by energy transfer and the generation of a BRET signal (Figure 2A). In addition, BRAFREG-Halo could suppress MEK phosphorylation induced by Nano-BRAFCAT in a manner that was dose-dependent and correlated with an increased BRET signal (Figures 2A and 2B). The NanoBRET assay was also able to detect a relief in autoinhibitory interactions driven by the potent RAF activator, KRASG12V and by the BRAFCAT mutation V600E (Figure 2C), confirming the validity of the NanoBRET assay as a measure of autoinhibitory interactions.
Figure 2. Identification of BRAF-CRD Mutations that Modulate RAF Autoinhibitory Interactions and RAS-RAF Binding in Live Cells.

(A) NanoBRET interaction assay showing the BRET signal generated when increasing amounts of WT-BRAFREG-Halo were co-transfected with a constant amount of Nano-WT-BRAFCAT. Bars indicate the mean of quadruplicate wells from 3 independent assays ± SD.
(B) Lysates of 293FT cells transiently expressing Nano-WT-BRAFCAT alone or with increasing amounts of WT-BRAFREG-Halo were examined by immunoblot analysis for BRAFREG, BRAFCAT, and pMEK levels. Blots are representative of 3 independent experiments with similar results.
(C) NanoBRET assay measuring the interaction of WT or mutant BRAFREG-Halo proteins and Nano-WT-BRAFCAT. Also shown, is the effect of co-expressing HA-tagged KRASG12V or Nano-V600E-BRAFCAT. Data points represent BRET signals (normalized to WT set at 100) of quadruplicate wells from 3 independent assays ± SD. Student’s t-test (two-tailed, assuming unequal variance) was performed. ns, not significant and ****, P < 0.0001. Cell lysates were also examined by immunoblot analysis for BRAFREG, BRAFCAT, and HA-KRAS levels.
(D) Cryo-EM structure of autoinhibited BRAF, showing the CRD (magenta), the BRAF catalytic domain (blue), and a bound 14-3-3 dimer (yellow). CRD residues mutated in the RASopathies are annotated (PDB: 6NYB).
(E) BRET saturation curves examining the interaction of WT or mutant BRAFFL-RLuc8 proteins with Venus-KRASG12V. BRETmax and BRET50 values are listed ± SEM. Saturation curves were repeated 3 times with similar results.
Striking, when the various CRD mutations were introduced into BRAFREG, we found that all L1 mutations, along with PC mutations Q257R and Q262K, caused a significant reduction in the BRET signal, reflecting reduced binding to BRAFCAT (Figure 2C). In contrast, the E275K mutation, which resulted in enhanced PS binding, had no effect on BRAFCAT interactions (Figure 2C), indicating that increased PS binding alone is not sufficient to relieve autoinhibition. These findings are in agreement with recent cryo-EM structures of autoinhibited BRAF complexes bound to 14-3-3 (Martinez Fiesco et al., 2022; Park et al., 2019), which show that the PS binding interface of the CRD is occluded in the autoinhibited state and that all of the analyzed CRD mutations, with the exception of E275K, occur in or adjacent to residues that contact the BRAF CAT domain and/or 14-3-3 to maintain the autoinhibited conformation (Figure 2D).
Effect of BRAF-CRD Mutations on RAS-RAF binding
Next, experiments were conducted to determine whether the CRD mutations alter the ability of BRAF to interact with activated RAS. Due to the key role of the plasma membrane in both CRD and RAS function, the RAS-RAF interaction was evaluated in the context of an intact lipid bilayer using a traditional live-cell BRET assay that had previously identified KRAS as the predominant BRAF binder (Terrell et al., 2019). For these studies, full-length BRAF tagged with Rluc8 (BRAFFL-RLuc8) served as the energy donor and Venus-tagged KRASG12V functioned as the energy acceptor (Venus-KRASG12V). In addition, saturation curves were generated such that the BRETmax (the maximal level of RAS binding) and BRET50 (the relative affinity of the interaction) could be determined.
As expected, WT-BRAFFL generated a strong BRET signal that was dramatically reduced by incorporation of the RBD R188L mutation that disrupts RAS binding (Figure 2E). Analysis of the CRD mutants revealed that proteins containing mutations that relieve autoinhibition generated a BRETmax signal that was increased ~65% over that observed for WT (Figure 2E). In contrast, the E275K mutation, which enhances PS binding but does not relieve autoinhibition, resulted in a markedly weaker increase in the BRETmax signal (~15%). Interestingly, all of the CRD mutants, including E275K, exhibited an increase in the affinity of the KRAS interaction (lower BRET50 values), with the PC mutants having the lowest BRET50 values (Figure 2E), suggesting that the PS binding activity of the BRAF-CRD may impact the affinity of KRAS binding. Indeed, when the BRET assays were conducted using the isolated BRAFREG domain, where autoinhibitory contact with the CAT domain would not be a factor, the CRD L1 mutants generated BRET signals that were equivalent to WT-BRAFREG in terms of both the BRETmax and BRET50 values (Figure S2). In contrast, an elevated level and affinity of RAS binding was observed for the PC mutants that correlated with the effect of these mutations on PS binding (Q257R>E275K>Q262K; Figure S2).
All BRAF-CRD Mutants Require RAF Dimerization for Their Enhanced Signaling Activity but Differ in Their Dependence on RAS Binding
The above results indicate that the BRAF-CRD mutations vary in their effects on RAF autoinhibition as well as PS and RAS binding, with the L1 mutations causing a relief in autoinhibition (which we refer to as Class A; Table S1), the PC Q257R and Q262K mutations both relieving autoinhibition and increasing PS binding (Class B), and the PC E275K mutation only causing enhanced PS binding (Class C). Moreover, relief of autoinhibition alone was sufficient to increase the overall levels of RAS-RAF binding in live cells, whereas enhanced PS binding correlated with an increase in the affinity of the interaction, either by stabilizing membrane interactions and/or facilitating direct CRD-RAS contact. To determine how these differing effects influence the signaling activity of BRAF, full-length BRAF proteins containing the CRD mutations were evaluated in focus forming assays using NIH-3T3 cells. In contrast to WT-BRAFFL, all of the CRD mutants were able to induce focus formation (Figures 3A and S3A), with proteins containing mutations that relieve autoinhibition (Class A and B) being significantly more transforming than the E275K mutant (Class C). The Class A and B mutants were also more effective at promoting MEK phosphorylation in NIH-3T3 cells than was E275K-BRAFFL (Figure 3B).
Figure 3. Effect of BRAF-CRD Mutations on the Signaling Activity and Plasma Membrane Localization of BRAF.
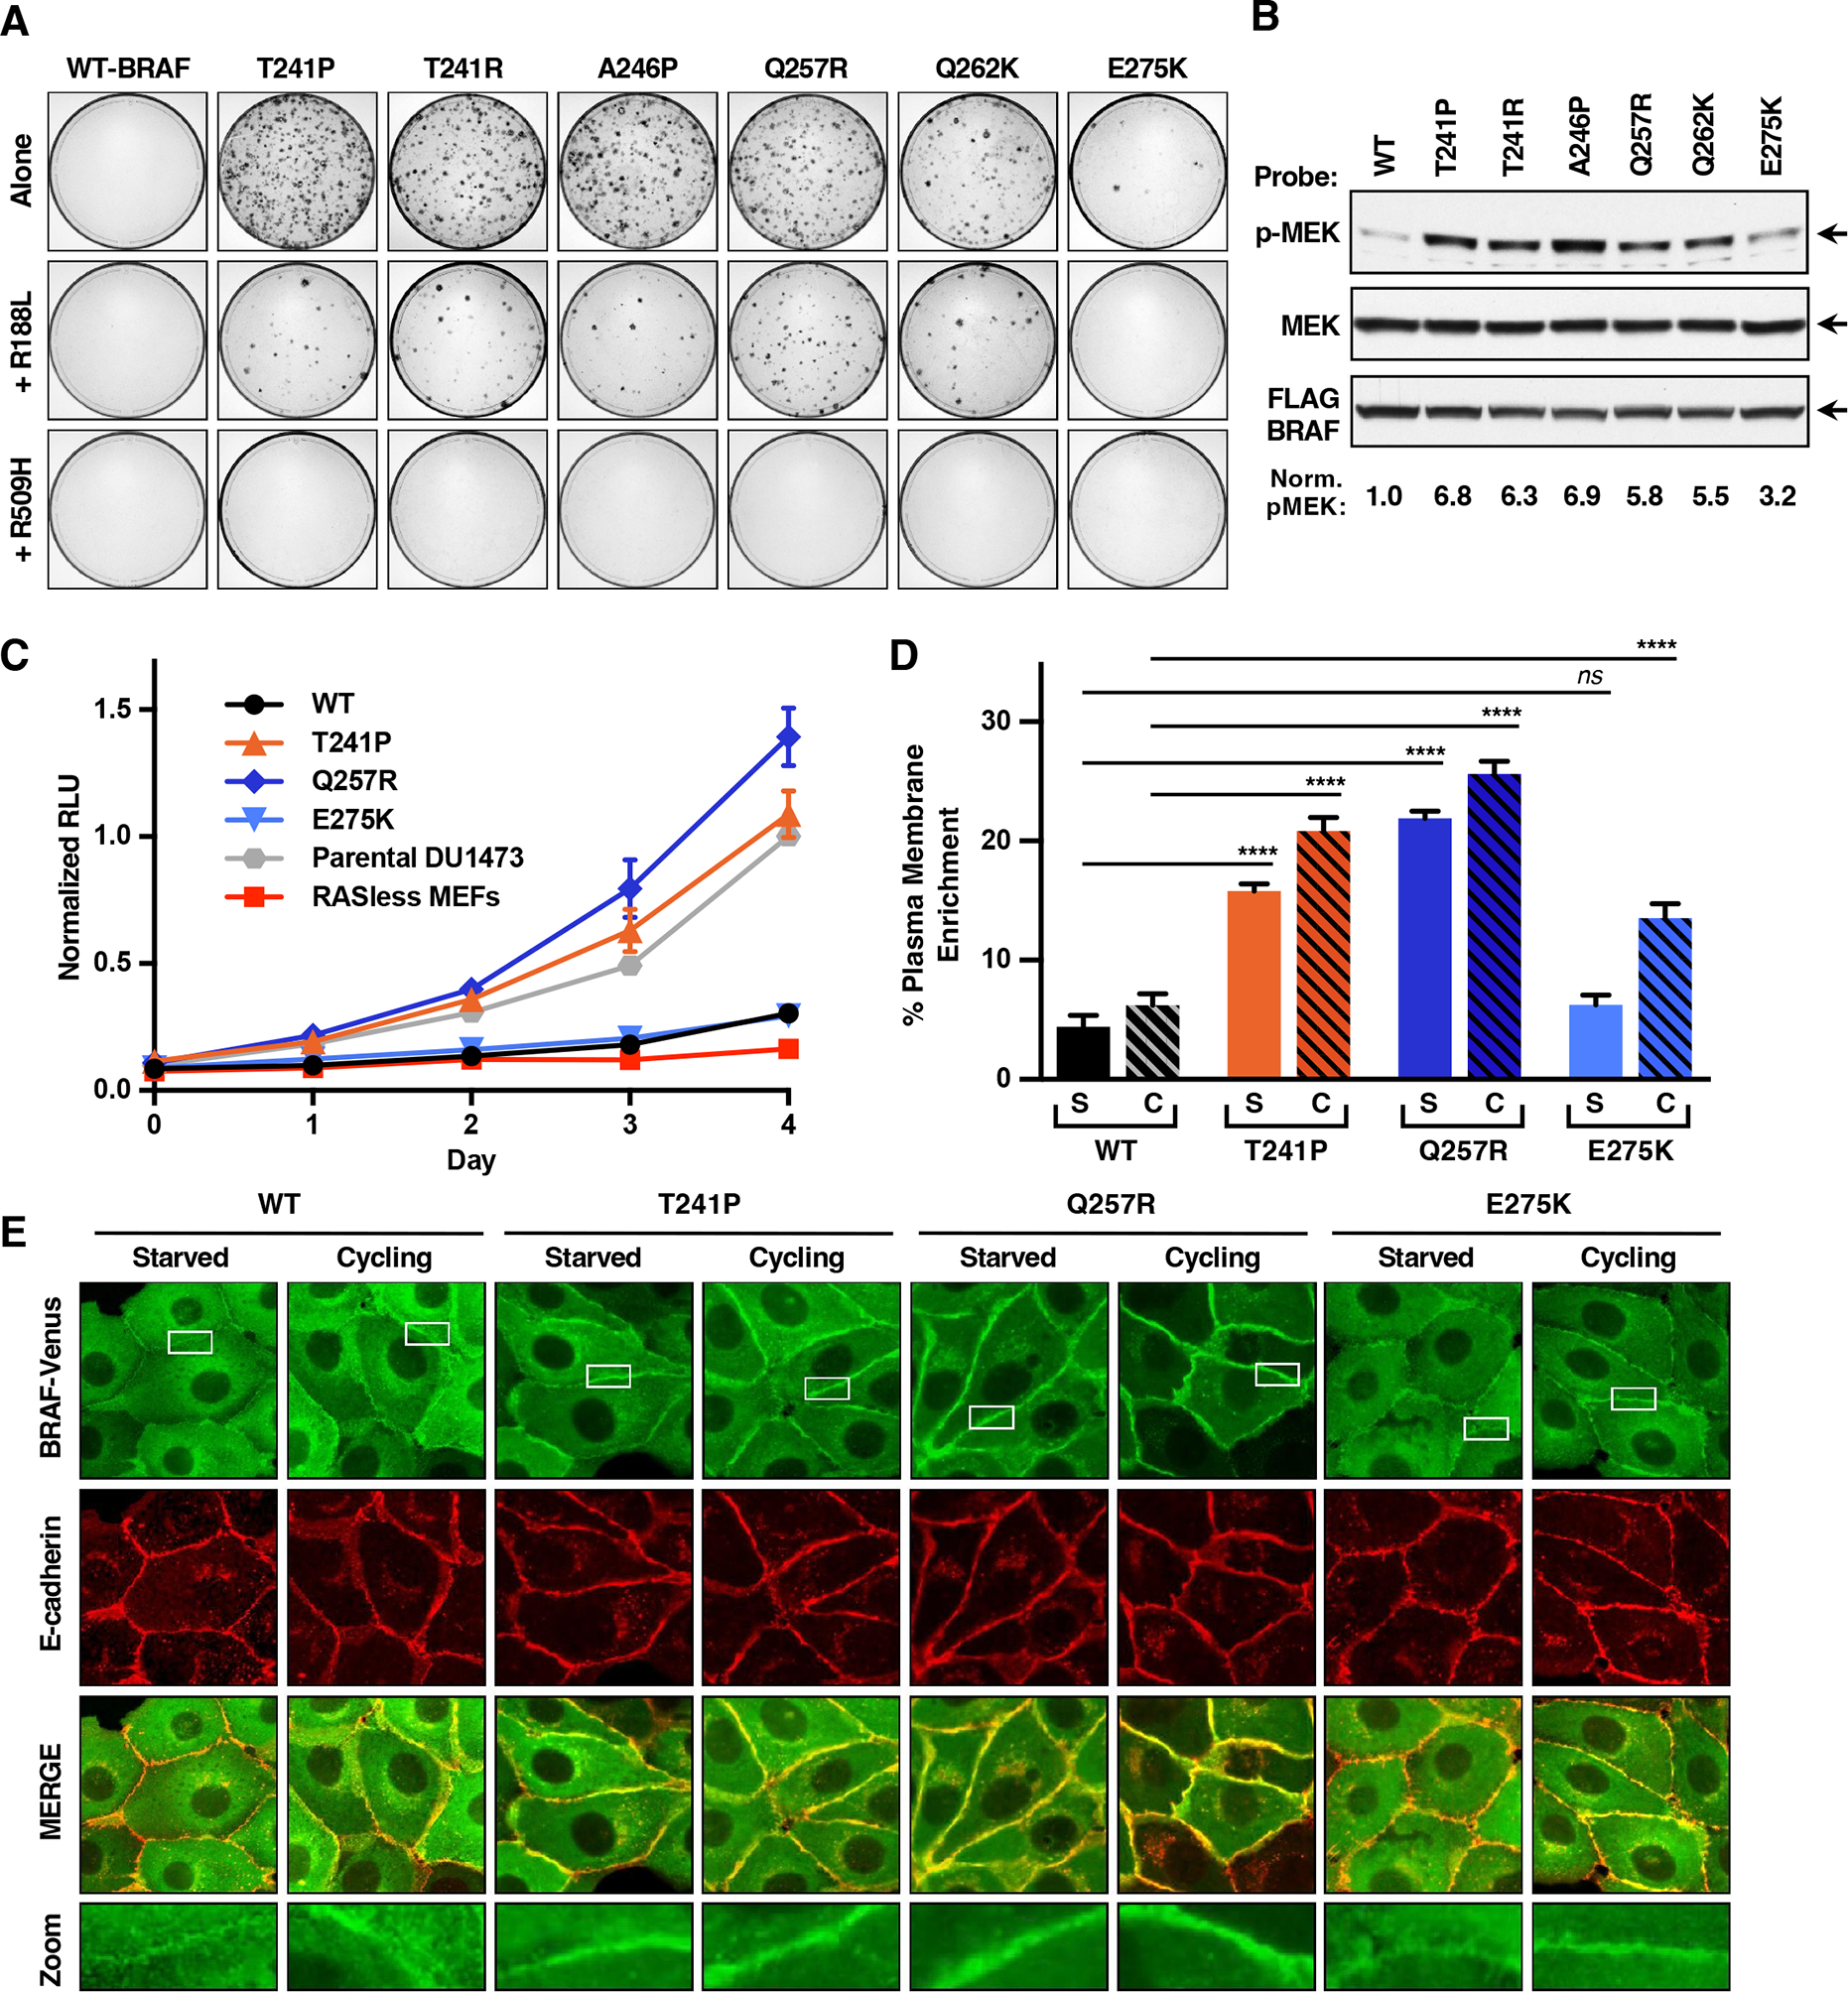
(A) NIH-3T3 cells were infected with retroviruses encoding the indicated FLAG-BRAFFL proteins. Foci were visualized by methylene blue staining 3 weeks post-infection. Assays were repeated 3 times with similar results.
(B) Lysates of serum-starved NIH-3T3 cells expressing the indicated FLAG-BRAFFL proteins were examined for pMEK, FLAG-BRAFFL, and total MEK levels. Blots are representative of 3 independent experiments with similar results.
(C) The proliferation rate of RAS-deficient MEF lines stably expressing the indicated FLAG-BRAFFL proteins is shown. Data points represent the mean of quadruplicate wells from 2 independent experiments ± SEM.
(D and E) MDCK cells stably expressing the indicated BRAFFL-Venus variants were left in growth media or serum-starved. Percent plasma membrane enrichment of BRAFFL (D) was calculated from fluorescence traces of n=20 cells ± SEM that were imaged by confocal microscopy (E). Imaging studies were repeated 3 times with similar results.
Additional studies revealed that the focus forming activity of the CRD mutants was dependent on RAF dimerization as incorporation of the R509H mutation to disrupt dimerization prevented foci formation in all cases (Figures 3A and S3A). However, the importance of RAS binding appeared more variable in that when the RBD R188L mutation was introduced, proteins containing the Class A and B mutations, which disrupt autoinhibition, retained 20–40% of their focus forming activity even in the absence of an intact RBD, with Q257R/R188L-BRAFFL exhibiting the highest level of activity. In contrast, when the R188L mutation was introduced into the Class C E275K mutant, no foci were observed (Figure 3A).
To further assess the contribution of RAS to the signaling activity of the CRD variants, cell proliferation studies were conducted using RAS-deficient mouse embryo fibroblasts (MEFs) that stably expressed WT-BRAF or a representative of each of the CRD mutant classes: T241P (Class A), Q257R (Class B), or E275K (Class C) (Figure S3B). As shown in Figure 3C, RAS-deficient MEFs overexpressing WT-BRAFFL or the E275K mutant displayed minimal proliferation. In contrast, cells expressing T241P- or Q257R-BRAFFL, whose mutations relieve autoinhibition, exhibited proliferation rates similar to or higher than that observed for the parental KRAS-expressing DU1473 MEF line (Figure 3C), suggesting that relief of autoinhibition allows these mutants to promote cell growth in the absence of canonical RAS proteins.
Next, we examined how the different CRD mutation classes affect the subcellular localization of BRAF. For these studies, stable MDCK lines that express WT, T241P (Class A), Q257R (Class B), or E275K (Class C) BRAFFL-Venus-tagged proteins (Figure S3C) were generated and examined under serum-starved or cycling growth conditions. The cells were imaged via confocal microscopy, and the plasma membrane enrichment of the various BRAFFL-Venus proteins was determined using E-cadherin as a plasma membrane marker. Under serum-starved conditions, where RAS-GTP levels would be low, WT-BRAFFL exhibited primarily a perinuclear/cytosolic localization with minimal levels detected at the plasma membrane (Figures 3D and 3E). A similar localization was observed for E275K-BRAFFL, whose mutation only enhances PS binding (Figure 3D and 3E). However, T241P- and Q257R-BRAFFL, whose mutations relieve autoinhibition, displayed a 3.6 and a 5-fold enrichment at the plasma membrane, respectively. Interestingly, under cycling conditions where RAS-GTP levels would be elevated, the plasma membrane localization of all the CRD mutants, including E275K-BRAFFL, was significantly increased over WT levels (Figures 3D and 3E). Taken together, the above data suggest that relief of CRD-mediated autoinhibition alone is sufficient to increase the pool of BRAF at the plasma membrane to levels needed for cell signaling and is similar to the RAS-independent behavior observed for membrane-localized RAF-CAAX proteins (Leevers et al., 1994; Stokoe et al., 1994).
BRAF-CRD Mutations Increase the Biological Activity of BRAF in Zebrafish Embryos
To investigate the effects of the CRD mutations on BRAF function in a developing organism, the zebrafish model system was used, as expression of RASopathy mutants has been shown to induce defects in zebrafish embryos similar to those observed in RASopathy patients, including alterations in heart and craniofacial structures (Patterson and Burdine, 2020). In addition, monitoring the effects of RASopathy mutants on early convergent-extension cell movements, which results in elongated embryos with an abnormal axis ratio, has been used to assess mutation severity (Jindal et al., 2017). As with the above experiments, WT-BRAF and a representative of each of the three CRD mutant classes was examined. In convergent extension assays, expression of the T241P (Class A) or Q257R (Class B) mutants had a more significant effect on the embryo axis ratio than did the Class C E275K-BRAF (Figure 4A). In addition, when embryos were examined 3 days post-fertilization 26–30% of embryos expressing the Q257R or T241P mutants developed heart edema, whereas less than 10% of those expressing E275K-BRAF displayed this phenotype (Figure 4B). Finally, the effect of the CRD mutants on craniofacial structures was determined by measuring the angle of the ceratohyal, which corresponds to the width and bluntness of the head and is an excellent marker for hypertelorism, a common feature of RASopathy patients. Using the transgenic Tg (col2a1aBAC:GFP) (Askary et al., 2015) zebrafish line to visualize cartilage cells, we found that expression of either the T241P or Q257R mutant caused a significant increase in the angle of the ceratohyal, whereas expression of the E257K mutant did not (Figure 4C). These embryo assays and the above signaling experiments indicate that E275K is a weaker gain-of-function mutation, a finding consistent with the phenotypic analysis of a CFC patient possessing this mutation and does not exhibit characteristics frequently observed in CFC patients with BRAF-CRD mutations, such as hypertelorism, short stature, or mental retardation (Sarkozy et al., 2009). Notably, these findings further suggest that relief of autoinhibition is the primary factor determining the severity of the BRAF-CRD mutations.
Figure 4. BRAF-CRD Mutants Induce Developmental Alterations in Zebrafish Embryos.

(A) mRNA encoding the indicated Venus-tagged BRAF proteins were injected into one-cell stage zebrafish embryos and the embryo axes were measured at 11 hrs post-fertilization (hpf). Representative images of the embryos and expression of the BRAF-Venus proteins (green) are shown, as is the average axis ratio of embryos analyzed in 3 independent experiments ± SEM. The average axis ratio of uninjected embryos is 1 ± SEM 0.005.
(B) Embryos injected as in (A) are shown 3 days post-fertilization (dpf) with normal and endemic hearts (left). The graph represents the percentage of embryos with heart edema in 3 independent experiments ± SEM (right).
(C) One-cell stage embryos from the Tg (col2a1aBAC:GFP) transgenic line were injected as in (A). At 5dpf, the ceratohyal angle was determined (left, dotted red line). The graph represents the quantification of the angle of the ceratohyal from 4 independent experiments ± SEM. Average ceratohyal angle for uninjected embryos is 59° ± SEM 3°.
(D) Summary of phenotypic characteristics of RASopathy patients with BRAF-CRD mutations. Data were collected from nseuronet.com and references are cited in Table S2.
For statistical analysis (A-C), one-way analysis of variance (ANOVA) with Bonferroni correction was used. ns, not significant; *, P < 0.05, P **, P < 0.01; ***, P < 0.001, and ****, P < 0.0001.
The CRDs of BRAF and CRAF Differ in Their Ability to Bind PS
The CRD is a hotspot for RASopathy-associated mutations in BRAF but not CRAF, despite reports that the CRAF-CRD also plays a role in autoinhibition as well as PS and RAS binding (Cutler et al., 1998; Improta-Brears et al., 1999; Tran et al., 2021; Travers et al., 2018). Therefore, studies were initiated to compare the relative ability of the BRAF- and CRAF-CRDs to perform these functions. Through SPR analysis, we found that the CRAF-CRD exhibited specific binding to PS-containing nanodiscs; however, the level of binding was ~30% of that observed for the BRAF-CRD (Figures 5A, 5B and S4). Consistent with the SPR analysis, when the isolated CRD proteins were fused to GFP and their localization examined in COS-7 cells, the BRAF-CRD was clearly visible at the cell periphery, whereas the isolated CRAF-CRD was observed primarily in the cytosol and nucleus (Figure 5C). Of note, the nuclear localization of the GFP-CRD is likely due to its small size (33.8 kDa), which would permit diffusion into the nucleus as has been reported for the PKC CRD (Oancea et al., 1998; Verbeek et al., 2008).
Figure 5. The CRDs of BRAF and CRAF Differ in Their Abilities to Bind PS.

(A) The indicated BRAF- and CRAF-CRD proteins were examined by SPR for binding to PS-containing nanodiscs. Sensorgrams were normalized to the WT-BRAF-CRD binding response.
(B) Binding slopes for the CRAF-CRD and the indicated CRD mutants were normalized to the binding slope of the BRAF-CRD (with BRAF-CRD equaling 1). The graph represents the mean of 3 independent experiments ± SD. Student’s t-test (two-tailed, assuming unequal variance) was performed. ns, not significant and ***, P < 0.001.
(C) Serum-starved COS-7 cells transiently expressing the indicated GFP-CRD proteins were examined by immunoblot analysis and confocal microscopy. A tracing depicting the GFP intensity in the area indicated by the yellow line is shown. The images are representative of 2 independent experiments with similar results.
(D, E) Electrostatic surface representation of the BRAF-CRD (PDB: 6NYB) and CRAF-CRD (PDB: 1FAR) structures are shown, with blue and red representing positively and negatively charged areas, respectively, and key residues indicated.
See also Figure S4.
To ascertain the residues responsible for the differing PS binding activities of the BRAF and CRAF-CRDs, we examined the subcellular localization of a series of GFP-tagged CRD proteins in which non-conserved residues between the BRAF and CRAF-CRDs had been exchanged. From this analysis, four BRAF residues (F250, R252, Q270, and R271) were identified that when substituted for the equivalent residues in the CRAF-CRD (4MUT-CRAF, I154F Q156R, E174Q, and H175R) resulted in an enhanced cell surface localization that was comparable to the BRAF-CRD (Figure 5C). Likewise, when the equivalent residues of CRAF were swapped into the BRAF-CRD (4MUT-BRAF), the 4MUT-BRAF-CRD localized in a manner similar to the CRAF-CRD (Figure 5C). SPR analysis confirmed that these localizations correlated with the PS binding activity of the CRDs and that the PS binding activity of the BRAF- and CRAF-CRD could largely be reversed by exchanging these four non-conserved residues (Figures 5A–C and S4B). Interestingly, surface charge comparisons of the RAF-CRD structures revealed that the four non-conserved residues determining the affinity of PS binding localize to the top surface of the CRD that contains the hydrophobic pocket formed by the L1 loop (Figure 5D). The CRAF residue E174 adds an acidic amino acid to this region, which would be repulsive in the context of the negatively charged plasma membrane, whereas the BRAF residues R252 and R271, together with the conserved lysine at K253, form a positively charged patch that would be conducive for increased binding to the negatively charged head groups of PS. Moreover, the RASopathy PC mutations would place additional basic residues adjacent to (Q257R and E275K) or slightly below (Q262K) this surface (Figure 5E).
The BRAF-CRD is a More Potent Mediator of Autoinhibition Than is the CRAF-CRD
To compare the autoinhibitory activities of the BRAF and CRAF-CRDs, a BRAFREG construct in which the BRAF-CRD was replaced with that of CRAF was generated, following which the ability of the C-CRD-BRAFREG to interact with the BRAFCAT domain was monitored using the NanoBRET assay. In comparison to BRAFREG, the BRET signal generated by C-CRD-BRAFREG was significantly lower, indicating a reduced ability to mediate autoinhibitory interactions (Figure 6A). When similar constructs were generated to evaluate CRAF autoinhibition, an interaction between the CRAFREG and CRAFCAT domains was observed, but the BRET signal generated was lower than that observed for the BRAF domains (Figure 6A). However, when the CRAFREG construct contained the BRAF-CRD, the BRET signal increased approximately 40%. In addition, when the BRAFREG proteins were evaluated for binding to CRAFCAT and vice versa, similar results were observed (Figure 6A). These findings confirm that the BRAF-CRD is a more potent mediator of autoinhibition and that this increased activity is not determined by differences in the BRAF versus CRAF catalytic domains.
Figure 6. The BRAF- and CRAF-CRDs Differ in Their Abilities to Mediate Autoinhibition.

(A) NanoBRET interaction assay showing the BRET signal generated when the indicated RAFREG-Halo constructs were co-transfected with Nano-WT-BRAFCAT (left) or Nano-WT-CRAFCAT (right). Cell lysates were also examined by immunoblot analysis for RAFREG and RAFCAT proteins levels. Data points represent quadruplicate wells from 3 independent experiments ± SD.
(B) BRET saturation curves examining the interaction of WT or C-CRD-BRAFFL-RLuc8 proteins with Venus-KRASG12V. BRETmax and BRET50 values are listed ± SEM. Saturation curves were repeated 3 times with similar results.
(C) NIH-3T3 cells were infected with retroviruses encoding the indicated FLAG-BRAFFL variants. Foci were visualized by methylene blue staining 3 weeks post-infection. Assays were repeated 2 times with similar results.
(D) NanoBRET assay measuring the interaction of WT- or mutant BRAFREG-Halo proteins and Nano-WT-BRAFCAT. Cell lysates were also examined by immunoblot analysis for BRAFREG and BRAFCAT levels. Data points represent quadruplicate wells from 3 independent experiments ± SD. Proximity of the BRAF-CRD residue T244 (magenta) and the BRAF catalytic domain residue R719 (blue) is also shown (PDB: 6NYB). For (A, D), student’s t-test (two- tailed, assuming unequal variance) was performed. ns, not significant and ****, P < 0.0001.
See also Table S3.
Next, we examined the effect of exchanging the CRAF-CRD for that of BRAF on binding between full-length BRAF and activated KRAS using our traditional BRET assay. Consistent with the lower PS binding activity of the CRAF-CRD, the affinity of the RAS-RAF interaction was reduced for C-CRD-BRAFFL, whereas the overall levels of RAS-RAF binding were higher than that observed for WT-BRAFFL and correlated with the reduced autoinhibitory activity of the CRAF-CRD (Figure 6B). Strikingly, in focus forming assays, C-CRD-BRAFFL, but not WT-BRAFFL, was able to transform NIH-3T3 cells (Figure 6C), thus demonstrating the critical role of the BRAF-CRD in maintaining BRAF in an autoinhibited, non-signaling state.
Because both the PS binding and autoinhibitory activities of the BRAF-CRD were elevated in comparison to the CRAF-CRD, we next examined whether the four non-conserved BRAF residues identified to mediate increased PS binding might also be responsible for the elevated autoinhibitory activity. Using the NanoBRET assay, 4MUT-BRAFREG showed no impairment in mediating autoinhibitory interactions with BRAFCAT (Figure 6D), indicating that these residues are not critical for autoinhibition. Through the analysis of a series of BRAFREG proteins in which non-conserved residues between the BRAF and CRAF-CRDs were exchanged, a single residue swap in L1, T244K (K149 in CRAF), was found to reduce interactions between the BRAFREG and BRAFCAT domains to a level observed with C-CRD-BRAFREG (Figure 6D; Table S3). Interestingly, in the autoinhibited structure of the BRAF monomer, T244 lies in close proximity to R719 in the BRAF catalytic domain (Martinez Fiesco et al., 2022; Park et al., 2019) and placement of a lysine residue at position 244 would likely generate repulsive forces with R719, thereby destabilizing the autoinhibitory contacts of the CRD (Figure 6D). Finally, when the effect of the T244K substitution was examined in focus forming assays, we found that T244K-BRAFFL, but not 4MUT-BRAFFL, was as transforming as C-CRD BRAFFL (Figure 6C).
Analysis of CRAF Proteins Containing Mutations Analogous to the RASopathy BRAF-CRD Mutations
The basal catalytic activity of BRAF is significantly higher than that of CRAF, due primarily to the constitutive negative charge of a region in the BRAF kinase domain known as the negative charge regulatory region or N-region (Emuss et al., 2005; Marais et al., 1997). Therefore, it is possible that the enhanced autoinhibitory activity of the BRAF-CRD may be specifically required to quell the high basal catalytic activity of BRAF and may explain why the CRAF-CRD is not a mutational hotspot in the RASopathies. To investigate this possibility, constructs expressing full-length CRAF that contained CRD mutations equivalent to T241P, Q257R, and Q262K (CRAF T145P and N161R, and Q166K) were generated and examined for their focus forming potential. As shown in Figure 7A, none of these mutants could induce foci. However, when the N-region of these CRAF mutants was changed to that of BRAF, conferring high basal catalytic activity (Figure 7B), the CRAF-CRD mutants were now transforming (Figure 7A). Moreover, CRAF proteins containing only the BRAF N-region sequences were also weakly transforming, consistent with elevated catalytic activity of the hybrid protein and the reduced autoinhibitory activity of the CRAF-CRD. These findings suggest that the CRD and autoinhibition play a more important role in BRAF regulation, functioning to maintain BRAF in an inactive state during non-signaling conditions.
Figure 7. Analysis of CRAF Proteins Containing Mutations Analogous to RASopathy-associated BRAF-CRD Mutations.

(A) NIH-3T3 cells were infected with retroviruses encoding the indicated WT or mutant FLAG-CRAFFL proteins. Foci were visualized by methylene blue staining 3 weeks post-infection. Assays were repeated 3 times with similar results.
(B) In vitro kinase assays demonstrating the increased catalytic activity of FLAG-CRAFFL containing the N-region sequence of BRAF (N-region swap) versus WT-FLAG-CRAFFL (with WT activity equaling 1). Data represent the mean of duplicate samples from 3 independent experiments ± SD. Student’s t-test (two-tailed, assuming unequal variance) was performed. ****, P < 0.0001.
(C) Model comparing the properties of the BRAF- and CRAF-CRDs. See text for details.
DISCUSSION
Early investigation of the RAF kinases demonstrated the role of the CRD in PS binding, the RAS-RAF interaction, and autoinhibition; however, the relative interplay between these activities and their importance for RAF regulation and function have not been well explored. In this study, we analyzed a panel of RASopathy-associated BRAF-CRD mutations for their effect on these known activities of the CRD using a variety of approaches, including the use of a BRET-based assay to quantify RAF autoinhibitory interactions under live cell conditions. In addition, we examined the impact of these mutations on the biological function of BRAF in cell culture systems and zebrafish embryos, and we compared the properties of the BRAF-CRD with those of the CRAF-CRD. Through this analysis, we find that the BRAF-CRD is a stronger mediator of both PS binding and autoinhibition than is the CRAF-CRD and that the RASopathy-associated BRAF-CRD mutations can be classified into three functional groups: Class A, causing relief in autoinhibition; Class B, relieving autoinhibition and enhancing PS/plasma membrane binding; and Class C, enhancing PS/membrane binding alone.
Strikingly, the ability of the mutations to alter distinct activities of the CRD was found to have direct consequences on BRAF subcellular localization, RAS binding properties, and the degree of RAS-dependency for signaling activity. For example, analysis of the BRAF-CRD mutants revealed that relief of autoinhibition alone was sufficient to robustly increase the overall levels of RAS-RAF binding, whereas enhanced CRD-PS binding contributed to the affinity of the RAS-RAF interaction, either through membrane interactions or facilitating direct RAS contact. In addition, the CRD mutants with impaired autoinhibitory activity (Class A and B) displayed an increased presence at the plasma membrane even in serum-starved conditions and exhibited a level of RAS-independent activity. In contrast, the Class C E257K mutant, which is unimpaired for autoinhibition, was fully dependent on RAS for its signaling function. Moreover, in serum-starved cells, both the WT and E275K-BRAF proteins were found primarily in the cytoplasm, and only under cycling conditions where RAS-GTP levels would be elevated, did E275K-BRAF exhibit a plasma membrane localization that was significantly increased over WT, consistent with the enhanced PS binding activity of this mutant.
With regard to the analysis of the CRD mutant proteins in the zebrafish model system, the Class A and B mutants were also found to cause more pronounced developmental defects than did the Class C E275K mutant. It is interesting to note that the evaluation of one RASopathy patient with the Class C E275K mutation has been reported, and this patient does not display several attributes reported for all patients possessing Class A T241P and Class B Q257R mutations, such as hypertelorism, short stature, and development delays (Sarkozy et al., 2009), suggesting that relief of autoinhibition is the primary factor determining the phenotypic severity of these mutations. Further, the NanoBRET autoinhibition assay and the functional assays described here may be particularly useful in predicting the severity of new BRAF-CRD mutations as they are identified through various genomic sequencing projects.
In terms of BRAF regulation, our findings indicate that for WT-BRAF and the Class C E275K mutant, RAS binding is needed to disrupt the autoinhibited state, which in turn, would expose the ligand binding interface of the CRD for contact with the plasma membrane and RAS, a model supported by a recent cryo-EM structure showing that in autoinhibited BRAF:14-3-32 complexes, the RAS binding interface of the RBD is largely exposed, whereas the ligand binding interface of the CRD is occluded (Martinez Fiesco et al., 2022). In contrast, the Class A and B mutations relieve CRD-mediated autoinhibition themselves, and this property together with the high PS binding activity of the BRAF-CRD, allows these mutants to constitutively localize to the plasma membrane at a level that may facilitate self-dimerization and kinase activation, similar to the RAS-independent behavior observed for membrane-localized RAF-CAAX proteins (Leevers et al., 1994; Stokoe et al., 1994). This model also provides an explanation for why the Q257R mutant, whose mutation relieves autoinhibition and causes the largest increase in PS and plasma membrane binding, exhibited the highest level of RAS-independent activity. However, despite its enhanced RAS-independent activity, when RAS was present, the signaling and biological activity of Q257R-BRAF was not elevated in comparison to the Class A mutants, which only have impaired autoinhibitory activity. Insight as to why this might be the case comes from published structures of the CRAF RBD-CRD bound to KRAS and modeling of this complex at the plasma membrane (Tran et al., 2021; Travers et al., 2020; Travers et al., 2018). More specifically, these studies suggest that the CRD may play a more critical role in RAS-dependent RAF activation by helping orient the RAS-RAF complex at the plasma membrane for productive dimer formation rather than in facilitating complex formation itself. Further supporting this idea, specific mutations in the PS/membrane binding region or the RAS binding interface of the CRAF-CRD have been found to have a significant effect on RAF kinase output, yet have little impact on RAS-RAF binding (Daub et al., 1998; Tran et al., 2021). In the case of Q257R-BRAF, this mutant would be predicted to form additional interactions with the PS head groups, potentially altering the position of the CRD with respect to the membrane and RAS as well as the overall orientation of the RAS-RAF complex, which could have a detrimental effect on RAF activity.
In this study, we also compared the properties of the BRAF- and CRAF-CRDs (Figure 7C) and found that the BRAF-CRD was a stronger mediator of PS binding and autoinhibition and that exchanging the BRAF-CRD with that of CRAF was sufficient to activate the transforming potential of BRAF. Our findings further suggest that the enhanced autoinhibitory activity of the BRAF-CRD maybe required to maintain BRAF in a quiescent state, as BRAF has the highest basal catalytic activity of all the RAF kinases, due largely to the constitutive negative charge of the BRAF N-region sequences. In support of this model, CRAF proteins containing the BRAF N-region exhibited significantly increased catalytic activity and were found to be weakly transforming, consistent with the reduced autoinhibitory activity of the CRAF-CRD. Moreover, while incorporation of mutations analogous to the RASopathy-associated T241P, Q257R, or Q262K into the CRAF-CRD was not sufficient to promote cellular transformation, their incorporation into CRAF proteins containing the BRAF N-region resulted in mutant proteins that had significant transforming activity. Thus, the high basal catalytic activity of BRAF combined with the critical autoinhibitory function of the BRAF-CRD may account for why the CRD is a mutational hotspot for BRAF but not CRAF in the RASopathies. However, once autoinhibition is relieved, the enhanced PS binding activity of BRAF-CRD may aid in keeping BRAF at the plasma membrane, given the lower RAS-binding affinity of BRAF versus CRAF in live cells (Terrell et al., 2019).
In conclusion, analysis of the RASopathy BRAF-CRD mutations has provided significant insight regarding the relative importance of the distinct activities of the BRAF-CRD and has revealed functional differences between RAF family members that are relevant to human disease (Fig. 7C). Notably, this study also demonstrates the essential role of the CRD in maintaining BRAF autoinhibition, which if relieved, results in constitutive plasma membrane localization and increased RAS-dependent and RAS-independent function, and suggests that stabilizing the autoinhibited state using pharmacological approaches may have therapeutic benefit in preventing the aberrant activation of BRAF in human disease states.
LIMITATIONS OF THIS STUDY
Our work indicates that relief of autoinhibition is the major factor determining the severity of the BRAF CRD mutations in the zebrafish developmental model system and these findings were found to correlate closely with RASopathy patient reports. However, a larger pool of patient data, such as that being conducted by various genomic sequencing efforts, including the NCI-Advancing RAS/RASopathies Therapies (ART) Initiative (Gross et al., 2020), will be required to determine if these approaches can be used as a predictor of patient outcomes. Secondly, our findings suggest that the CRAF CRD plays a lesser role in autoinhibitory REG-CAT interactions than does the CRD of BRAF; however, our studies do not rule out the possibility that CRAF autoregulation may involve distinct mechanism(s) that require further biochemical and structural investigation.
STAR METHODS
RESOURCE AVAILABILITY
Lead contact
Further information and requests for resources and reagents should be directed to and will be fulfilled by the Lead Contact, Deborah Morrison (morrisod@mail.nih.gov).
Materials availability
Plasmids and cell lines are available for use upon request to the Lead Contact.
Data and code availability
All original immunoblots and cell images are deposited in Mendeley Data and are publicly available as of the date of publication. The DOI for these images is listed in the key resources table.
This paper does not report original code.
Any additional information required to reanalyze the data reported in this paper is available from the lead contact upon request.
KEY RESOURCES TABLE.
| REAGENT or RESOURCE | SOURCE | IDENTIFIER |
|---|---|---|
|
| ||
| Antibodies | ||
|
| ||
| BRAF (H-145) rabbit polyclonal | Santa Cruz Biotechnology | cat# sc-9002; RRID:AB_2067494 |
| HaloTag mouse monoclonal | Promega | cat# G9211; RRID:AB_2688011 |
| NanoLuc (Nluc) luciferase antibody | R&D Systems | cat# MAB100261 |
| FLAG M2 antibody | Millipore/Sigma | cat# F3165; RRID:AB_439685 |
| FLAG (L5) rat monoclonal antibody | BioLegend | cat# 637304; RRID:AB_1134267 |
| MEK1 mouse monoclonal | BD Biosciences | cat# 61022; RRID:AB_397528 |
| pS217/221-MEK rabbit polyclonal | Cell Signaling Technology | cat# 9121; RRID:AB_331648 |
| β-Tubulin mouse monoclonal | Santa Cruz Biotechnology | cat# sc-5274; RRID:AB_2288090 |
| α-Tubulin antibody, mouse monoclonal | Millipore Sigma | cat# T6199; RRID:AB_477583 |
| Pan-RAS rabbit polyclonal antibody | Cell Signaling Technology | cat# 3965; RRID:AB_2180216 |
| Alexa Fluor 568 goat anti-rat polyclonal antibody | Thermo Fisher | cat# A-11077; RRID:AB_2534121 |
| E-Cadherin, rat monoclonal antibody | Invitrogen | cat# 14-3249-82; RRID:AB_1210458 |
|
| ||
| Chemicals | ||
|
| ||
| Platelet Derived Growth Factor (PDGF) | Millipore/Sigma | cat# SRP3229 |
| X-tremeGENE 9 | Roche/Sigma | cat# 06365809001 |
| Collagen, Human Placenta Type IV | Millipore/Sigma | cat# C7521 |
| Doxycycline ((Z)-4-Hydroxytamoxifen) | Millipore Sigma | cat# H7904 |
| Paraformaldehyde | EM Sciences | cat# 15710 |
| Coelenterazine-h | Promega | cat# S2011 |
|
| ||
| Critical Commercial Assays | ||
|
| ||
| CellTiter-Glo 2.0 | Promega | cat# G9241 |
| QuickChange II Kit Agilent | Agilent | cat# 200523 |
| NanoBRET Kit | Promega | cat# N1661 |
|
| ||
| Deposited Data | ||
|
| ||
| Raw data files | This paper | Mendeley Data: https://doi.org/10.17632/d89bbp4k2k.1 |
|
| ||
| Experimental Models: Cell Lines | ||
|
| ||
| 293FT (human) | ATCC | cat# PTA-5077, RRID:CVCL_6911 |
| Phoenix-Eco (human) | ATCC | cat# CRL-3214; RRID:CVCL_H717 |
| NIH 3T3 (mouse) | ATCC | cat# CRL-1658; RRID:CVCL_0594 |
| COS7 | ATCC | cat# CRL-1651; RRID:CVCL_0224 |
| DU1473 | NCI-RAS Initiative | N/A |
|
| ||
| Recombinant DNA | ||
|
| ||
| pEGFP-C1-BRAF-CRD mutants | This paper | N/A |
| pCMV5-BRAFREG-mutants-Halo | This paper | N/A |
| pCMV5-NanoLuc-BRAFCAT mutants | This paper | N/A |
| pCMV5-NanoLuc-CRAFCAT | This paper | N/A |
| pCMV5-CRAFREG-Halo | This paper | N/A |
| pLenti-KRASG12V | NCI-RAS Initiative | N/A |
| pCMV5-Venus-KRASG12V | NCI-RAS Initiative | N/A |
| pLHCX-BRAFFL-RLuc8 | Terrell et al., 2019 | N/A |
| pLHCX-BRAFFL CRD mutants-RLuc8 | This paper | N/A |
| pLHCX-BRAFREG CRD-RLuc8 | Terrell et al., 2019 | N/A |
| pLHCX-BRAFREGCRD mutants-RLuc8 | This paper | N/A |
| pCS2+-BRAFFL CRD mutants | This paper | N/A |
| pBabe-Puro-FLAG-BRAF | Freeman et al., 2012 | N/A |
| pBabe-Puro-FLAG-BRAF mutants | This paper | N/A |
| pBabe-Puro-FLAG-CRAF | Freeman et al., 2012 | N/A |
| pBabe-Puro-FLAG-CRAF mutants | This paper | N/A |
| pEGFP-C1-CRAF-CRD mutants | This paper | N/A |
|
| ||
| Software and Algorisms | ||
|
| ||
| GraphPad Prism | GraphPad | https://www.graphpad.com |
| ImageJ | ImageJ | https://imagej.nih.gov/ij/ |
EXPERIMENTAL MODEL AND SUBJECT DETAILS
Cell Lines and Culture Conditions
293FT, COS-7, Phoenix-Eco, NIH 3T3, Du1473 and RAS-deficient MEF lines were cultured in DMEM supplemented with 10% fetal bovine serum (FBS), 2 mM L-glutamine, and 1% penicillin/streptomycin. MDCK cells were cultured in EMEM supplemented with 10% FBS. 2 mM L-glutamine, and 1% penicillin/streptomycin. All cells were cultured at 37°C under 5% CO2. All cell lines used in this project were purchased from reputable commercial sources, such as American Type Culture Collection (ATCC). The only exception is the RAS-deficient MEF cell line, DU1473, (Drosten et al., 2018), which has been extensively characterized and validated.
METHOD DETAILS
RAF-CRD Protein Production
Wild-type (WT) and mutant human BRAF (232–284) and CRAF/RAF-1 (136–188) entry clones were synthesized with an upstream tobacco etch virus (TEV) protease cleavage site (ENLYFQ/G) and optimized for expression in E. coli by ATUM (Newark, CA). Entry clone inserts were transferred by Gateway recombinational cloning (ThermoFisher, Carlsbad, CA) to pDest-566 (Addgene #11517), a T7-based E. coli expression vector encoding an N-terminal His6-MBP (maltose-binding protein) fusion. All CRD proteins were expressed using LB medium supplemented with 300 mM ZnCl2 as outlined for CRAF (52–188) in (Lakshman et al., 2019). For 2-liter working volume fermentations, 3-liter Bioflo 110 (Eppendorf) were used, and 20-liter Bioflo IV (Eppendorf) were used for 15-liter working volumes. Antifoam 204 (Sigma) was added at 0.075% v/v and 0.017% v/v, respectively, to the 2- and 15-liter fermenters. All proteins were purified essentially as outlined in (Kopra et al., 2020) for CRAF RBD (52–131). Specifically, 5 mM TCEP was used in all buffers and the protein occasionally eluted overlapping the salt peak during SEC which then required an additional dialysis step (3K MWCO) to the final buffer.
SPR measurements
SPR binding experiments were collected on a Biacore T200 Instrument (GE Healthcare). Anti-His6 monoclonal antibody (Abcam) was amine coupled to the carboxy-methylated dextran surface of a CM5 sensor chip (GE Healthcare) using standard amine coupling chemistry. The CM5 chip surface was first activated with 0.1 M N-hydroxysuccinimide and 0.4 M N-ethyl-N’-(3-dimethylaminopropyl) carbodimide at a flow rate of 20 μl/min. Next, anti-His6 monoclonal antibody was diluted to 20 μg/ml in 10 mM sodium acetate (pH 5.0) and injected on all 4 flow cells until a density of approximately 10000 Response Units (RU) was attached. His6-tagged MSP1D1 nanodiscs composed of either 1-palmitoyl-2-oleoyl-glycero-3-phosphocholine (POPC) or 80:20 1-palmitoyl-2-oleoyl-glycero-3-phosphocholine:1-palmitoyl-2-oleoyl-glycero-3-phosphoL-serine (POPC:POPS) were prepared as described previously (Agamasu et al., 2019). Nanodiscs were captured (2000–4000 RU) on flow cells 2 and 4 containing the anti-His6 antibody surfaces. Flow cells 1 and 4 were used for referencing and a series of buffer injections were added to establish a stable baseline. BRAF- or CRAF-CRD proteins were diluted in 2-fold from 5 – 0.31 μM in a buffer composed of 20 mM Hepes pH 7.0, 150 mM NaCl and injected over all the flow cells at 30 μl/min. SPR sensorgrams were normalized by the capture level of nanodiscs to allow direct comparison between different experimental runs. Equilibrium binding constants (Kd) were calculated using Prism. Complementary experiments were performed using captured liposomes as described previously (Travers et al., 2018). Specifically, L1 chips were activated with two injections of 20 mM CHAPS followed by liposomes (5 mM) composed of POPC or 80:20 POPC:POPS on flow cells 2 and 4 (capture levels 3500 – 5000). Flow cells 1 and 3 were used for referencing purposes. Following liposome capture a series of buffer injections (20 mM Hepes pH 7.0, 150 mM NaCl) were performed to obtain a stable baseline. BRAF-CRD proteins were diluted 2-fold from 15 – 0.12 μM in buffer and consecutively injected onto the captured liposomes. The L1 was regenerated using two injections 20 mM CHAPS. The data was analyzed to calculate the equilibrium partition coefficient (Kp; according to (Figueira et al., 2017).
Transfection and Lysis of Cells
All cell lines were plated 16–20 h prior to transfection at a confluency of ~70%. Cells were then transfected using the XtremeGENE9 transfection reagent per the manufacturer’s instructions, with a 2:1 ratio of XtremeGENE9 to DNA. For lysis, cells were washed twice with ice cold PBS and lysed in NP40 buffer (20mM Tris [pH 8.0], 137 mM NaCl, 10% glycerol, 1% NP-40 alternative, 0.15 U/mL aprotinin, 1 mM phenylmethylsulfonyl fluoride, 0.5 mM sodium vanadate, 20 mM leupeptin) at 4°C for 15 min on a rocking platform. Lysates were clarified by centrifugation at 14,000 rpm for 10 min at 4°C, following which the protein content was determined by Bradford assays.
Cell Imaging
COS7 and MDCK cells (5×10⁴) were plated onto 35 mm glass-bottom dishes (MATEK) that had been pre-coated with 10 μg/ml human placental type IV collagen. 16 h after plating, cells were transfected with the indicated DNA constructs, incubated for 24 h at 37°C under 5% CO2, and then serum-starved overnight, where indicated. The following day, cells were washed twice with PBS, fixed for 10 min in 4% paraformaldehyde, and then washed twice with PBS. MDCK cells were permeabilized with 0.1% Triton-PBS for 15 min, washed twice with PBS, blocked for 1 h in 2% BSA-PBS, and then incubated overnight in a 0.1% BSA-PBS solution containing E-cadherin antibody. The following day, cells were washed three times with PBS, incubated with Alexafluor568 secondary antibody for 45 min, washed three times with PBS containing 0.2% Tween-20 (TBST), and then washed twice in PBS. and then imaged in PBS using a 63x oil objective on a Zeiss LSM710 microscope. For the quantification of plasma membrane enrichment, cells were selected at random in the red (E-cadherin) channel, linear profiles were drawn through the plasma membrane and into the cytosol using ImageJ, the fluorescent intensity of both the red and green (BRAFFL-Venus) channels was measured, and the background fluorescence subtracted. Percent plasma membrane enrichment of the BRAFFL-Venus was calculated by dividing the peak plasma membrane fluorescence by the average of a 2 μm cytosolic section in the green channel (BRAFFL-Venus) for a total of 20 cells per condition.
NanoBRET Autoinhibition Assay
293FT cells were seeded into 6-well tissue culture plates at a concentration of 4×10⁵ cells/well. 16 h after plating, cells were co-transfected using 5 ng of the indicated NanoLuc-RAFCAT construct and 20 ng of the indicated Halo-BRAFREG construct (per well). 24 h later, cells were collected and resuspended in serum-free/phenol free Opti-MEM (Gibco™). 1 μl/ml HaloTag NanoBRET™ 618 ligand was added to the cell suspension and cells were seeded at a concentration of 8 ×10³ cells per well of a 384-well plate in quadruplicate (BioTek, Winooski, VT), with the remaining cells plated into a fresh 6-well tissue culture plate. After 24 h, 10 μl/ml NanoBRET NanoGlo substrate was added to each well of cells to be monitored for NanoBRET, with donor (460nm) and acceptor (618nm) emissions measured using a Perkins Elmer Envision plate reader (#2104-0010A containing a 460nm/50nm emission filter and a 610nm LP filter). Cells seeded into the 6-well plates were lysed, and the lysates examined by immunoblot analysis using antibodies recognizing the Halo-tag (for RAFREG detection) or the NanoLuc-tag (for RAFCAT detection) to ensure equal expression levels across conditions.
BRET RAS/RAF Interaction Assay
293FT cells were seeded into 12-well dishes at a concentration of 1×10⁵ cells/well. 16 h after plating, Venus-tagged and Rluc8-tagged constructs were co-transfected into cells using a calcium phosphate protocol. Duplicate 12-point saturation curve was generated in which the concentration of the energy donor construct (Rluc8) was held constant (62.5 ng) as the concentration of the energy acceptor plasmid (Venus) increased (0–1.0 μg). Cells were collected 48 h after transfection, washed, and resuspended in PBS (500 μL). 30 μL of the cell suspension was plated in duplicate into wells of a 384-well white-walled plate (PerkinElmer CulturPlate) and coelenterazine-h was added to a final concentration of 3.375 μM. The BRET and Rluc8 emissions were measured simultaneously using a PHERAstar Plus plate reader (BMG Labtech), with BRET monitored at 535 nm (bandwidth 30 nm) and Rluc8 measured at 475 nm (bandwidth 30 nm). To monitor the increasing levels of acceptor expression, 90 μL of the cell suspension was also plated in duplicate into wells of a 96-well black-walled plate (PerkinElmer OptiPlate), and Venus fluorescence was determined by using an excitation wavelength of 485 nm (5 nm bandwidth) and monitoring the emission at 530 nm (5 nm bandwidth) on a Tecan Infinite M1000 plate reader. The BRET ratio was determined by first calculating the 535/475 ratio for a given sample (sample BRET) and then normalizing the sample BRET to the BRET signal obtained from cells expressing the donor construct alone. The normalized mBRET signal was calculated as follows: (1000 × (sample BRET ratio/background BRET ratio)) − 1000. The acceptor/donor ratio (Venus emission/Rluc8 emission) for each data point was background corrected and equalized against a control where equal quantities of the Venus (acceptor) and Rluc8 (donor) constructs were transfected. Data was analyzed using GraphPad Prism. Non-linear regression was used to plot the best fit hyperbolic curve, and values for BRETmax and BRET50 were obtained from the calculated best fit curves. It should be noted that donor and acceptor expression levels were monitored via the Rluc8 and Venus emissions and are incorporated into the BRET calculations.
Focus Forming Assay
Recombinant retroviruses expressing the RAF proteins of interest were generated by transfecting 6 μg of the desired DNA construct into Phoenix-Eco cells (100 mm dish) using the XtremeGENE9 protocol described above. Viral supernatants were collected 48 h post-transfection, centrifuged twice at 1500 rpm for 10 min, and either stored at −80°C or used directly. NIH-3T3 cells were plated into 60 mm tissue culture dishes at a concentration of 2 × 10⁵ cells/dish. After 16 h, cells were infected with the indicated recombinant retrovirus in media containing 4% FBS and 8 μg/mL polybrene. 24 h later, cells were trypsinized and plated into two 100 mm dishes, one of which contained 5 μg/mL puromycin. After 2–4 weeks of culture, cells were fixed with 3.7% formaldehyde and stained with 1% methylene blue.
Proliferation Assay
Recombinant retrovirus expressing the indicated BRAFFL variants were generated as described for focus forming assays. HRAS and NRAS-deficient MEFs (DU1473) were infected or not with the recombinant retroviruses, following which cells were selected for 7 days in media containing 2 ug/ml puromycin. Resistant lines were then treated for 14 days with 500 nM doxycycline to remove the floxed KRAS-allele. Lysates from the doxycycline-treated cells were then examined by immunoblot analysis using the pan-RAS antibody (ABCAM) to confirm the absence of RAS protein expression. Cells were plated at a concentration of 1×10³ cells/well into 24-well tissue culture plates and proliferation was assessed every 24 hours over a 4-day time course using CellTiter-Glo 2.0 reagent (Promega). Luminescence was measured using a Perkins Elmer Envision Multimode Plate Reader.
Zebrafish Embryo Injections and Analysis
Fish care and animal work was approved by the National Cancer Institute at Frederick Animal Care and Use committee (Study Proposal 17-416). All capped mRNAs were generated from NotI linearized pCS2+ vector templates using the mMESSAGE mMACHINE T3 kit (ThermoFisher Scientific). AB-Tübingen zebrafish embryos were microinjected at the one cell stage with 66 pg/nL of mRNA encoding either WT or mutant FLAG-BRAF proteins or WT or mutant BRAF-Venus fusion proteins. After injection, embryos were maintained at 25°C until analysis. For convergence-extension cell movement assays (CE assays), embryos at the 3–6 somite stage were embedded oriented laterally in 1% low-melt agarose (Invitrogen, Carlsbad, CA) and imaged under bright field (to determine yolk elongation by taking major and minor axis measurements) and under fluorescent conditions (to monitor expression of the BRAF-Venus proteins). Larvae collected three days post-fertilization (dpf) were positioned laterally and imaged under bright field to monitor for pericardial edema. For ceratohyal (CH) angle and length measurements, Tg (col2a1aBAC:GFP) embryos were injected with 33 pg/nL RNA and treated with 0.003% 1-phenyl 2-thiourea to block pigmentation. At 5dpf, larvae were anesthetized with 0.2 mg/mL Tricaine in E3 and positioned dorsally against the side of grooves made by a mold (World Precision Instruments) in 1% low-melt agarose.
Images under bright field condition were taken using a 2X water immersion objective (0.06 NA) for CE assays, and image acquisition (~ 200 mm z-stacks with 5 mm step size) of Venus fluorescence was performed using a 10X objective (0.3 NA) for CH analyses. The Nikon Eclipse Ni-E upright microscope was equipped with a DS-Ri2 camera. All measurements were performed using the Nikon NIS Elements Analysis software and processing of images were carried out using ImageJ and Photoshop. Statistical analyses were conducted using GraphPad Prism.
RAF Kinase Assay
Cells expressing the indicated FLAG-RAF proteins were lysed under stringent conditions in RIPA buffer (20mM Tris [pH 8.0], 137 mM NaCl, 10% glycerol, 1% NP-40 alternative, 1% SDS, and 0.1% sodium deoxycholate) to disrupt protein complexes. The RAF proteins were immunopurified and incubated in kinase buffer (30 mM Tris pH 7.4, 10 mM MnCl2, 5 mM MgCl2, 1 mM DTT, 16.5 μM ATP) containing 20 μCi [γ−32P]ATP and kinase-inactive MEK. Samples were resolved by SDS-PAGE, and after transfer to nitrocellulose, the amount of radioactivity incorporated into MEK was determined by scintillation counting. RAF activity levels were normalized to RAF protein levels.
QUANTIFICATION AND STATISTICAL ANALYSIS
All statistical analysis and curve fitting was performed using GraphPad Prism. SPR analysis of CRD-lipid binding was quantified by calculating the slope of binding for nanodisc assays and by calculating the equilibrium partitioning coefficients for liposome assays (Figueira et al., 2017). NanoBRET data represents values pooled from 4 replicate wells from 3 independent experiments ± SD. For the RAS-RAF binding BRET assays, the acceptor/donor ratio was plotted versus mBRET values and hyperbolic curves were fitted using non-linear regression. BRET50 and BRETmax values were calculated from 3 independent experiments ± SD. For NIH-3T3 focus forming assays, foci were manually counted using ImageJ software in a blinded manner over 3 independent experiments ± SEM. For cell proliferation assays, cells were plated in quadruplicate wells of 12-well plates and cell proliferation was measured using CellTiter-Glo at the indicated timepoints over 2 independent experiments ± SEM. The plasma membrane enrichment of full-length BRAF was calculated by dividing the peak plasma membrane fluorescence by the average of the cytosolic portion for a total of 20 cells ± SEM. The zebrafish developmental data shows measurements pooled from three independent experiments and statistical significance was calculated using one-way analysis of variance (ANOVA) with Bonferroni correction. Quantification of in vitro kinase activity shows data pooled from duplicate wells over 3 independent experiments ± SD. Further details of the methods used for the quantification of experimental data are located in the corresponding methods sections and statistical analyses are found in the associated figure legends.
Supplementary Material
Table S2, related to Figure 4. Reported Evaluations of Patients with BRAF-CRD Mutations
HIGHLIGHTS.
RASopathy BRAF CRD mutations enhance membrane binding and/or relieve autoinhibition
Relief of autoinhibition is the major determinant of BRAF CRD mutant severity
CRD-mediated autoinhibition is required to prevent aberrant BRAF signaling
BRAF CRD has greater autoinhibitory and membrane binding activity than the CRAF CRD
ACKNOWLEDGMENTS
We thank John-Paul Denson, Matt Drew, Dominic Esposito, Bill Gillette, Jose Sanchez Hernandez, Shelley Perkins, Nitya Ramakrishnan, Kelly Snead, Troy Taylor, Vanessa Wall, and Timothy Waybright (FNLCR Protein Expression Laboratory) for the production and characterization of the isolated CRD proteins, and Linda Miller (LCDS) for technical support. This project has been funded in whole or in part with Federal funds from the National Cancer Institute, National Institutes of Health, under project number ZIA BC 010329 (D.K.M) and Contract No. HHSN261200800001E (A.G.S.).
Footnotes
DECLARATION OF INTERESTS
The authors declare no competing interests.
INCLUSION AND DIVERSITY
One or more of the authors of this paper self-identifies as an underrepresented ethnic minority in science, and we support inclusive, diverse, and equitable conduct of research.
Publisher's Disclaimer: This is a PDF file of an unedited manuscript that has been accepted for publication. As a service to our customers we are providing this early version of the manuscript. The manuscript will undergo copyediting, typesetting, and review of the resulting proof before it is published in its final form. Please note that during the production process errors may be discovered which could affect the content, and all legal disclaimers that apply to the journal pertain.
REFERENCES
- Agamasu C, Ghirlando R, Taylor T, Messing S, Tran TH, Bindu L, Tonelli M, Nissley DV, McCormick F, and Stephen AG (2019). KRAS Prenylation Is Required for Bivalent Binding with Calmodulin in a Nucleotide-Independent Manner. Biophys. J. 116, 1049–1063. 10.1016/j.bpj.2019.02.004. [DOI] [PMC free article] [PubMed] [Google Scholar]
- Askary A, Mork L, Paul S, He X, Izuhara AK, Gopalakrishnan S, Ichida JK, McMahon AP, Dabizljevic S, Dale R, et al. (2015). Iroquois Proteins Promote Skeletal Joint Formation by Maintaining Chondrocytes in an Immature State. Dev. Cell 35, 358–365. 10.1016/j.devcel.2015.10.004. [DOI] [PMC free article] [PubMed] [Google Scholar]
- Brtva TR, Drugan JK, Ghosh S, Terrell RS, Campbell-Burk S, Bell RM, and Der CJ (1995). Two distinct Raf domains mediate interaction with Ras. J. Biol. Chem. 270, 9809–9812. 10.1074/jbc.270.17.9809. [DOI] [PubMed] [Google Scholar]
- Chong H, and Guan K-L (2003). Regulation of Raf through phosphorylation and N-terminus-C terminus interaction. J. Biol. Chem. 278, 36269–36276. [DOI] [PubMed] [Google Scholar]
- Colon-Gonzalez F, and Kazanietz MG (2006). C1 domains exposed: From diacylglycerol binding to protein-protein interactions. Biochim. Biophys. Acta. 1761, 827–837. 10.1016/j.bbalip.2006.05.001. [DOI] [PubMed] [Google Scholar]
- Cutler RE Jr., Stephens RM, Saracino MR, and Morrison DK (1998). Autoregulation of the Raf-1 serine/threonine kinase. Proc. Natl. Acad. Sci. U S A 95, 9214–9219. 10.1073/pnas.95.16.9214. [DOI] [PMC free article] [PubMed] [Google Scholar]
- Daub M, Jockel J, Quack T, Weber CK, Schmitz F, Rapp UR, Wittinghofer A, and Block C (1998). The RafC1 cysteine-rich domain contains multiple distinct regulatory epitopes which control Ras-dependent Raf activation. Mol. Cell. Biol. 18, 6698–6710. 10.1128/Mcb.18.11.6698. [DOI] [PMC free article] [PubMed] [Google Scholar]
- Dougherty MK, Muller J, Ritt DA, Zhou M, Zhou XZ, Copeland TD, Conrads TP, Veenstra TD, Lu KP, and Morrison DK (2005). Regulation of Raf-1 by direct feedback phosphorylation. Mol. Cell 17, 215–224. 10.1016/j.molcel.2004.11.055. [DOI] [PubMed] [Google Scholar]
- Drosten M, Guerra C, and Barbacid M (2018). Genetically Engineered Mouse Models of K-Ras-Driven Lung and Pancreatic Tumors: Validation of Therapeutic Targets. Cold Spring Harb Perspect Med 8. 10.1101/cshperspect.a031542. [DOI] [PMC free article] [PubMed] [Google Scholar]
- Emuss V, Garnett M, Mason C, and Marais R (2005). Mutations of C-RAF are rare in human cancer because C-RAF has a low basal kinase activity compared with B-RAF. Cancer Res 65, 9719–9726. 10.1158/0008-5472.can-05-1683. [DOI] [PubMed] [Google Scholar]
- Figueira TN, Freire JM, Cunha-Santos C, Heras M, Gonçalves J, Moscona A, Porotto M, Salomé Veiga A, and Castanho MA (2017). Quantitative analysis of molecular partition towards lipid membranes using surface plasmon resonance. Sci. Rep. 7, 45647. 10.1038/srep45647. [DOI] [PMC free article] [PubMed] [Google Scholar]
- Freeman AK, Ritt DA, and Morrison DK (2013). Effects of Raf dimerization and its inhibition on normal and disease-associated Raf signaling. Mol. Cell 49, 751–758. 10.1016/j.molcel.2012.12.018. [DOI] [PMC free article] [PubMed] [Google Scholar]
- Ghosh S, Xie WQ, Quest AF, Mabrouk GM, Strum JC, and Bell RM (1994). The cysteine-rich region of raf-1 kinase contains zinc, translocates to liposomes, and is adjacent to a segment that binds GTP-ras. J. Biol. Chem. 269, 10000–10007. 10.1016/S0021-9258(17)36981-8. [DOI] [PubMed] [Google Scholar]
- Gross AM, Frone M, Gripp KW, Gelb BD, Schoyer L, Schill L, Stronach B, Biesecker LG, Esposito D, Hernandez ER, et al. (2020). Advancing RAS/RASopathy therapies: An NCI-sponsored intramural and extramural collaboration for the study of RASopathies. Am J Med Genet A 182, 866–876. 10.1002/ajmg.a.61485. [DOI] [PMC free article] [PubMed] [Google Scholar]
- Hebron KE, Hernandez ER, and Yohe ME (2022). The RASopathies: from pathogenetics to therapeutics. Dis. Model Mech 15. 10.1242/dmm.049107. [DOI] [PMC free article] [PubMed] [Google Scholar]
- Hekman M, Hamm H, Villar AV, Bader B, Kuhlmann J, Nickel J, and Rapp UR (2002). Associations of B- and C-Raf with cholesterol, phosphatidylserine, and lipid second messengers. J. Biol. Chem. 277, 24090–24102. 10.1074/jbc.M200576200 [DOI] [PubMed] [Google Scholar]
- Hu CD, Kariya K, Tamada M, Akasaka K, Shirouzu M, Yokoyama S, and Kataoka T (1995). Cysteine-rich region of Raf-1 interacts with activator domain of post-translationally modified Ha-Ras. J. Biol. Chem. 270, 30274–30277. 10.1074/jbc.270.51.30274. [DOI] [PubMed] [Google Scholar]
- Hu J, Stites EC, Yu H, Germino EA, Meharena HS, Stork PJS, Kornev AP, Taylor SS, and Shaw AS (2013). Allosteric activation of functionally asymmetric RAF kinase dimers. Cell 154, 1036–1046. 10.1016/j.cell.2013.07.046. [DOI] [PMC free article] [PubMed] [Google Scholar]
- Improta-Brears T, Ghosh S, and Bell RM (1999). Mutational analysis of Raf-1 cysteine rich domain: requirement for a cluster of basic aminoacids for interaction with phosphatidylserine. Mol. Cell. Biochem. 198, 171–178. 10.1023/a:1006981411691. [DOI] [PubMed] [Google Scholar]
- Jindal GA, Goyal Y, Yamaya K, Futran AS, Kountouridis I, Balgobin CA, Schupbach T, Burdine RD, and Shvartsman SY (2017). In vivo severity ranking of Ras pathway mutations associated with developmental disorders. Proc. Natl. Acad. Sci. U S A 114, 510–515. 10.1073/pnas.1615651114. [DOI] [PMC free article] [PubMed] [Google Scholar]
- Kopra K, Vuorinen E, Abreu-Blanco M, Wang Q, Eskonen V, Gillette W, Pulliainen AT, Holderfield M, and Härmä H (2020). Homogeneous Dual-Parametric-Coupled Assay for Simultaneous Nucleotide Exchange and KRAS/RAF-RBD Interaction Monitoring. Anal. Chem. 92, 4971–4979. 10.1021/acs.analchem.9b05126. [DOI] [PMC free article] [PubMed] [Google Scholar]
- Lakshman B, Messing S, Schmid EM, Clogston JD, Gillette WK, Esposito D, Kessing B, Fletcher DA, Nissley DV, McCormick F, et al. (2019). Quantitative biophysical analysis defines key components modulating recruitment of the GTPase KRAS to the plasma membrane. J. Biol. Chem. 294, 2193–2207. 10.1074/jbc.RA118.005669. [DOI] [PMC free article] [PubMed] [Google Scholar]
- Leevers SJ, Paterson HF, and Marshall CJ (1994). Requirement for Ras in Raf activation is overcome by targeting Raf to the plasma membrane. Nature 369, 411–414. 10.1038/369411a0. [DOI] [PubMed] [Google Scholar]
- Machleidt T, Woodroofe CC, Schwinn MK, Méndez J, Robers MB, Zimmerman K, Otto P, Daniels DL, Kirkland TA, and Wood KV (2015). NanoBRET--A Novel BRET Platform for the Analysis of Protein-Protein Interactions. ACS Chem. Biol. 10, 1797–1804. 10.1021/acschembio.5b00143. [DOI] [PubMed] [Google Scholar]
- Marais R, Light Y, Paterson HF, Mason CS, and Marshall CJ (1997). Differential regulation of Raf-1, A-Raf, and B-Raf by oncogenic ras and tyrosine kinases. J. Biol. Chem. 272, 4378–4383. 10.1074/jbc.272.7.4378. [DOI] [PubMed] [Google Scholar]
- Martinez Fiesco JA, Durrant DE, Morrison DK, and Zhang P (2022). Structural insights into the BRAF monomer-to-dimer transition mediated by RAS binding. Nat. Commun. 13, 486. 10.1038/s41467-022-28084-3. [DOI] [PMC free article] [PubMed] [Google Scholar]
- Medkova M, and Cho W (1999). Interplay of C1 and C2 domains of protein kinase C-alpha in its membrane binding and activation. J. Biol. Chem. 274, 19852–19861. 10.1074/jbc.274.28.19852. [DOI] [PubMed] [Google Scholar]
- Nan X, Collisson EA, Lewis S, Huang J, Tamguney TM, Liphardt JT, McCormick F, Gray JW, and Chu S (2013). Single-molecule superresolution imaging allows quantitative analysis of RAF multimer formation and signaling. Proc. Natl. Acad. Sci. U S A 110, 18519–18524. 10.1073/pnas.1318188110. [DOI] [PMC free article] [PubMed] [Google Scholar]
- Niihori T, Aoki Y, Narumi Y, Neri G, Cave H, Verloes A, Okamoto N, Hennekam RC, Gillessen-Kaesbach G, Wieczorek D, et al. (2006). Germline KRAS and BRAF mutations in cardio-facio-cutaneous syndrome. Nat. Genet. 38, 294–296. 10.1038/ng1749. [DOI] [PubMed] [Google Scholar]
- Oancea E, Teruel MN, Quest AF, and Meyer T (1998). Green fluorescent protein (GFP)-tagged cysteine-rich domains from protein kinase C as fluorescent indicators for diacylglycerol signaling in living cells. J. Cell Biol. 140, 485–498. 10.1083/jcb.140.3.485. [DOI] [PMC free article] [PubMed] [Google Scholar]
- Park E, Rawson S, Li K, Kim BW, Ficarro SB, Pino GG, Sharif H, Marto JA, Jeon H, and Eck MJ (2019). Architecture of autoinhibited and active BRAF-MEK1–14-3-3 complexes. Nature 575, 545–550. 10.1038/s41586-019-1660-y. [DOI] [PMC free article] [PubMed] [Google Scholar]
- Patterson VL, and Burdine RD (2020). Swimming toward solutions: Using fish and frogs as models for understanding RASopathies. Birth Defects Res. 112, 749–765. 10.1002/bdr2.1707. [DOI] [PMC free article] [PubMed] [Google Scholar]
- Rauen KA (2013). The RASopathies. Annu. Rev. Genomics Hum Genet. 14, 355–369. 10.1146/annurev-genom-091212-153523. [DOI] [PMC free article] [PubMed] [Google Scholar]
- Ritt DA, Monson DM, Specht SI, and Morrison DK (2010). Impact of feedback phosphorylation and Raf heterodimerization on normal and mutant B-Raf signaling. Mol. Cell. Biol. 30, 806–819. 10.1128/MCB.00569-09. [DOI] [PMC free article] [PubMed] [Google Scholar]
- Rodriguez-Viciana P, Tetsu O, Tidyman WE, Estep AL, Conger BA, Cruz MS, McCormick F, and Rauen KA (2006). Germline mutations in genes within the MAPK pathway cause cardio-facio-cutaneous syndrome. Science 311, 1287–1290. 10.1126/science.1124642. [DOI] [PubMed] [Google Scholar]
- Roy S, Lane A, Yan J, McPherson R, and Hancock JF (1997). Activity of plasma membrane-recruited Raf-1 is regulated by Ras via the Raf zinc finger. J. Biol. Chem. 272, 20139–20145. 10.1074/jbc.272.32.20139. [DOI] [PubMed] [Google Scholar]
- Sarkozy A, Carta C, Moretti S, Zampino G, Digilio MC, Pantaleoni F, Scioletti AP, Esposito G, Cordeddu V, Lepri F, et al. (2009). Germline BRAF mutations in Noonan, LEOPARD, and cardiofaciocutaneous syndromes: molecular diversity and associated phenotypic spectrum. Hum. Mutat. 30, 695–702. 10.1002/humu.20955. [DOI] [PMC free article] [PubMed] [Google Scholar]
- Schubbert S, Shannon K, and Bollag G (2007). Hyperactive Ras in developmental disorders and cancer. Nat. Rev. Cancer 7, 295–308. 10.1038/nrc2109. [DOI] [PubMed] [Google Scholar]
- Stokoe D, Macdonald SG, Cadwallader K, Symons M, and Hancock JF (1994). Activation of Raf as a result of recruitment to the plasma membrane. Science 264, 1463–1467. 10.1126/science.7811320. [DOI] [PubMed] [Google Scholar]
- Terrell EM, Durrant DE, Ritt DA, Sealover NE, Sheffels E, Spencer-Smith R, Esposito D, Zhou Y, Hancock JF, Kortum RL, and Morrison DK (2019). Distinct Binding Preferences between Ras and Raf Family Members and the Impact on Oncogenic Ras Signaling. Mol Cell 76, 872–884 e875. 10.1016/j.molcel.2019.09.004. [DOI] [PMC free article] [PubMed] [Google Scholar]
- Terrell EM, and Morrison DK (2019). Ras-Mediated Activation of the Raf Family Kinases. Cold Spring Harb. Perspect. Med 9. 10.1101/cshperspect.a033746. [DOI] [PMC free article] [PubMed] [Google Scholar]
- Tidyman WE, and Rauen KA (2016). Pathogenetics of the RASopathies. Human Molecular Genetics 25, R123–R132. 10.1093/hmg/ddw191. [DOI] [PMC free article] [PubMed] [Google Scholar]
- Tran NH, Wu X, and Frost JA (2005). B-Raf and Raf-1 are regulated by distinct autoregulatory mechanisms. J. Biol. Chem. 280, 16244–16253. 10.1074/jbc.M501185200. [DOI] [PubMed] [Google Scholar]
- Tran TH, Chan AH, Young LC, Bindu L, Neale C, Messing S, Dharmaiah S, Taylor T, Denson JP, Esposito D, et al. (2021). KRAS interaction with RAF1 RAS-binding domain and cysteine-rich domain provides insights into RAS-mediated RAF activation. Nat. Commun. 12, 1176. 10.1038/s41467-021-21422-x. [DOI] [PMC free article] [PubMed] [Google Scholar]
- Travers T, Lopez CA, Agamasu C, Hettige JJ, Messing S, Garcia AE, Stephen AG, and Gnanakaran S (2020). Anionic Lipids Impact RAS-Binding Site Accessibility and Membrane Binding Affinity of CRAF RBD-CRD. Biophys. J. 119, 525–538. 10.1016/j.bpj.2020.06.021. [DOI] [PMC free article] [PubMed] [Google Scholar]
- Travers T, Lopez CA, Van QN, Neale C, Tonelli M, Stephen AG, and Gnanakaran S (2018). Molecular recognition of RAS/RAF complex at the membrane: Role of RAF cysteine-rich domain. Sci. Rep. 8, 8461. 10.1038/s41598-018-26832-4. [DOI] [PMC free article] [PubMed] [Google Scholar]
- Verbeek DS, Goedhart J, Bruinsma L, Sinke RJ, and Reits EA (2008). PKC gamma mutations in spinocerebellar ataxia type 14 affect C1 domain accessibility and kinase activity leading to aberrant MAPK signaling. J. Cell Sci. 121, 2339–2349. 10.1242/jcs.027698. [DOI] [PubMed] [Google Scholar]
- Winkler DG, Cutler RE Jr., Drugan JK, Campbell S, Morrison DK, and Cooper JA (1998). Identification of residues in the cysteine-rich domain of Raf-1 that control Ras binding and Raf-1 activity. J. Biol. Chem. 273, 21578–21584. 10.1074/jbc.273.34.21578. [DOI] [PubMed] [Google Scholar]
- Xu RX, Pawelczyk T, Xia TH, and Brown SC (1997). NMR structure of a protein kinase C-gamma phorbol-binding domain and study of protein-lipid micelle interactions. Biochemistry 36, 10709–10717. 10.1021/bi970833a. [DOI] [PubMed] [Google Scholar]
Associated Data
This section collects any data citations, data availability statements, or supplementary materials included in this article.
Supplementary Materials
Table S2, related to Figure 4. Reported Evaluations of Patients with BRAF-CRD Mutations
Data Availability Statement
All original immunoblots and cell images are deposited in Mendeley Data and are publicly available as of the date of publication. The DOI for these images is listed in the key resources table.
This paper does not report original code.
Any additional information required to reanalyze the data reported in this paper is available from the lead contact upon request.
KEY RESOURCES TABLE.
| REAGENT or RESOURCE | SOURCE | IDENTIFIER |
|---|---|---|
|
| ||
| Antibodies | ||
|
| ||
| BRAF (H-145) rabbit polyclonal | Santa Cruz Biotechnology | cat# sc-9002; RRID:AB_2067494 |
| HaloTag mouse monoclonal | Promega | cat# G9211; RRID:AB_2688011 |
| NanoLuc (Nluc) luciferase antibody | R&D Systems | cat# MAB100261 |
| FLAG M2 antibody | Millipore/Sigma | cat# F3165; RRID:AB_439685 |
| FLAG (L5) rat monoclonal antibody | BioLegend | cat# 637304; RRID:AB_1134267 |
| MEK1 mouse monoclonal | BD Biosciences | cat# 61022; RRID:AB_397528 |
| pS217/221-MEK rabbit polyclonal | Cell Signaling Technology | cat# 9121; RRID:AB_331648 |
| β-Tubulin mouse monoclonal | Santa Cruz Biotechnology | cat# sc-5274; RRID:AB_2288090 |
| α-Tubulin antibody, mouse monoclonal | Millipore Sigma | cat# T6199; RRID:AB_477583 |
| Pan-RAS rabbit polyclonal antibody | Cell Signaling Technology | cat# 3965; RRID:AB_2180216 |
| Alexa Fluor 568 goat anti-rat polyclonal antibody | Thermo Fisher | cat# A-11077; RRID:AB_2534121 |
| E-Cadherin, rat monoclonal antibody | Invitrogen | cat# 14-3249-82; RRID:AB_1210458 |
|
| ||
| Chemicals | ||
|
| ||
| Platelet Derived Growth Factor (PDGF) | Millipore/Sigma | cat# SRP3229 |
| X-tremeGENE 9 | Roche/Sigma | cat# 06365809001 |
| Collagen, Human Placenta Type IV | Millipore/Sigma | cat# C7521 |
| Doxycycline ((Z)-4-Hydroxytamoxifen) | Millipore Sigma | cat# H7904 |
| Paraformaldehyde | EM Sciences | cat# 15710 |
| Coelenterazine-h | Promega | cat# S2011 |
|
| ||
| Critical Commercial Assays | ||
|
| ||
| CellTiter-Glo 2.0 | Promega | cat# G9241 |
| QuickChange II Kit Agilent | Agilent | cat# 200523 |
| NanoBRET Kit | Promega | cat# N1661 |
|
| ||
| Deposited Data | ||
|
| ||
| Raw data files | This paper | Mendeley Data: https://doi.org/10.17632/d89bbp4k2k.1 |
|
| ||
| Experimental Models: Cell Lines | ||
|
| ||
| 293FT (human) | ATCC | cat# PTA-5077, RRID:CVCL_6911 |
| Phoenix-Eco (human) | ATCC | cat# CRL-3214; RRID:CVCL_H717 |
| NIH 3T3 (mouse) | ATCC | cat# CRL-1658; RRID:CVCL_0594 |
| COS7 | ATCC | cat# CRL-1651; RRID:CVCL_0224 |
| DU1473 | NCI-RAS Initiative | N/A |
|
| ||
| Recombinant DNA | ||
|
| ||
| pEGFP-C1-BRAF-CRD mutants | This paper | N/A |
| pCMV5-BRAFREG-mutants-Halo | This paper | N/A |
| pCMV5-NanoLuc-BRAFCAT mutants | This paper | N/A |
| pCMV5-NanoLuc-CRAFCAT | This paper | N/A |
| pCMV5-CRAFREG-Halo | This paper | N/A |
| pLenti-KRASG12V | NCI-RAS Initiative | N/A |
| pCMV5-Venus-KRASG12V | NCI-RAS Initiative | N/A |
| pLHCX-BRAFFL-RLuc8 | Terrell et al., 2019 | N/A |
| pLHCX-BRAFFL CRD mutants-RLuc8 | This paper | N/A |
| pLHCX-BRAFREG CRD-RLuc8 | Terrell et al., 2019 | N/A |
| pLHCX-BRAFREGCRD mutants-RLuc8 | This paper | N/A |
| pCS2+-BRAFFL CRD mutants | This paper | N/A |
| pBabe-Puro-FLAG-BRAF | Freeman et al., 2012 | N/A |
| pBabe-Puro-FLAG-BRAF mutants | This paper | N/A |
| pBabe-Puro-FLAG-CRAF | Freeman et al., 2012 | N/A |
| pBabe-Puro-FLAG-CRAF mutants | This paper | N/A |
| pEGFP-C1-CRAF-CRD mutants | This paper | N/A |
|
| ||
| Software and Algorisms | ||
|
| ||
| GraphPad Prism | GraphPad | https://www.graphpad.com |
| ImageJ | ImageJ | https://imagej.nih.gov/ij/ |