Abstract
Background/Aim: Body composition assessment has shown promising results as a prognostic biomarker as depicted by cross-sectional imaging of several tumor entities including lymphomas. The present study sought to elucidate the prognostic relevance of subcutaneous and visceral fat tissue (SAT and VAT) in patients with primary central nervous system lymphoma (PCNSL).
Patients and Methods: Overall, 74 patients (36 female patients, 46.7%) with a mean age of 64.2±12.8 years (range=23-81 years) were identified in the database with sufficient clinical and imaging data and included into this retrospective study. Fat area assessment was performed on one axial slide on L3-height derived from staging computed tomography (CT) images. Subcutaneous, visceral, and intramuscular adipose tissues (SAT, VAT, IMAT) were estimated. Also, density of SAT, VAT, and IMAT were estimated. Finally, the ratio VAT/SAT (VSR) was calculated. Overall and progression-free survival (OS and PFS) were used as study end points.
Results: In the observation period, overall, 47 patients (63.5%) died. Mean OS was 33.8±45.4 months and mean PFS was 26.6±42.7 months. The mean VAT value was 162±99.5 cm2, the mean SAT was 202.4±103.3 cm2, the mean VSR was 0.92±0.69. The hazard ratios (HRs) for overall survival were 0.87 for high VAT, 1.52 for SAT, and 0.73 for VSR in univariable analysis. For PFS it was 0.24 for VAT, 1.11 for SAT, and 1.07 for VSR. No values achieved statistical significance. Similar results were shown in Kaplan-Meier analysis for OS and PFS, respectively.
Conclusion: Parameters of adipose tissue are not associated with OS and PFS in patients with PCNSL.
Keywords: Body composition, visceral fat tissue, CT, cerebral lymphoma
Primary central nervous system (CNS) lymphoma (PCNSL) is an aggressive extra-nodal lymphoma exclusively involving the brain, spinal cord, cranial nerves, leptomeninges, and eyes (1,2). Diffuse large B-cell lymphoma (DLBCL) is the most common subtype of this entity (1,2). The incidence of PCNSL appears to be increasing in recent years according to epidemiological studies with an age-adjusted incidence of PCNSL of 0.16 per 100,000 (2). The highest rates were observed among older patients above 65 years.
CNS infiltration secondary to systemic DLBCLs or lymphomas occurring in immunodeficient patients is excluded from this disease entity and has a different prognosis (1,2). To exclude other lymphoma types with a secondary CNS infiltration and intraocular involvement, several diagnostic examinations, including a computed tomography (CT) are performed for staging purposes (1-3). Conventional therapy for PCNSL is still divided into induction and consolidation phase with high dose methotrexate combined with rituximab and temozolomide (1).
An emergent research field is body composition assessment utilizing cross-sectional imaging (4-7). By this approach, skeletal muscle area and fat areas can be calculated, which are important to assess sarcopenia and visceral obesity (6,7). This is especially useful as the cross-sectional imaging is performed for diagnostic staging purposes and could, by this analysis, provide novel biomarkers without any further costs or radiation exposure.
There is growing evidence that these parameters are of predictive and prognostic relevance throughout oncology (4-8). Moreover, sarcopenia/low skeletal muscle mass (LSMM) can be a factor for treatment toxicity of chemotherapy and should be acknowledged as an important factor in oncologic patients (9). The importance of sarcopenia and visceral obesity as independent prognostic factors for oncologic patients is increasingly based on large studies and meta-analyses (4-7). However, there is still paucity of data regarding these novel CT-defined body composition parameters in patients with PCNSL. Therefore, the present study sought to elucidate the prognostic capabilities of CT-defined fat areas in PCNSL on overall and progression-free survival (OS, PFS).
Patients and Methods
Patient acquisition. This retrospective study was approved by the institutional review board. All patients with PCNSL were retrospectively assessed in one university hospital. Overall, 74 patients (36 female patients, 46.7%) with a mean age of 64.2±12.8 years (range=23-81 years) were identified in the database with sufficient clinical and imaging data. All PCNSLs were histopathologically confirmed by stereotactic biopsy before admission of steroids.
Clinical parameters. For clinical parameters, the following parameters were retrieved from the clinical records. OS was defined as the survival within the observation period. PFS was determined as the time frame up to growth progression of the PCNSL, as defined by magnetic resonance imaging (MRI).
Treatment regimes typically recommended included systemic therapy for patients suitable for or capable of tolerating high doses of chemotherapy, whereas for unfit patients, 24-36 Gy of whole brain radiotherapy (WBRT) with a boost to gross disease for a total of 45 Gy is indicated. The first recommendation is high dose-methotrexate (MTX) at 8 g/m2 with rituximab (R) and temozolomide or a reduced dose of 3.5 g/m2 MTX with R, vincristine and procarbazine (R-MVP) as well as WBRT (1-3).
Imaging technique. All CT scans were obtained on a multidetector CT scanner (Siemens Somatom Definition AS+, Siemens Healthcare, Germany or Canon Aquilion Prime, Canon Medical Systems, Ottawara, Japan). Patients were positioned in supine position. The CT protocol was as follows: acquisition slice thickness 1 mm with 5 mm reconstructions, tube voltage 120 kV, automatic tube current modulation, pitch factor 1.2, collimation 0.6 mm.
Imaging acquisition was performed prior to therapy initiation. All images were assessed in consensus by two experienced radiologists (VF and AS) who were blinded to the clinical course of the patients. Measurements were performed on axial images at the L3 level in the soft tissue window (window of 45 to 250 HU) on a dedicated workstation (Infinitt PACS, Version 3.0, Infinitt Healthcare, Korea).
Subcutaneous, visceral, and intramuscular adipose tissues (SAT, VAT, IMAT) were semiautomatically measured with the freely available ImageJ software 1.48v (National Institutes of Health Image program). Also, density of SAT, VAT and IMAT were estimated. Finally, the ratio VAT/SAT (VSR) was calculated. One axial slide on the mid of the third lumbar vertebral (L3) was used, as it is commonly performed in the literature (6-8). The fat area was semiautomatically measured using the HU threshold levels of -190 and -30 HU, as proposed in similar studies (6-8).
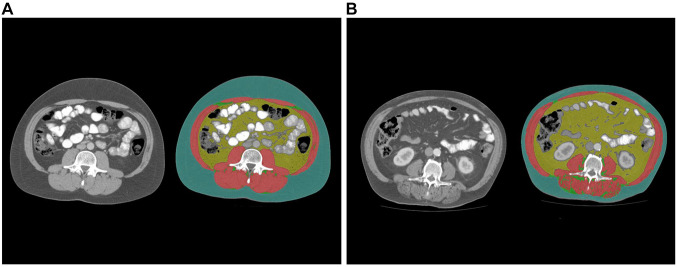
The proposed threshold value of 100 cm2 was utilized as a cut-off value to determine visceral obesity, as used in previous studies (6-8). High SAT was defined as 100 cm2 and high VSR was defined as 1.1. Figure 1 displays images from two representative patients with different fat area contents for illustrative purposes.
Figure 1. Estimation of adipose tissues: visceral adipose tissue (VAT, yellow colored), subcutaneous adipose tissue (SAT, green colored), intramuscular adipose tissue (IMAT, clear green colored). Skeletal muscles are colored in red. A) Representative images from patients with low VAT and SAT. B) Representative images from patients with high VAT and SAT.
Statistical analysis. The statistical analysis and graphics creation were performed using SPSS (IBM SPSS Statistics for Windows, version 225.0: IBM, New Armonk, NY, USA). Collected data were evaluated by means of descriptive statistics (absolute and relative frequencies). Group differences were calculated with the Mann-Whitney and Fisher exact tests, when suitable. Kaplan-Meier curves were used for survival analysis. In all instances, p-values <0.05 were considered to indicate statistical significance.
Results
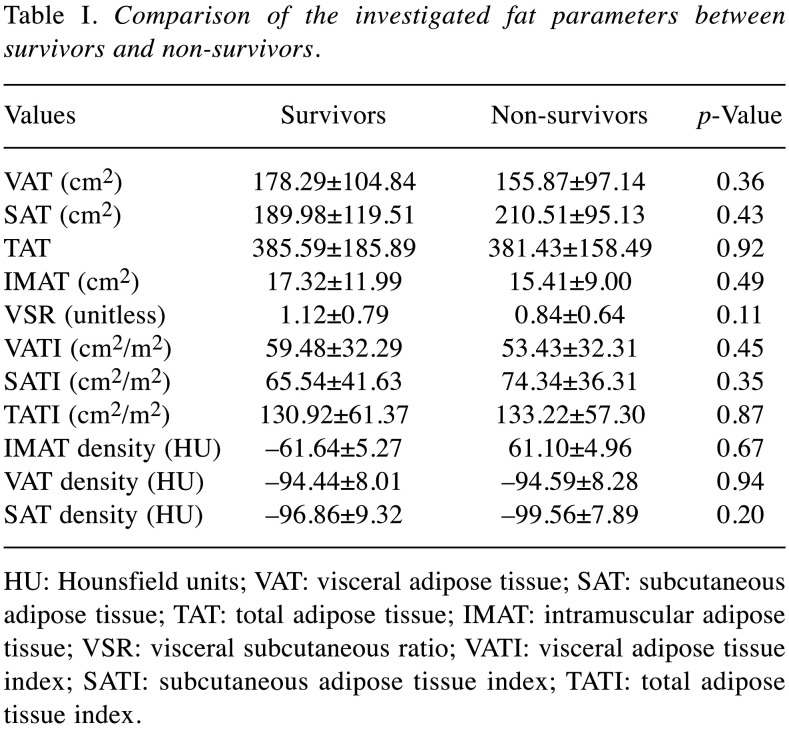
During the observation period, overall, 47 patients (63.5%) died. In the overall patient sample, the mean OS was 33.8±45.4 months and the mean PFS was 26.6±42.7 months. Table I provides an overview of the investigated fat parameters according to survival.
Table I. Comparison of the investigated fat parameters between survivors and non-survivors.
HU: Hounsfield units; VAT: visceral adipose tissue; SAT: subcutaneous adipose tissue; TAT: total adipose tissue; IMAT: intramuscular adipose tissue; VSR: visceral subcutaneous ratio; VATI: visceral adipose tissue index; SATI: subcutaneous adipose tissue index; TATI: total adipose tissue index
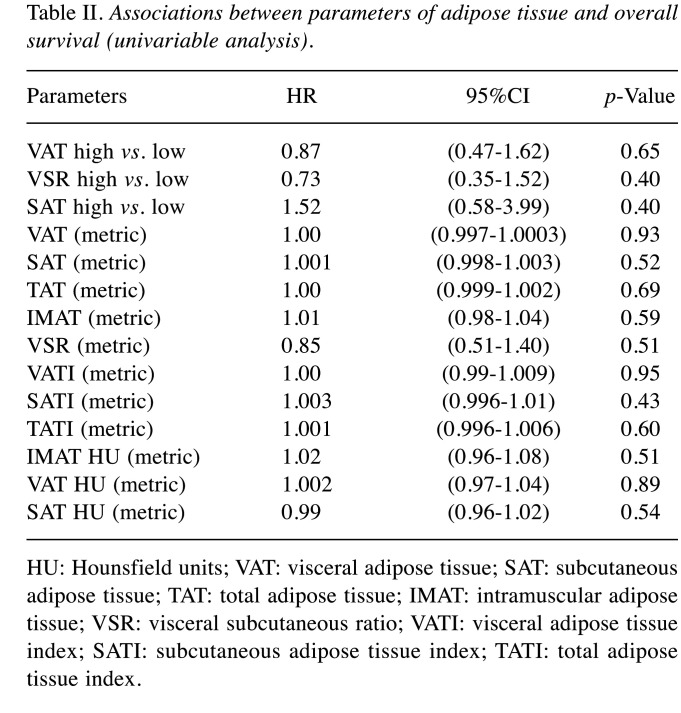
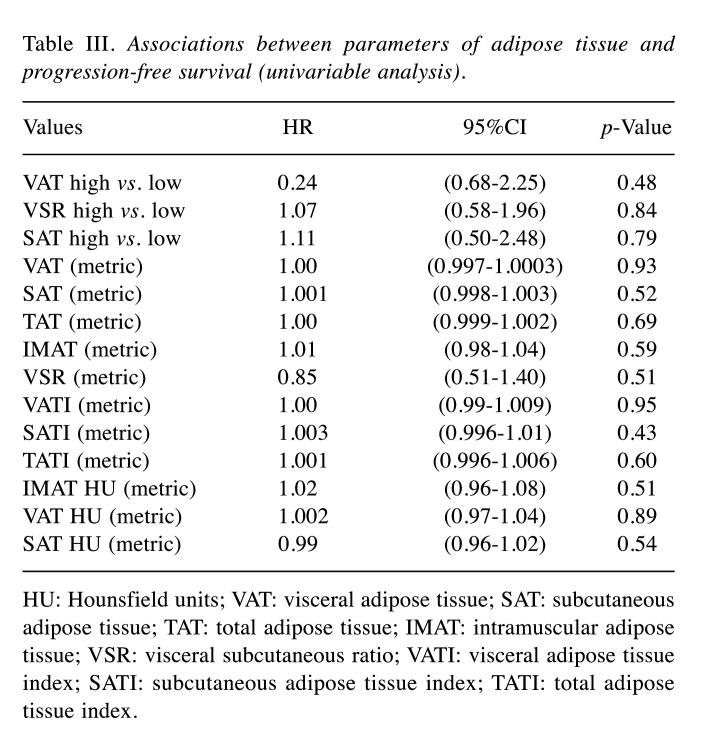
An overview of the investigated fat parameters in accordance with OS and PFS is given in Table II and Table III. None of the analyzed parameters of the adipose tissue differed between the subgroups.
Table II. Associations between parameters of adipose tissue and overall survival (univariable analysis).
HU: Hounsfield units; VAT: visceral adipose tissue; SAT: subcutaneous adipose tissue; TAT: total adipose tissue; IMAT: intramuscular adipose tissue; VSR: visceral subcutaneous ratio; VATI: visceral adipose tissue index; SATI: subcutaneous adipose tissue index; TATI: total adipose tissue index.
Table III. Associations between parameters of adipose tissue and progression-free survival (univariable analysis).
HU: Hounsfield units; VAT: visceral adipose tissue; SAT: subcutaneous adipose tissue; TAT: total adipose tissue; IMAT: intramuscular adipose tissue; VSR: visceral subcutaneous ratio; VATI: visceral adipose tissue index; SATI: subcutaneous adipose tissue index; TATI: total adipose tissue index.
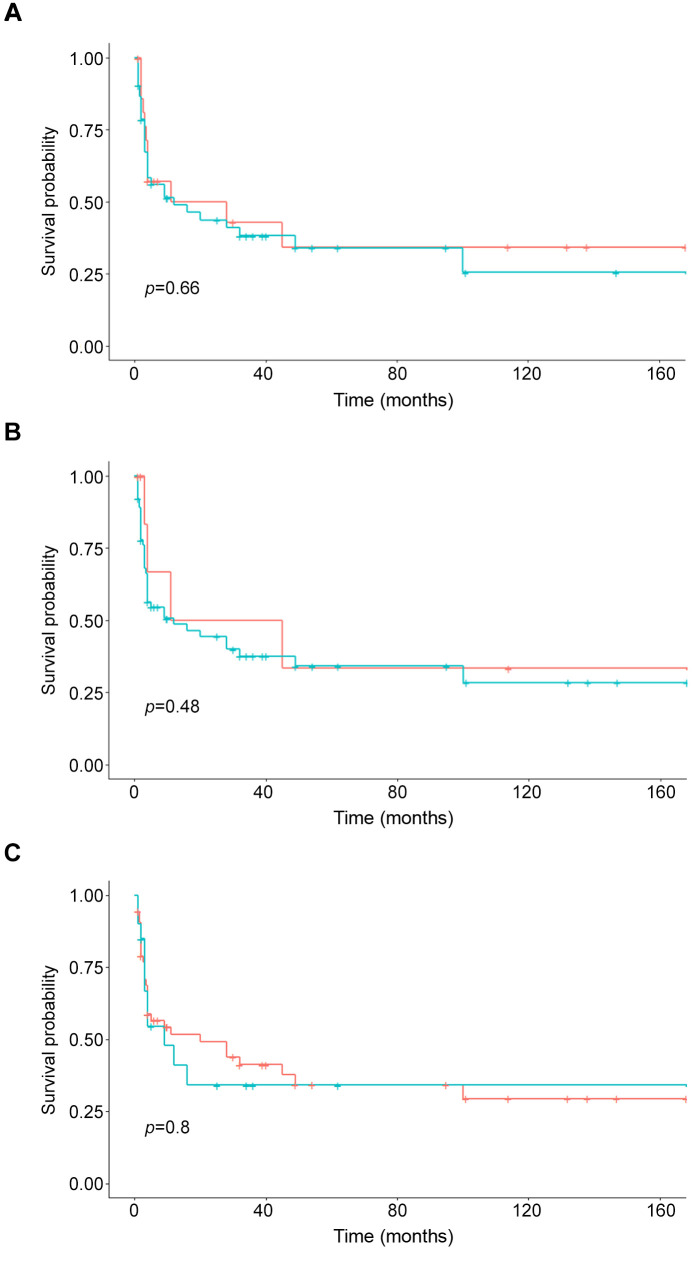
For patients with visceral obesity, the mean OS was 40 months, whereas for patients without it was 12 months (p=0.65). For patients with high SAT, the mean OS was 25 months and for those with normal SAT it was 14 months (p=0.39). Finally, patients with high VSR had a mean OS of 28 months and in patients with normal VSR, the mean OS was 13 months (p=0.39).
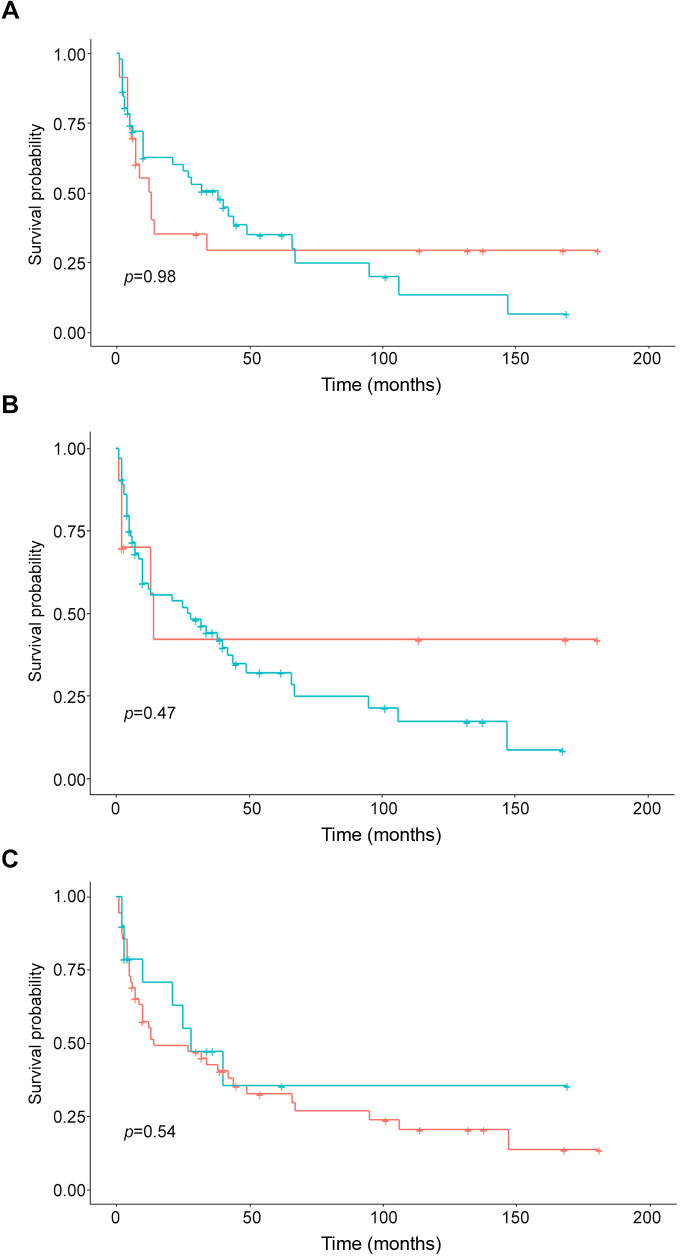
Regarding PFS, patients with visceral obesity had a mean PFS of 4 months and it was 5 months in patients with normal VAT (p=0.46). Patients with high SAT achieved a mean PFS of 5 months and patients with normal SAT had a mean PFS of 4 months (p=0.78). Finally, patients with high VSR showed a mean PFS of 4 months and in patients with normal VSR it was 5 months (p=0.83). The Kaplan-Meier curves display the survival data (Figure 2 and Figure 3).
Figure 2. Kaplan-Meier curves of the overall survival of patients with different adipose tissue contents. A) Patients with high (green) and normal VAT (blue) (p=0.66). B) Patients with high (green) and normal (blue) SAT. There was no statistically significant difference between the groups (p=0.48). C) Patients with high (green) and normal (blue) VSR (p=0.80).
Figure 3. Kaplan-Meier curves of the progression-free survival of patients with different adipose tissue contents. A) Patients with high (green) and normal (blue) VAT (p=0.98). B) Patients with high (green) and normal (blue) SAT (p=0.47). C) Patients with high (green) and normal (blue) VSR (p=0.54).
Discussion
This study employed CT-defined body composition to elucidate its possible prognostic relevance in PCNSL. As a key finding, there were no statistically significant differences between patients with high fat areas compared to those with low fat areas for SAT as well as VAT. Therefore, parameters of adipose tissue cannot be used as biomarkers in PCNSL.
There has been a plethora of studies investigating the prognostic relevance of LSMM and visceral fat areas throughout different medical areas with predominance in oncology (4-8).
A large umbrella analysis studied associations between LSMM and oncological prognosis and identified a pooled odds ratio of 1.97 (95%CI=1.45-2.68) based on 3 studies comprising overall 1,123 patients for non-relapse mortality (4).
The included studies investigated lymphomas as well as leukemia patients undergoing hematopoietic stem cell transplantation (10). Treatment regimes differed significantly from extracranial hematological disorders. That is why there is definite need to investigate the associations between body composition parameters and survival data in PCNS.
LSMM is established as an independent risk factor for postoperative complications, especially in abdominal surgery (11). In several tumor entities, such as gastric and pancreatic cancer, there is a clear link between visceral obesity and short- and long-term complications after surgical treatment (11).
Visceral obesity, defined as a high visceral fat area above 100 cm2, was identified to be another important prognostic factor derived from CT images (11). This threshold was used in most studies to dichotomize the VAT parameter. However, there are also other approaches such as tertiles or using the VAT as a metric parameter. In the clinic, it can be better used using a dichotomized approach.
As such, in the study by Shin et al. investigating 156 patients with DLBCL undergoing R-CHOP treatment, they employed a threshold value of the third tertile (12). With this approach, strong associations between high VAT and PFS as well as OS could be identified (HR=2.13, 95%CI=1.12-4.0 and HR=2.66, 95%CI=1.30-5.44, respectively) (12). Notably, VAT assessment was strongly associated with survival, whereas conventional BMI was not. This finding emphasizes that CT-based body composition provided novel data beyond clinical data.
In another study that analyzed multiple myeloma, the subcutaneous fat area was associated with a poor OS (HR=4.05; p=0.02), whereas visceral fat area was not (13). Therefore, one can assume that for different hematological disorders, different body composition parameters should be identified and utilized in clinical routine.
In PCNSL, established prognostic factors have been proposed by the International Extranodal Lymphoma Study group comprising age, Eastern Cooperative Oncology Group performance status (ECOG PS), serum lactate dehydrogenase (LDH) levels, cerebrospinal fluid (CSF) protein concentration, and involvement of deep brain structures (14,15). The Memorial Sloan Kettering Cancer Center prognostic score utilizes age and Karnofsky performance status as important features. For imaging, the apparent diffusion coefficient value (ADC) derived from MRI seems to be a promising imaging biomarker, which can provide additional prognostic value (16).
LSMM is another relevant factor in ICNSL. So far, it has been shown that PFS (HR=4.40, 95%CI=1.66-11.61, p=0.003) and OS (HR=3.16, 95%CI=1.09-9.11) were associated with LSMM defined by CT on L3 level as well as temporal muscle thickness derived by brain MRI (17). One can conclude that the effects of sarcopenia are more important regarding the prognosis in PCNSL compared to fat areas, as sarcopenia is a key factor of chemotoxicity, which can lead to changes in systemic treatment.
Similar results have also been reported in gastric cancer patients undergoing palliative systemic treatment (18). So far, VAT has not been found to predict prognosis in gastric cancer (18).
The present study is not free from limitations. First, it is a retrospective analysis of one center, and there may be selection bias. Second, the time delay between CT imaging and treatment differed. However, the effect of treatment on body composition might be neglected in a short time frame. Third, treatment regimes differed between the patients, which reflects the daily clinical routine.
In conclusion, parameters of adipose tissue are not associated with OS and PFS in patients with PCNSL.
Conflicts of Interest
The Authors report no conflicts of interest concerning this study.
Authors’ Contributions
MH, VF, HJM, VZ, DM, JO, MP, and AS designed the study and analysis. Clinical data were acquired by MH, KM, ERS, JR, and MRA. The study was supervised by AS, DW, AW, SS, and AS. The manuscript was prepared by AS with input from all Authors.
References
- 1.Schaff LR, Grommes C. Primary central nervous system lymphoma. Blood. 2021 doi: 10.1182/blood.2020008377. [DOI] [PMC free article] [PubMed] [Google Scholar]
- 2.Yuan Y, Ding T, Wang S, Chen H, Mao Y, Chen T. Current and emerging therapies for primary central nervous system lymphoma. Biomark Res. 2021;9(1):32. doi: 10.1186/s40364-021-00282-z. [DOI] [PMC free article] [PubMed] [Google Scholar]
- 3.Tateishi K, Miyake Y, Nakamura T, Yamamoto T. Primary central nervous system lymphoma: clinicopathological and genomic insights for therapeutic development. Brain Tumor Pathol. 2021;38(3):173–182. doi: 10.1007/s10014-021-00408-z. [DOI] [PubMed] [Google Scholar]
- 4.Xia L, Zhao R, Wan Q, Wu Y, Zhou Y, Wang Y, Cui Y, Shen X, Wu X. Sarcopenia and adverse health-related outcomes: An umbrella review of meta-analyses of observational studies. Cancer Med. 2020;9(21):7964–7978. doi: 10.1002/cam4.3428. [DOI] [PMC free article] [PubMed] [Google Scholar]
- 5.Borggreve AS, den Boer RB, van Boxel GI, de Jong PA, Veldhuis WB, Steenhagen E, van Hillegersberg R, Ruurda JP. The predictive value of low muscle mass as measured on CT scans for postoperative complications and mortality in gastric cancer patients: a systematic review and meta-analysis. J Clin Med. 2020;9(1):199. doi: 10.3390/jcm9010199. [DOI] [PMC free article] [PubMed] [Google Scholar]
- 6.Yang Z, Zhou X, Ma B, Xing Y, Jiang X, Wang Z. Predictive value of preoperative sarcopenia in patients with gastric cancer: a meta-analysis and systematic review. J Gastrointest Surg. 2018;22(11):1890–1902. doi: 10.1007/s11605-018-3856-0. [DOI] [PubMed] [Google Scholar]
- 7.Albano D, Messina C, Vitale J, Sconfienza LM. Imaging of sarcopenia: old evidence and new insights. Eur Radiol. 2020;30(4):2199–2208. doi: 10.1007/s00330-019-06573-2. [DOI] [PubMed] [Google Scholar]
- 8.Prado CM, Lieffers JR, McCargar LJ, Reiman T, Sawyer MB, Martin L, Baracos VE. Prevalence and clinical implications of sarcopenic obesity in patients with solid tumours of the respiratory and gastrointestinal tracts: a population-based study. Lancet Oncol. 2008;9(7):629–635. doi: 10.1016/S1470-2045(08)70153-0. [DOI] [PubMed] [Google Scholar]
- 9.Surov A, Pech M, Gessner D, Mikusko M, Fischer T, Alter M, Wienke A. Low skeletal muscle mass is a predictor of treatment related toxicity in oncologic patients. A meta-analysis. Clin Nutr. 2021;40(10):5298–5310. doi: 10.1016/j.clnu.2021.08.023. [DOI] [PubMed] [Google Scholar]
- 10.Jia S, Qiao R, Xiao Y, Qin D, Zhao W, Zhao Y, Liu X, Dong B. Prognostic value of sarcopenia in survivors of hematological malignances undergoing a hematopoietic stem cell transplantation: a systematic review and meta-analysis. Support Care Cancer. 2020;28(8):3533–3542. doi: 10.1007/s00520-020-05359-3. [DOI] [PubMed] [Google Scholar]
- 11.Saravana-Bawan B, Goplen M, Alghamdi M, Khadaroo RG. The relationship between visceral obesity and post-operative complications: a meta-analysis. J Surg Res. 2021;267:71–81. doi: 10.1016/j.jss.2021.04.034. [DOI] [PubMed] [Google Scholar]
- 12.Shin DY, Kim A, Byun BH, Moon H, Kim S, Ko YJ, Kim MJ, Lee HR, Kang HJ, Na II, Park S, Lee SS, Yang SH. Visceral adipose tissue is prognostic for survival of diffuse large B cell lymphoma treated with frontline R-CHOP. Ann Hematol. 2016;95(3):409–416. doi: 10.1007/s00277-015-2571-0. [DOI] [PubMed] [Google Scholar]
- 13.Takeoka Y, Sakatoku K, Miura A, Yamamura R, Araki T, Seura H, Okamura T, Koh H, Nakamae H, Hino M, Ohta K. Prognostic effect of low subcutaneous adipose tissue on survival outcome in patients with multiple myeloma. Clin Lymphoma Myeloma Leuk. 2016;16(8):434–441. doi: 10.1016/j.clml.2016.04.010. [DOI] [PubMed] [Google Scholar]
- 14.Ferreri AJ, Blay JY, Reni M, Pasini F, Spina M, Ambrosetti A, Calderoni A, Rossi A, Vavassori V, Conconi A, Devizzi L, Berger F, Ponzoni M, Borisch B, Tinguely M, Cerati M, Milani M, Orvieto E, Sanchez J, Chevreau C, Dell’Oro S, Zucca E, Cavalli F. Prognostic scoring system for primary CNS lymphomas: the International Extranodal Lymphoma Study Group experience. J Clin Oncol. 2003;21(2):266–272. doi: 10.1200/JCO.2003.09.139. [DOI] [PubMed] [Google Scholar]
- 15.Han CH, Batchelor TT. Diagnosis and management of primary central nervous system lymphoma. Cancer. 2017;123(22):4314–4324. doi: 10.1002/cncr.30965. [DOI] [PubMed] [Google Scholar]
- 16.Baek DW, Cho HJ, Bae JH, Sohn SK, Moon JH. Apparent diffusion coefficient as a valuable quantitative parameter for predicting clinical outcomes in patients with newly diagnosed primary CNS lymphoma. Blood Res. 2020;55(2):99–106. doi: 10.5045/br.2020.2020032. [DOI] [PMC free article] [PubMed] [Google Scholar]
- 17.Leone R, Sferruzza G, Calimeri T, Steffanoni S, Conte GM, De Cobelli F, Falini A, Ferreri AJM, Anzalone N. Quantitative muscle mass biomarkers are independent prognosis factors in primary central nervous system lymphoma: The role of L3-skeletal muscle index and temporal muscle thickness. Eur J Radiol. 2021;143:109945. doi: 10.1016/j.ejrad.2021.109945. [DOI] [PubMed] [Google Scholar]
- 18.Hacker UT, Hasenclever D, Linder N, Stocker G, Chung HC, Kang YK, Moehler M, Busse H, Lordick F. Prognostic role of body composition parameters in gastric/gastroesophageal junction cancer patients from the EXPAND trial. J Cachexia Sarcopenia Muscle. 2020;11(1):135–144. doi: 10.1002/jcsm.12484. [DOI] [PMC free article] [PubMed] [Google Scholar]


