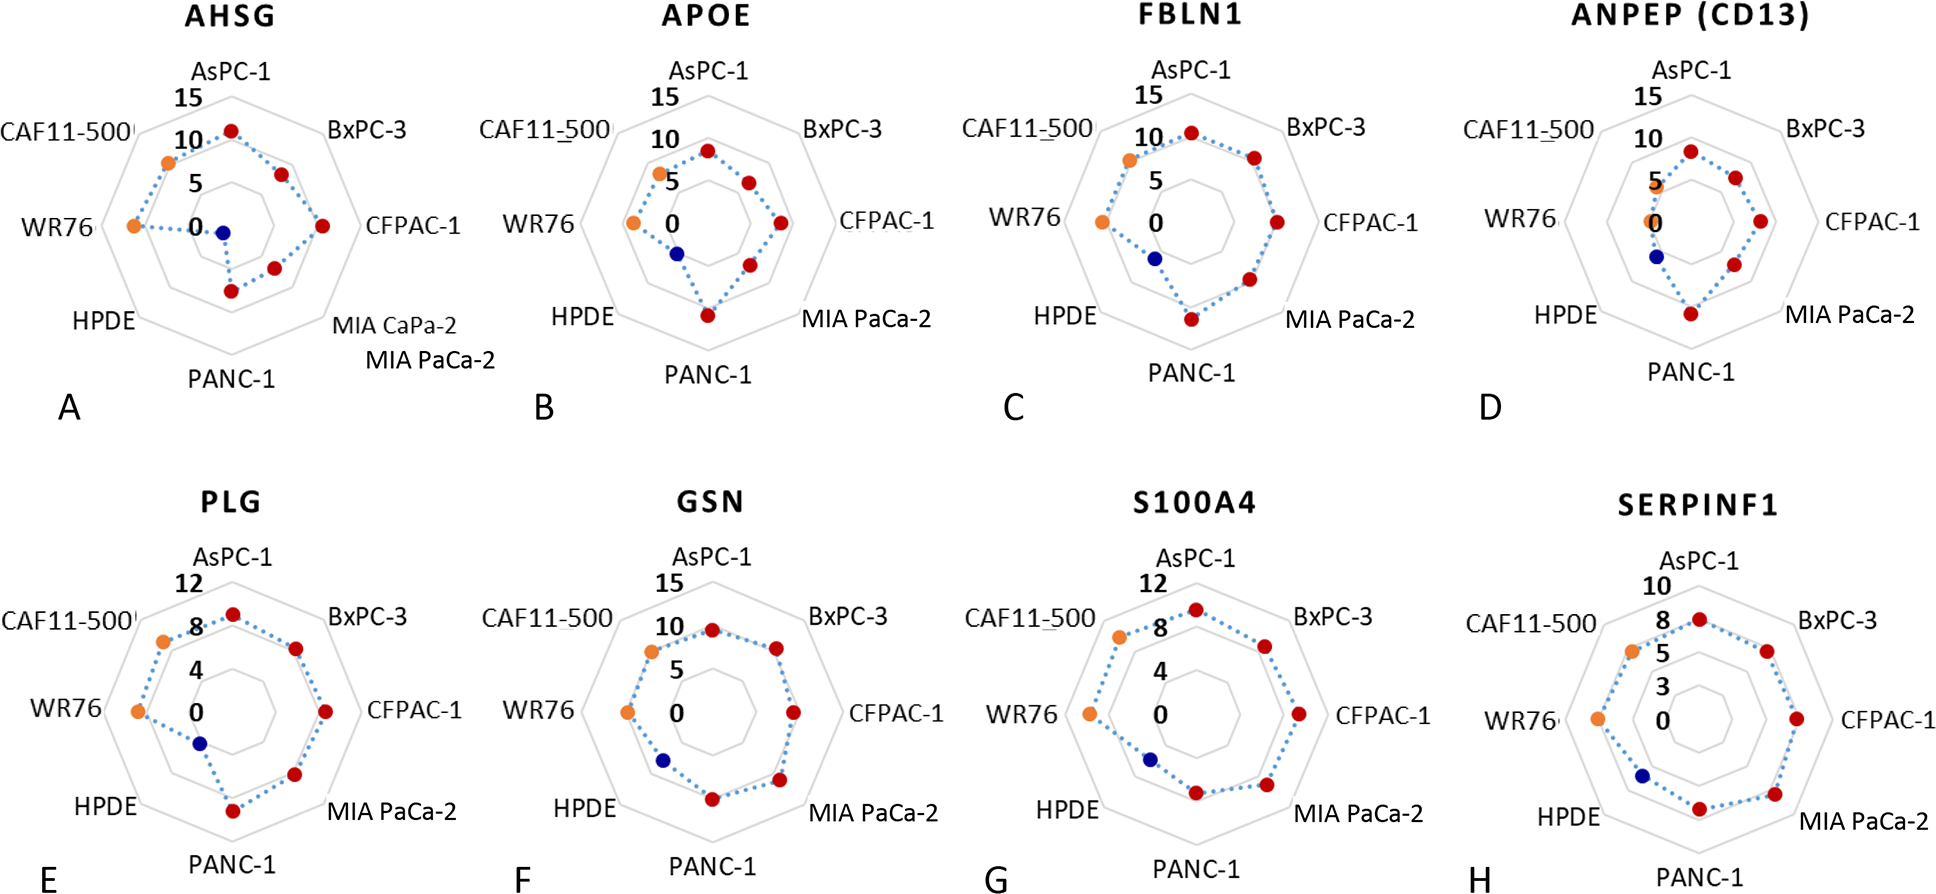
FIGURE 7.

The abundance (represented by normalized intensity in log2 scale) of selected proteins in the EVs secreted from PDAC cells (red dots), CAFs (orange dots), and HPDE (blue dot). A, AHSG, (B) APOE, (C) FBLN1, (D) ANPEP (CD13), (E) PLG, (F) GSN, (G) S100A4, (H) SERPINF1.
