

Abstract
Enolase 2 (ENO2) has increasingly been documented in multiple cancers in recent years. However, the role of ENO2 in clear cell renal carcinoma (ccRCC) has not been fully explored. In the present study, open-access data were downloaded from The Cancer Genome Atlas (TCGA), Gene Expression Omnibus (GEO), and the Human Protein Atlas (HPA) databases. All statistical analyses were performed in R and GraphPad Prism 8 softwares. Results showed that ENO2 was overexpressed in ccRCC tissues and cell lines and correlated with worse clinical features and prognosis. In vitro experiments indicated that the inhibition of ENO2 could hamper the malignant behaviors of ccRCC cells. Gene Set Enrichment Analysis showed that epithelial-mesenchymal transition, KRAS signaling, inflammatory response, angiogenesis, hypoxia, and WNT/β-catenin pathways were upregulated in the ENO2 high-expression group; whereas adipogenesis, DNA repair, and androgen response pathways were downregulated. Immune infiltration analysis indicated that patients with high ENO2 levels might have higher M2 macrophages and lower γβ T cells in the tumor microenvironment, which may account to some extent for the worse prognosis of ENO2. Moreover, it was found that patients with low and high ENO2 expression might be more sensitive to PD-1 therapy and CTLA-4 therapy, respectively. In addition, patients with high ENO2 expression showed lower sensitivity to common chemotherapy drugs for ccRCC, including axitinib, cisplatin, gemcitabine, pazopanib, sunitinib, and temsirolimus. Overall, these results suggest that ENO2 is a potential prognosis biomarker of ccRCC and could affect the malignant biological behavior of cancer cells, highlighting its value as a potential therapeutic target.
1. Introduction
Renal cell carcinoma (RCC) is one of the most common malignancies in urology, with approximately 250,000 new cases per year globally [1]. It is well-established that clear cell renal cell carcinoma (ccRCC) is the most frequent subtype of RCC [2]. Surgical resection remains the mainstay of treatment for localized ccRCC due to satisfactory prognosis rates [3]. However, about 30% of ccRCC patients develop distant metastasis due to the lack of early symptoms, resulting in a dismal 5-year survival rate [4], emphasizing the need to identify novel and effective molecular markers associated with the early diagnosis and treatment of ccRCC patients.
Enolase 2 (ENO2) is a homodimer in mature neurons and cells of neuronal origin that encodes one of the three enolase isoenzymes in mammals [5]. Over the years, studies have demonstrated that ENO2 is widely involved in the physiological and pathophysiological processes of diverse cancers [6]. For example, Wang et al. [7] revealed that nuclear hepatoma-derived growth factor could upregulate the expression of solute carrier family 2 (facilitated glucose transporter), member 4 and ENO2, responsible for the activation of glycolysis in gastric cancer cells, which might facilitate the growth of cancer cells and metastasis processes. Liu et al. [8] found that ENO2 could enhance cell growth, glycolysis, and glucocorticoid resistance of acute lymphoblastic leukemia cells, suggesting that it is a potential therapeutic target. Meanwhile, Zheng et al. [9] showed that insulin-like growth factor 1 could induce deacetylation of ENO2 in a histone deacetylase 3-dependent manner, further promoting pancreatic cancer metastasis. Besides, Tang et al. [10] reported that kruppel-like factor 12, a transcription factor, could hamper the proliferation of bladder cancer through transcriptional inhibition of ENO2. Moreover, Sun et al. [11] found that overexpression of ENO2 might lead to the enhanced malignant behavior of cancer cells and a worse prognosis, associated with increased glycolysis in papillary renal cell carcinoma. Nevertheless, the role of ENO2 in ccRCC has hitherto not been fully elucidated.
The rapid development of bioinformatic analysis provides convenience for researchers to identify novel disease biomarkers [12]. In this study, we comprehensively explored the role of ENO2 in ccRCC through bioinformatics analysis and in vitro experiments. Our results showed that ENO2 was upregulated in ccRCC tissues and was correlated with worse clinical features, including shorter survival time. In vitro experiments indicated that the inhibition of ENO2 could hamper the malignant behaviors of ccRCC cells. Moreover, Gene Set Enrichment Analysis (GSEA) was performed to explore the difference in biological pathways between patients with high and low expression of ENO2. The CIBERSORT algorithm was also applied to quantify the immune cell infiltration in ccRCC tissues. Moreover, the bioinformatics analysis suggested that ENO2 was associated with the glycolysis process and chemosensitivity of ccRCC.
2. Methods
2.1. Acquisition of Open-Access Data
The open-access data, including transcriptional profile and clinical information, were retrieved from the Cancer Genome Atlas (TCGA) and Gene Expression Omnibus (GEO) databases. In this respect, the transcriptional profile downloaded from the TCGA database was in the “TPM” form. The genomics reference file “Homo_sapiens.GRCh38,gtf” was used for probe annotation. Clinical information downloaded from the TCGA database was in “xml” form and collated using the author's own Perl code. Datasets GSE40435 (platform: GPL10558; 101 pairs of ccRCC tumor and adjacent tissues), GSE53757 (platform: GPL570; 72 pairs of ccRCC tumor and adjacent tissues), and GSE105261 (platform: GPL10558; nine normal renal tissues, nine primary ccRCC tissues, and 26 metastatic ccRCC tissues) were obtained from the GEO database. Before analysis, the “limma” and “affy” packages were utilized for data preprocessing of the individual cohort, including probe annotation, missing value completion, normalization and correction. The representative immunohistochemistry (IHC) pictures in ccRCC tumor and normal renal tissues were obtained from The Human Protein Atlas database (HPA; https://www.proteinatlas.org/). Finally, the genomics of drug sensitivity in cancer (GDSC) database was utilized to perform drug sensitivity analysis to explore the underlying effect of ENO2 on ccRCC chemotherapy (http://www.cancerrxgene.org/).
2.2. Analysis of Differentially Expressed Genes (DEGs) and Construction of a Protein-Protein Interaction (PPI) Network
The “Limma” R package was applied to identify DEGs between ccRCC and normal renal tissues, with the threshold of |logFC| > 1 and P value <0.05 as the cutoffs. A PPI network was constructed based on the STRING website (https://cn.string-db.org/) and then visualized in Cytoscape_v3.7.2 software. The relative importance of each node was calculated using the CytoHubba plug-in of Cytoscape.
2.3. Clinical Correlation and Prognosis Analysis
The clinical features of ccRCC patients in TCGA, including survival status, age, gender, and clinical stage, were collated and combined with ENO2 expression data. Patients were stratified into low and high expression groups based on the median cutoff, and then the R package “survival” was applied to assess the prognosis of groups with different expression levels of ENO2.
2.4. Pathway Enrichment Analysis
GSEA analysis was utilized to explore the biological difference between high and low ENO2 expression patients, which was completed using the “clusterProfiler” and “fgsea” packages in R software. Notably, the hallmark was defined as the reference dataset. The top ten downregulated and upregulated pathways were selected for visualization. Gene ontology (GO) and Kyoto Encyclopedia of Genes and Genomes (KEGG) enrichment analyses were then performed using the R package “clusterProfiler”.
2.5. Immune Infiltration and Immunotherapy Response Analysis
The CIBERSORT algorithm was applied to explore the difference in immune infiltration in tissues with high and low ENO2 expression to quantify the relative proportions of 22 types of infiltrating immune cells. Tumor Immune Dysfunction and Exclusion (TIDE) and the submap algorithm were then used to assess the efficacy of immunotherapy.
2.6. Cell Lines and Quantitative Real-Time PCR (qPCR)
Human renal tubular epithelial cell line (HK-2) and human ccRCC cell lines (ACHN, 786-O, Caki-1) were purchased from the cell bank of the Chinese Academy of Sciences. Total RNA was extracted from cells using the TRIzol method, followed by reverse transcription to cDNA for further experiments. qPCR was performed using a PCR kit (Takara, Kyoto, Japan) according to the manufacturer's protocol. SYBR Green system was then used to detect the amplification products. The following primers were used: ENO2: forward, 5′-CATCTGTGATGGGAGCGTCA-3′; reverse, 5′-TGGGACAAGAGCAAAGCACA-3′ and GAPDH: forward, 5′-CTGGGCTACACTGAGCACC-3′; reverse, 5′-AAGTGGTCGTTGAGGGCAATG-3′.
2.7. Cell Transfection
Lipofectamine 2000 transfection kits (Invitrogen) were used for cell transfection. Notably, the shRNA and control plasmid of ENO2 were obtained from Shanghai Ji Kai Chemical Technology. The shRNA target sequences used were as follows: siRNA1; 5′-CAAGGGAGTCATCAAGGACAA-3′, siRNA2; 5′-CGCCTGGCTAATAAGGCTTTA-3′, and siRNA3; 5′-GTGTATTTATTTATTTATTTA-3′.
2.8. Western Blot
A total protein extraction kit (Beyotime, Jiangsu, China) was used to extract the total protein following the manufacturer's protocol. The SDS–polyacrylamide gel electrophoresis (SDS-PAGE) glue was utilized for the western blot based on the standard process. The primary antibody of ENO2 (1 : 5000) and GAPDH (1 : 10000) were purchased from Proteintech.
2.9. CCK8 Assay
A CCK8 kit (Dojindo, Shanghai, China) was used to perform the CCK8 assay following the manufacturer's protocol. Briefly, cells were resuspended and inoculated into a 96-well plate at a density of 1 × 10⁴ cells per well. The CCK8 reagent was added to the plate, followed by incubation at 37°C for 2 h. Finally, the absorbance was measured at OD 450 nm using an ELISA plate reader (BioTek, Winooski, VT, USA).
2.10. Colony Formation Assay
Cells were resuspended and inoculated into a six-well plate at a density of 500 cells per well. Cells were then maintained for 14 days in an incubator. Finally, cells were fixed with 4% paraformaldehyde and stained with crystal violet.
2.11. Transwell Assay
A transwell chamber was used to divide the 24-plate well into two chambers: the upper chamber and the lower chamber. Next, 3 × 10⁴ ccRCC cells and 250 μL medium with 10% bovine serum albumin (BSA) were added to the upper chamber, whereas 500 μL medium without BSA was added to the lower chamber. After 12 h, cells were fixed with 4% paraformaldehyde and stained with crystal violet.
2.12. Xenograft Nude Mouse Model
We purchased five-week-old male BALB/c nude mice for the xenograft model test. Briefly, 5 × 10⁵ 786-O cells in the control and inhibition groups were subcutaneously inoculated into the back of mice. All the mice were sacrificed for 20 days and weighed.
2.13. Immunohistochemistry
Paraffin-embedded 5 μm thick sections of mice tumor tissues were cut. Immunohistochemistry was performed using the ENO2 primary antibody (6F8G3, Proteintech) based on the standard process. Positive expression was observed as cytoplasmic yellow-, brown-, or tan-colored staining.
2.14. Statistical Analyses
All statistical analyses were performed using R and GraphPad Prism 8 softwares. A P value less than 0.05 was statistically significant. All experiments were replicated at least three times. The Student t-test was used to compare the difference of data conforming to a normal distribution, whereas the Kruskal–Wallis test was used for data with a nonparametric distribution.
3. Results
3.1. Identification of ENO2 through Bioinformatics Analysis
We first identified DEGs based on the transcriptional profile data of ccRCC and normal renal tissues in multiple public databases (GSE40435, GSE53757, GSE105261, and TCGA). Results revealed that 41 upregulated and 89 downregulated DEGs exhibited similar expression patterns in the four datasets (Figures 1(a) and 1(b)). Next, the top 20 important nodes in the 41 upregulated and 89 downregulated DEGs were visualized, which might play key roles in ccRCC tumorigenesis (Figures 1(c) and 1(d)). Univariate Cox regression analysis was then performed to identify prognosis-related DEGs. It was found that 29 DEGs that were downregulated in ccRCC were protective factors (HR < 1; P < 0.05) (Figure 1(e)). Meanwhile, three DEGs that were overexpressed in ccRCC were risk factors (HR > 1; P < 0.05), including ENO2, transforming growth factor, beta-induced (TGFBI), and transmembrane protein 45A (TMEM45A) (Figure 1(f)). Moreover, ENO2 was the key node in the PPI network of upregulated DEGs and was, thus, selected for further analysis.
Figure 1.
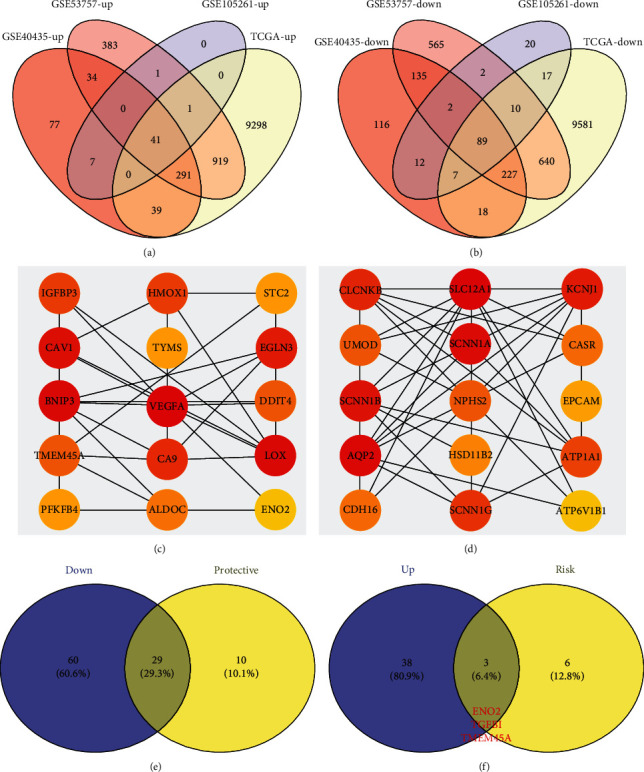
The identification process of ENO2 as the target gene in ccRCC. Notes: (a) intersection of four individual databases (GSE40435, GSE53757, GSE105261, and TCGA) identified 41 genes showing an upregulated pattern in ccRCC tissues. (b) Intersection of the four individual databases (GSE40435, GSE53757, GSE105261, and TCGA) identified 89 genes showing a downregulated pattern in ccRCC tissues. (c) Top 20 key nodes of the 41 upregulated genes based on PPI network. (d) Top 20 key nodes of the 89 downregulated genes based on PPI network. (e) Among the 89 downregulated genes, 29 genes were protective factors. (f) Among the 41 upregulated genes, three genes were risk factors, including ENO2, TGFBI, and TMEM45A.
3.2. ENO2 Was Upregulated in ccRCC
Datasets GSE40435, GSE53757, and GSE105261 showed that ccRCC tissues had a higher ENO2 RNA expression level than normal renal tissues (Figures 2(a) and 2(b)). It was also found that metastasis ccRCC tissues exhibited higher ENO2 expression than the primary ccRCC tissues, indicating that ENO2 may be associated with distant metastasis (Figure 2(c)). Similar results were observed by analysis in the TCGA database (Figures 2(d) and 2(e)). Furthermore, we explored the expression of ENO2 in ccRCC cell lines. Results showed that ENO2 was overexpressed in ccRCC cell lines compared to normal HK-2 cells (Figure 2(f)). The representative IHC images from the HPA database indicated higher ENO2 protein expression in ccRCC tissues (Figure 2(g)).
Figure 2.
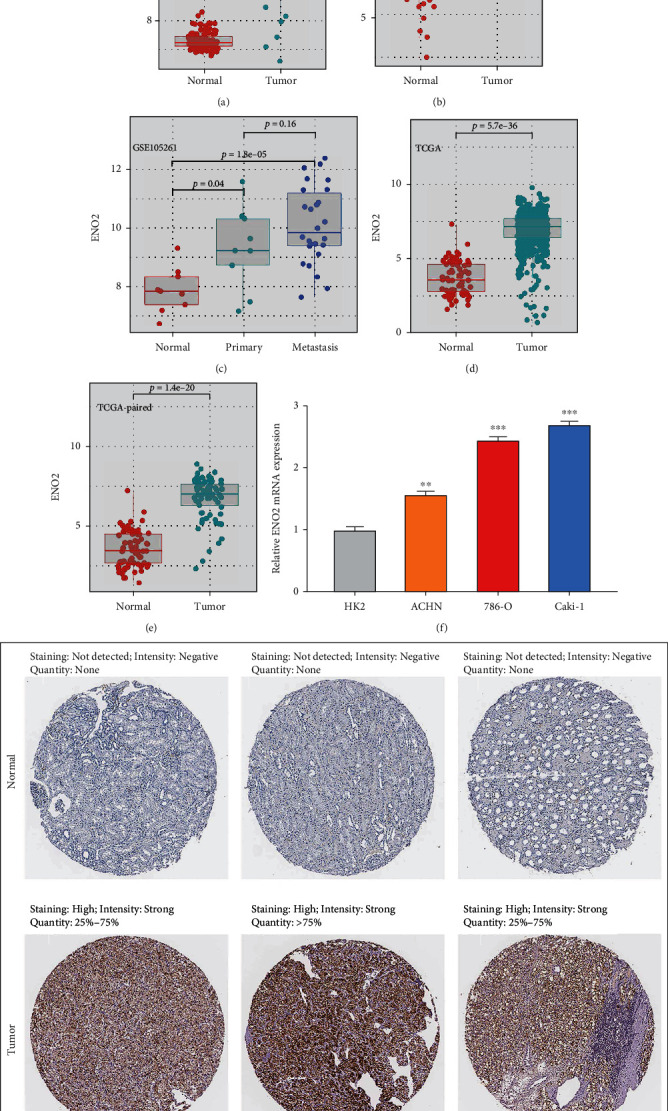
ENO2 was overexpressed in ccRCC tissues and cell lines. Notes: (a, b) ENO2 was upregulated in ccRCC tissues based on the GSE40435 and GSE53757 datasets. (c) ENO2 was also overexpressed in metastatic ccRCC tissues compared to the primary ccRCC tissues. (d, e) ENO2 was upregulated in ccRCC tissues based on the TCGA database. (f) ENO2 was upregulated in ccRCC cell lines compared to the normal HK-2 cell line. (g) Representative IHC images obtained from the HPA database showed an overexpressed pattern of ENO2 in ccRCC tissues.
3.3. ENO2 Was Associated with worse Clinical Features in ccRCC Patients
Next, we explored the association between ENO2 and the clinical features of ccRCC. Table 1 shows the detailed clinical features of ccRCC patients in TCGA. We found that ENO2 was correlated with worse Tumor (T) and Metastasis (M) stages according to the AJCC staging system (Figure 3(a)). The prognosis value of ENO2 was also explored with the overall survival (OS), disease-specific survival (DSS), and progression-free survival (PFI) set as endpoints. Results showed that high ENO2 expression correlated with worse OS and DSS (Figures 3(b) and 3(c)). Despite not being statistically significant, different KM curves were obtained for patients with high and low ENO2 expression, indicating that ENO2 could affect the PFI of ccRCC patients (Figure 3(d)). Moreover, receiver operating characteristic (ROC) curves showed a good prediction efficiency of ENO2 on patients prognosis (Figure 3(e): 1-year AUC = 0.603, 3-year AUC = 0.593, and 5-year AUC = 0.626; Figure 3(f): 1-year AUC = 0.601, 3-year AUC = 0.601, and 5-year AUC = 0.647; and Figure 3(g): and 1-year AUC = 0.554, 3-year AUC = 0.563, and 5-year AUC = 0.605).
Table 1.
Clinical features of patients included in our analysis.
| Characteristic | Number | Percentage (%) |
|---|---|---|
| Age | ||
| ≤60 | 266 | 49.5 |
| >60 | 271 | 50.5 |
| Gender | ||
| Female | 191 | 35.6 |
| Male | 346 | 64.4 |
| Grade | ||
| G1 | 14 | 2.6 |
| G2 | 230 | 42.8 |
| G3 | 207 | 38.5 |
| G4 | 78 | 14.5 |
| Unknown | 8 | 1.5 |
| Stage | ||
| Stage I | 269 | 50.1 |
| Stage II | 57 | 10.6 |
| Stage III | 125 | 23.3 |
| Stage IV | 83 | 15.5 |
| Unknown | 3 | 0.1 |
| T-classification | ||
| T1 | 275 | 51.2 |
| T2 | 69 | 12.8 |
| T3 | 182 | 33.9 |
| T4 | 11 | 2.0 |
| N-classification | ||
| N0 | 240 | 44.7 |
| N1 | 17 | 3.2 |
| Unknown | 280 | 52.1 |
| M-classification | ||
| M0 | 426 | 79.3 |
| M1 | 79 | 14.7 |
| Unknown | 32 | 6.0 |
Figure 3.
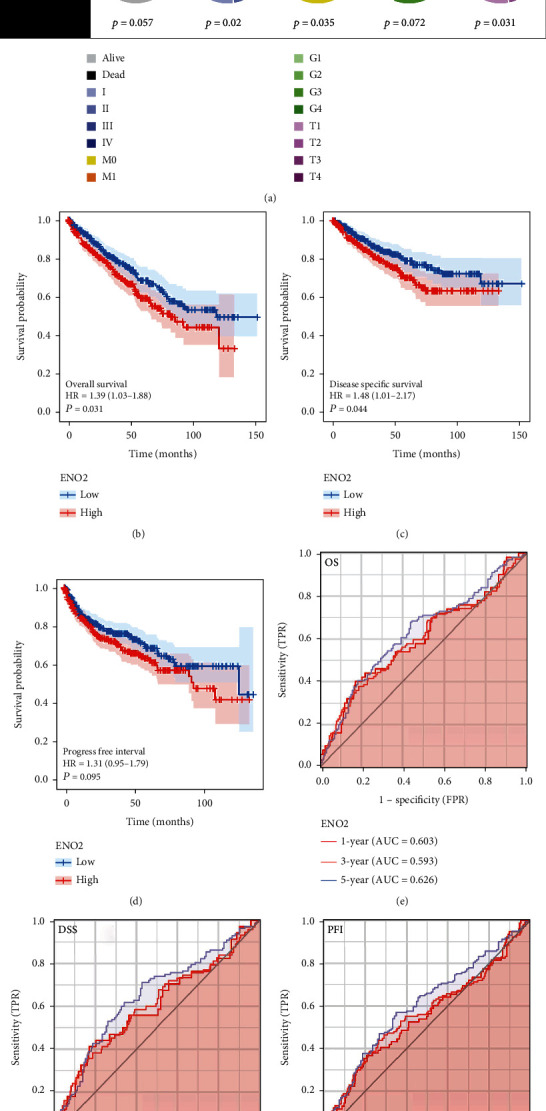
ENO2 was associated with worse clincical features and prognosis of ccRCC. Notes: (a) The ccRCC patients with higher ENO2 expression were significantly correlated with worse clinical features, including clinical stage and T and M stages. (b–d) The ccRCC patients with higher ENO2 expression tended to have a shorter OS, DSS, and PFI. (e–g) The ROC curve of OS, DSS, and PFI.
3.4. Inhibition of ENO2 Could Hamper Malignant Behaviors of ccRCC Cell
To explore the biological effect of ENO2 in ccRCC, we further knocked down ENO2 in 786-O and Caki-1 cells (Figure 4(a)). The knockdown efficiency of ENO2 in the protein level was also validated using the western blot assay (Figure S1). The sh-RNA#2 was used for further experiments for its highest knockdown efficiency. CCK8 and colony formation assay was then performed to evaluate the cell proliferation ability. The CCK8 assay showed that the cells in the ENO2 knockdown group had a lower OD value at 450 nm compared to the cells in the control group, indicating that inhibition of ENO2 could significantly reduce the proliferation ability of ccRCC cells (Figures 4(b) and 4(c)), consistent with findings in the colony formation assay (Figure 4(d)). The transwell assay showed that the knockdown of ENO2 could significantly hamper the invasion and migration ability of ccRCC cells (Figure 4(e)). In vivo experiments showed that the inhibition of ENO2 significantly hampered the growth of tumors in mice (Figure 4(f)). Also, immunohistochemistry indicated a higher ENO2-positive staining level in the mice tumor tissue inoculated with sh-NC cells (Figure 4(g)).
Figure 4.
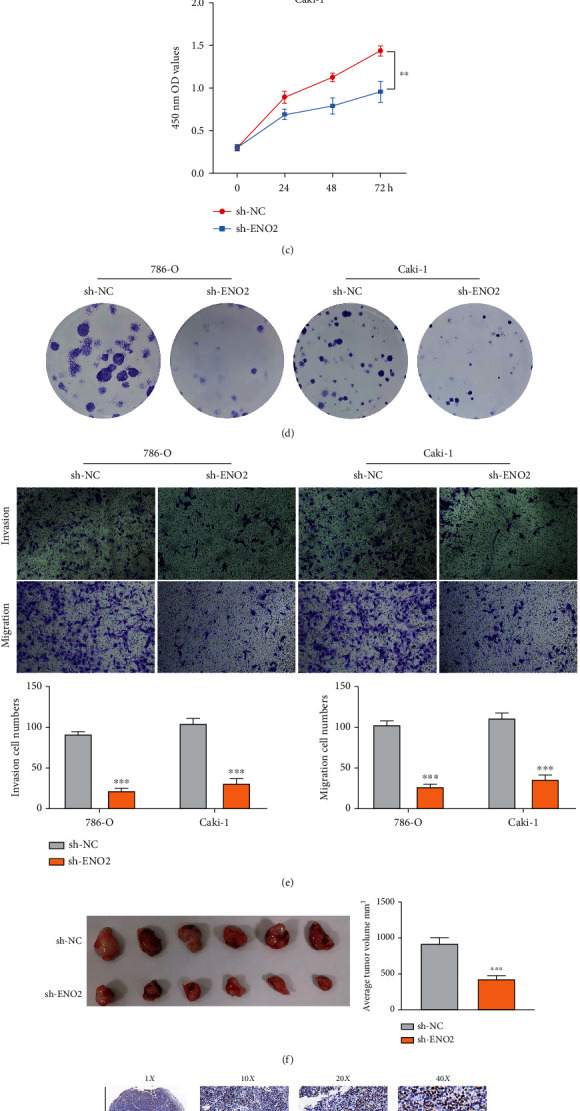
Inhibition of ENO2 can hamper malignant behaviors of ccRCC cell. Notes: (a) The knockdown efficiency of three designed shRNA were evaluated using qPCR assay, with results showing that shENO2#2 was the best. (b–d) CCK8 and colony formation assays indicated that ENO2 could significantly promote proliferation of ccRCC cells. (e) Transwell assay showed that ENO2 significantly promoted invasion and migration of ccRCC cells. (f) In vivo experiments showed that the knockdown of ENO2 remarkably lowered the growth of tumor in mice. (g) Immunohistochemistry showed a higher ENO2-positive staining level in the mice tumor tissue inoculated with sh-NC cells.
3.5. Pathway Enrichment and Immune Infiltration Analysis of ENO2
Furthermore, we performed GSEA and CIBERSORT analyses to explore the underlying mechanism of ENO2 in ccRCC. GSEA results indicated that epithelial-mesenchymal transition (EMT), KRAS signaling DN, inflammatory response, angiogenesis, hypoxia, and WNT/β-catenin pathways were upregulated in patients with high expression of ENO2 (Figure 5(a)). Meanwhile, the pathways of adipogenesis, DNA repair, and androgen response were downregulated in the high-expression group (Figure 5(b)). GO and KEGG analyses showed that ENO2 was significantly enriched in regulation of pH, inorganic cation homeostasis, and cell transmembrane transport (Figures 5(b) and 5(c) and Table 2). Moreover, immune infiltration analysis showed higher M2 macrophages and lower γβ T cells in the tumor microenvironment in patients with high ENO2 expression (Figures 6(a) and 6(b)).
Figure 5.
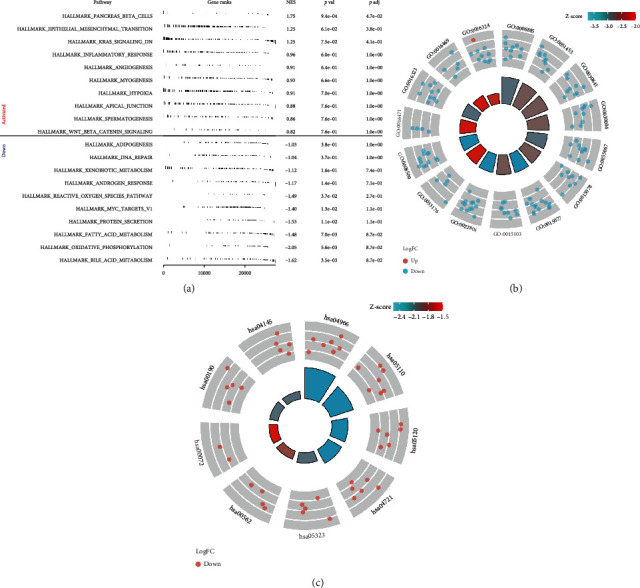
Pathway enrichment of ENO2 in ccRCC. Notes: (a) GSEA analysis of ENO2 in ccRCC. (b, c) GO and KEGG analyses of ENO2 in ccRCC.
Table 2.
Top terms of GO and KEGG analyses of ENO2.
| Pathway enrichment | Pathway ID | Description |
|---|---|---|
| GO | GO:0016324 | Apical plasma membrane |
| GO:0006885 | Regulation of pH | |
| GO:0051453 | Regulation of intracellular pH | |
| GO:0030641 | Regulation of cellular pH | |
| GO:0030004 | Cellular monovalent inorganic cation homeostasis | |
| GO:0055067 | Monovalent inorganic cation homeostasis | |
| GO:0015078 | Proton transmembrane transporter activity | |
| GO:0015077 | Monovalent inorganic cation transmembrane-transporter activity | |
| GO:0015103 | Inorganic anion transmembrane-transporter activity | |
| GO:0022804 | Active transmembrane-transporter activity | |
| GO:0033176 | Proton-transporting V-type ATPase complex | |
| GO:0008509 | Anion transmembrane-transporter activity | |
| GO:0016471 | Vacuolar proton-transporting V-type ATPase complex | |
| GO:0016323 | Basolateral plasma membrane | |
| GO:0016469 | Proton-transporting two-sector ATPase complex | |
| KEGG | Hsa04145 | Phagosome |
| Hsa04966 | Collecting duct acid secretion | |
| Hsa05110 | Vibrio cholerae infection | |
| Hsa05120 | Epithelial cell signaling in helicobacter pylori infection | |
| Hsa04721 | Synaptic vesicle cycle | |
| Hsa05323 | Rheumatoid arthritis | |
| Hsa00562 | Inositol phosphate metabolism | |
| Hsa00072 | Synthesis and degradation of ketone bodies | |
| Hsa00190 | Oxidative phosphorylation |
Figure 6.
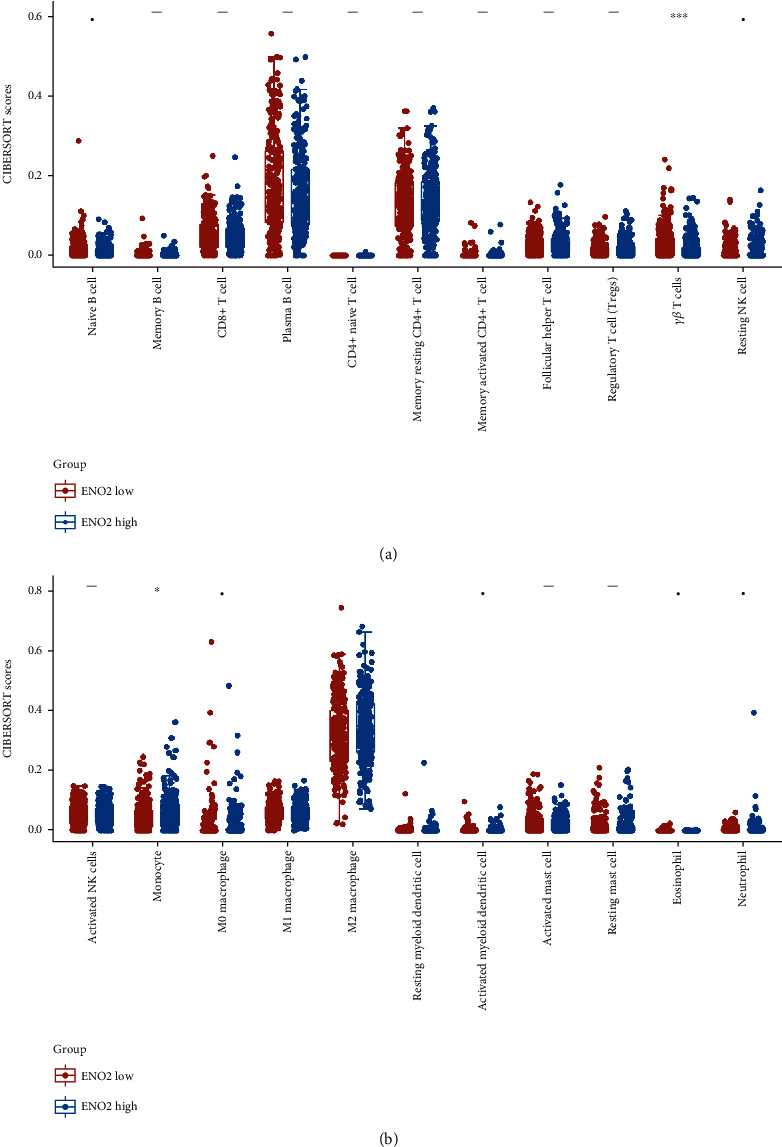
Immune infiltration analysis of ENO2 in ccRCC. Notes: (a, b) CIBERSORT algorithm was used to quantify the immune infiltration difference in low and high ENO2 expression patients.
3.6. ENO2 Is Associated with Immunotherapy and Chemosensitivity in ccRCC
Given that cancer immunotherapy is reportedly a promising therapeutic choice for ccRCC, we explored whether ENO2 could affect the immunotherapy sensitivity of ccRCC patients. Therefore, TIDE analysis was performed based on the expression profile data of ccRCC patients, in which patients with TIDE score < 0 were defined as immunotherapy responders, and patients with TIDE score > 0 were defined as immunotherapy nonresponders (Figure 7(a)). We observed a higher percentage of immunotherapy responders in the low ENO2 expression group compared to the high ENO2 expression group (Figure 7(b), 42.6% vs. 27.9%, P < 0.001). Subgroup analysis showed that patients with low ENO2 expression might be more sensitive to PD-1 therapy, while patients with high ENO2 expression might be more sensitive to CTLA-4 therapy (Figure 7(c)). Next, we explored the potential association between ENO2 and target drugs of ccRCC. Interestingly, analysis of the GDSC database showed that patients with high ENO2 expression exhibited lower chemosensitivity to common chemo drugs for ccRCC, including axitinib, cisplatin, gemcitabine, pazopanib, sunitinib, and temsirolimus (Figure 7(d)). It has been shown that ENO2 could induce cell glycolysis in multiple cancers [8, 11]. Given that glycolysis promotes cancer in most solid tumors, we speculate that ENO2 might exert a cancer-promoting effect in ccRCC by regulating glycolysis [13]. We further explored the correlation between ENO2 and several key molecules participating in glycolysis, hexokinase 1 (HK1), hexokinase 2 (HK2), and lactate dehydrogenase A (LDHA). Results showed a positive correlation between ENO2 and these molecules (Figure 7(e); HK1: r = 0.418, P < 0.001; Figure 7(f); HK2: r = 0.413, P < 0.001; and Figure 7(g); LDHA: r = 0.339, P < 0.001). Moreover, a positive correlation was found between ENO2 and quantified glycolysis activity (Figure 7(h); r = 0.153, P < 0.001).
Figure 7.
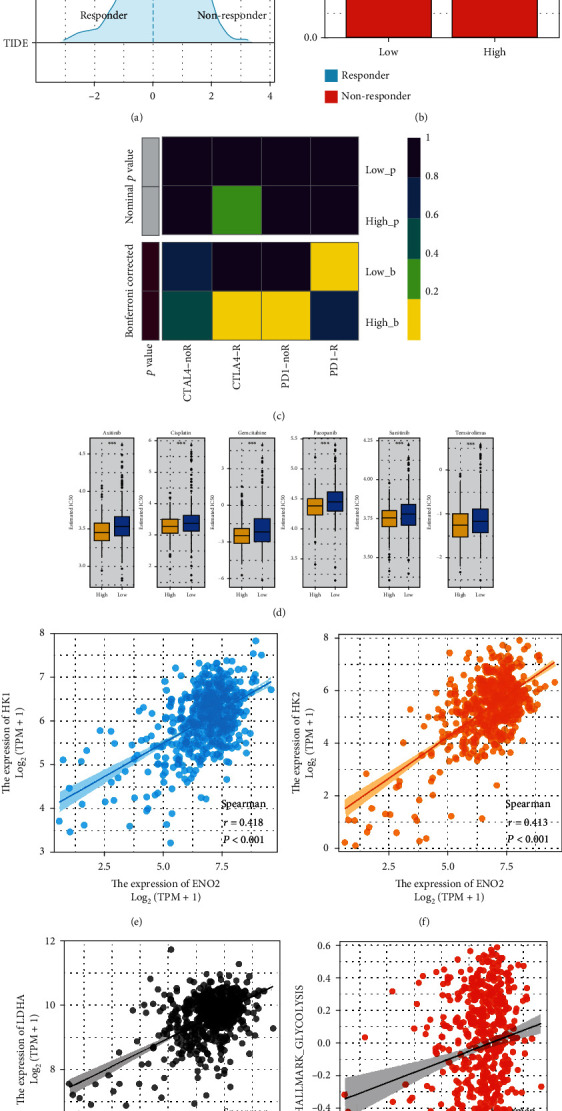
ENO2 was associated with immunotherapy and chemosensitivity in ccRCC. Notes:(a) TIDE score < 0 were defined as immunotherapy responders, whereas TIDE score > 0 were defined as immunotherapy nonresponders. (b) A higher percentage of immunotherapy responders in the low ENO2 expression group compared to the high ENO2 expression group. (c) Submap algorithm was performed to explore the difference in the immunotherapy response rate between low and high ENO2 expression patients, (d) Analysis of the GDSC database showed that patients with high ENO2 expression exhibited lower chemosensitivity to common chemo drugs for ccRCC. (e–g) The correlation between ENO2 and glycolysis-related genes, HK-1, HK-2, and LDHA. (h) The correlation between ENO2 and glycolysis activity.
4. Discussion
Notwithstanding that significant scientific inroads have been achieved in recent years, RCC remains a threatening public health issue globally, and ccRCC is the most common subtype [14]. Although surgery can effectively improve the prognosis of localized ccRCC patients, the five-year survival rate for patients with advanced stages remains poor. Therefore, there is an urgent need to identify new biomarkers associated with the diagnosis and treatment of ccRCC patients.
To the best of our knowledge, this is the first study to comprehensively explore the role of ENO2 in ccRCC. We found that ENO2 was highly expressed in ccRCC and correlated with worse clinical features in patients. Moreover, in vitro experiments found that ENO2 the inhibition of ENO2 could hamper the malignant behaviors of ccRCC cell. GSEA and immune infiltration analysis were also conducted to explore the biological difference between patients with high and low ENO2 expression. Moreover, ENO2 was associated with upregulated glycolysis activity and chemosensitivity of ccRCC. Our study refined the effect network of ENO2 in cancer and concluded that ENO2 is an underlying therapeutic target for ccRCC.
Pathway enrichment analysis is a powerful tool used to identify the underlying mechanisms of specific genes. In the present study, GSEA showed that the EMT process, KRAS signaling, inflammatory response, angiogenesis, and Wnt/β-catenin signaling pathways were significantly enriched in the high ENO2 expression group. It has been reported that EMT is a process during which epithelial cells acquire mesenchymal features, making cancer cells more invasive [15]. Fang et al. [16] found that huaier polysaccharide could hamper ccRCC progression by inhibiting the EMT process, thereby enhancing sunitinib therapeutic effects. In addition, Gorka et al. [17] demonstrated that zinc finger CCCH-type containing 12A could suppress the Wnt/β-catenin signaling pathway and modulate the EMT process to influence ccRCC progression. Moreover, KRAS signaling plays a cancer-promoting role in multiple cancers [18]. For instance, KRAS signaling is a critical driver in pancreatic cancer [19]. Wang et al. [20] revealed that miR-216b could downregulate KRAS expression at the post-transcriptional level in ccRCC and inhibit the proliferation and invasion of ccRCC cells. It has also been reported that angiogenesis is involved in the distant metastasis of cancers [21]. Cao et al. [22] showed that decylubiquinone could hamper the proliferation and metastasis of breast cancer cells by inhibiting angiogenesis mediated by the reactive oxygen species/p53/brain angiogenesis inhibitor 1 signaling pathway. G. Wang et al. [23] found that lncRNA MAGI2-AS3 could inhibit angiogenesis through interaction with transcription factor aminoacylase 1, further hampering ccRCC progression. Moreover, Q. Wang et al. [24] revealed that the NLR family, CARD domain containing 5 (NLRC5), could regulate ccRCC proliferation, migration, and invasion by modulating the Wnt/β-catenin signaling pathway. These pathways are potential biological pathways associated with ENO2. The oncogenetic effect of ENO2 might be achieved by affecting the activity of the above pathways. Future studies on ENO2 should focus on interfering with the above pathways to identify the downstream mechanism.
The tumor immune microenvironment has an important impact on the malignant behavior of cancer cells through cell interaction [25]. Herein, immune infiltration analysis showed that ENO2 was positively correlated with M2 macrophages and negatively correlated with γβ T cells. Over the years, M2 macrophages have been reported to exert an immunosuppressive function in multiple cancers [26]. For example, Xie et al. [27] demonstrated that M2 macrophages could secrete chemokine (C-X-C motif) ligand 13 to promote ccRCC migration, invasion, and EMT. Martínez et al. [28] showed that overexpression of bone morphogenetic protein 4 could induce polarization of M2 macrophages, thereby facilitating proliferation, invasion, and migration of bladder cancer cells. Besides, Xu et al. [29] found that hexokinase 3 dysfunction could promote tumorigenesis and immune escape by upregulating the infiltration of monocytes/macrophages into the ccRCC microenvironment. Until now, the relationship between ENO2 and immune infiltration has been largely understudied. Overall, the correlation between ENO2 and specific immune cells indicates its underlying effect on the tumor microenvironment.
Furthermore, our results showed that ccRCC patients with higher ENO2 expression levels might be associated with upregulated glycolysis activity. Meanwhile, patients with high ENO2 expression might have lower chemosensitivity to the common chemotherapy drugs of ccRCC, including axitinib, cisplatin, gemcitabine, pazopanib, sunitinib, and temsirolimus. Glycolysis has been widely reported to facilitate ccRCC progression. Fang et al. [30] found that succinate dehydrogenase complex, subunit B, and iron-sulfur (Ip) could inhibit ccRCC progression by suppressing glycolysis. In addition, Chen et al. [31] demonstrated that the non-POU domain containing octamer-binding-transcription factor binding to IGHM enhancer 3 fusion promotes aerobic glycolysis and angiogenesis by targeting hypoxia-inducible factor 1, alpha subunit in RCC. The positive correlation with glycolysis can be attributed to some extent to the cancer-promoting effect of ENO2 in ccRCC. Nowadays, much emphasis has been placed on individualized medical treatment. Interestingly, detecting ENO2 expression could indicate the difference in sensitivity of patients for specific therapy options. Moreover, for advanced patients with high ENO2 expression, CTLA-4 immunotherapy might be more appropriate than PD-1 therapy. Meanwhile, patients with high ENO2 expression tend to have a worse prognosis and higher potential for distant metastasis. For this patient population, a comprehensive postoperative follow-up is warranted.
Indeed, some limitations were present in this study. Firstly, bioinformatics data analyzed in the present study was obtained from western patients. Therefore, race bias was inevitable, which might affect the reliability of our findings to a certain extent and their generalization to non-Western populations. Moreover, the clinical data obtained from TCGA was incomplete. For example, data on the M stage of many patients was unavailable, which might affect the robustness of our conclusion to some degree.
5. Conclusion
Overall, this study revealed that ENO2 was overexpressed in ccRCC tissues and cell lines. In addition, ENO2 could significantly affect ccRCC progression and was associated with worse clinical features. GSEA analysis indicated that ENO2 might be involved in activating several oncogenic pathways. Immune infiltration analysis showed that patients with high ENO2 expression might have higher M2 macrophages and lower γβ T cells and monocytes in the tumor microenvironment. Moreover, bioinformatics analysis indicated that ENO2 was associated with the glycolysis process and chemosensitivity of ccRCC, thus, making it a potential therapeutic target for this patient population.
Acknowledgments
This study was supported by the Institute Level Project of HwaMei Hospital (2020HMKY40) and the Ningbo “Science and Technology Innovation 2025” Major Projects (Grant No. 2019B10062).
Data Availability
Detailed information is available from the corresponding author upon reasonable request.
Conflicts of Interest
The authors report no conflicts of interest in the work.
Supplementary Materials
Figure S1. Western blot was used to validate the knockdown efficiency of ENO2.
References
- 1.Jonasch E., Walker C. L., Rathmell W. K. Clear cell renal cell carcinoma ontogeny and mechanisms of lethality. Nature Reviews Nephrology . 2021;17(4):245–261. doi: 10.1038/s41581-020-00359-2. [DOI] [PMC free article] [PubMed] [Google Scholar]
- 2.Wettersten H. I., Aboud O. A., Lara P. N., Jr., Weiss R. H. Metabolic reprogramming in clear cell renal cell carcinoma. Nature Reviews Nephrology . 2017;13(7):410–419. doi: 10.1038/nrneph.2017.59. [DOI] [PubMed] [Google Scholar]
- 3.Makhov P., Joshi S., Ghatalia P., Kutikov A., Uzzo R. G., Kolenko V. M. Resistance to systemic therapies in clear cell renal cell carcinoma: mechanisms and management strategies. Molecular Cancer Therapeutics . 2018;17(7):1355–1364. doi: 10.1158/1535-7163.MCT-17-1299. [DOI] [PMC free article] [PubMed] [Google Scholar]
- 4.Ren X., Chen X., Ji Y., et al. Upregulation of KIF20A promotes tumor proliferation and invasion in renal clear cell carcinoma and is associated with adverse clinical outcome. Aging . 2020;12(24):25878–25894. doi: 10.18632/aging.202153. [DOI] [PMC free article] [PubMed] [Google Scholar]
- 5.Eremina M., Rozhon W., Yang S., Poppenberger B. ENO2 activity is required for the development and reproductive success of plants, and is feedback-repressed by AtMBP-1. The Plant journal : for cell and molecular biology . 2015;81(6):895–906. doi: 10.1111/tpj.12775. [DOI] [PubMed] [Google Scholar]
- 6.Isgrò M. A., Bottoni P., Scatena R. Neuron-specific enolase as a biomarker: biochemical and clinical aspects. Advances in Cancer Biomarkers . 2015;867:125–143. doi: 10.1007/978-94-017-7215-0_9. [DOI] [PubMed] [Google Scholar]
- 7.Wang Q., Chen C., Ding Q., et al. METTL3-mediated m6A modification of HDGF mRNA promotes gastric cancer progression and has prognostic significance. Gut . 2020;69(7):1193–1205. doi: 10.1136/gutjnl-2019-319639. [DOI] [PubMed] [Google Scholar]
- 8.Liu C. C., Wang H., Wang W. D., et al. ENO2 promotes cell proliferation, glycolysis, and glucocorticoid-resistance in acute lymphoblastic leukemia. Cellular Physiology and Biochemistry: International Journal of Experimental Cellular Physiology, Biochemistry, and Pharmacology . 2018;46(4):1525–1535. doi: 10.1159/000489196. [DOI] [PubMed] [Google Scholar]
- 9.Zheng Y., Wu C., Yang J., et al. Insulin-like growth factor 1-induced enolase 2 deacetylation by HDAC3 promotes metastasis of pancreatic cancer. Signal Transduction and Targeted Therapy . 2020;5(1):p. 53. doi: 10.1038/s41392-020-0146-6. [DOI] [PMC free article] [PubMed] [Google Scholar]
- 10.Tang C., Wang M., Dai Y., Wei X. Kruppel-like factor 12 suppresses bladder cancer growth through transcriptionally inhibition of enolase 2. Gene . 2021;769, article 145338 doi: 10.1016/j.gene.2020.145338. [DOI] [PubMed] [Google Scholar]
- 11.Sun C., Liu M., Zhang W., et al. Overexpression of enolase 2 is associated with worsened prognosis and increased glycikolysis in papillary renal cell carcinoma. Journal of Cellular Physiology . 2021;236(5):3821–3831. doi: 10.1002/jcp.30130. [DOI] [PubMed] [Google Scholar]
- 12.Wei Y., Chen X., Ren X., et al. Identification of MX2 as a novel prognostic biomarker for sunitinib resistance in clear cell renal cell carcinoma. Frontiers in Genetics . 2021;12, article 680369 doi: 10.3389/fgene.2021.680369. [DOI] [PMC free article] [PubMed] [Google Scholar]
- 13.Ganapathy-Kanniappan S., Geschwind J. F. Tumor glycolysis as a target for cancer therapy: progress and prospects. Molecular Cancer . 2013;12(1):p. 152. doi: 10.1186/1476-4598-12-152. [DOI] [PMC free article] [PubMed] [Google Scholar]
- 14.Capitanio U., Bensalah K., Bex A., et al. Epidemiology of Renal Cell Carcinoma. European Urology . 2019;75(1):74–84. doi: 10.1016/j.eururo.2018.08.036. [DOI] [PMC free article] [PubMed] [Google Scholar]
- 15.Pastushenko I., Blanpain C. EMT transition states during tumor progression and metastasis. Trends in Cell Biology . 2019;29(3):212–226. doi: 10.1016/j.tcb.2018.12.001. [DOI] [PubMed] [Google Scholar]
- 16.Fang L., Zhang Y., Zang Y., et al. HP-1 inhibits the progression of ccRCC and enhances sunitinib therapeutic effects by suppressing EMT. Carbohydrate Polymers . 2019;223, article 115109 doi: 10.1016/j.carbpol.2019.115109. [DOI] [PubMed] [Google Scholar]
- 17.Gorka J., Marona P., Kwapisz O., et al. MCPIP1 inhibits Wnt/β-catenin signaling pathway activity and modulates epithelial-mesenchymal transition during clear cell renal cell carcinoma progression by targeting miRNAs. Oncogene . 2021;40(50):6720–6735. doi: 10.1038/s41388-021-02062-3. [DOI] [PMC free article] [PubMed] [Google Scholar]
- 18.Uprety D., Adjei A. A. KRAS: from undruggable to a druggable cancer target. Cancer Treatment Reviews . 2020;89, article 102070 doi: 10.1016/j.ctrv.2020.102070. [DOI] [PubMed] [Google Scholar]
- 19.Waters A. M., Der C. J. KRAS: The critical driver and therapeutic target for pancreatic cancer. Cold Spring Harbor Perspectives in Medicine . 2018;8(9) doi: 10.1101/cshperspect.a031435. [DOI] [PMC free article] [PubMed] [Google Scholar]
- 20.Wang Y., Dong D., Jiang S., et al. miR-216b post-transcriptionally downregulates oncogene KRAS and inhibits cell proliferation and invasion in clear cell renal cell carcinoma. Cellular Physiology and Biochemistry: International Journal of Experimental Cellular Physiology, Biochemistry, and Pharmacology . 2018;49(5):1755–1765. doi: 10.1159/000493621. [DOI] [PubMed] [Google Scholar]
- 21.Viallard C., Larrivée B. Tumor angiogenesis and vascular normalization: alternative therapeutic targets. Angiogenesis . 2017;20(4):409–426. doi: 10.1007/s10456-017-9562-9. [DOI] [PubMed] [Google Scholar]
- 22.Cao J., Liu X., Yang Y., et al. Decylubiquinone suppresses breast cancer growth and metastasis by inhibiting angiogenesis via the ROS/p53/ BAI1 signaling pathway. Angiogenesis . 2020;23(3):325–3238. doi: 10.1007/s10456-020-09707-z. [DOI] [PubMed] [Google Scholar]
- 23.Wang G., Li H., Hou Y. LncRNA MAGI2-AS3 inhibits tumor progression and angiogenesis by regulating ACY1 via interacting with transcription factor HEY1 in clear cell renal cell carcinoma. Cancer Gene Therapy . 2022;29(5):585–596. doi: 10.1038/s41417-021-00339-z. [DOI] [PubMed] [Google Scholar]
- 24.Wang Q., Ding H., He Y., et al. NLRC5 mediates cell proliferation, migration, and invasion by regulating the Wnt/β-catenin signalling pathway in clear cell renal cell carcinoma. Cancer Letters . 2019;444:9–19. doi: 10.1016/j.canlet.2018.11.024. [DOI] [PubMed] [Google Scholar]
- 25.Galluzzi L., Humeau J., Buqué A., Zitvogel L., Kroemer G. Immunostimulation with chemotherapy in the era of immune checkpoint inhibitors. Nature Reviews Clinical Oncology . 2020;17(12):725–741. doi: 10.1038/s41571-020-0413-z. [DOI] [PubMed] [Google Scholar]
- 26.Locati M., Curtale G., Mantovani A. Diversity, mechanisms, and significance of macrophage plasticity. Annual Review of Pathology . 2020;15(1):123–147. doi: 10.1146/annurev-pathmechdis-012418-012718. [DOI] [PMC free article] [PubMed] [Google Scholar]
- 27.Xie Y., Chen Z., Zhong Q., et al. M2 macrophages secrete CXCL13 to promote renal cell carcinoma migration, invasion, and EMT. Cancer Cell International . 2021;21(1):p. 677. doi: 10.1186/s12935-021-02381-1. [DOI] [PMC free article] [PubMed] [Google Scholar]
- 28.Martínez V. G., Rubio C., Martínez-Fernández M., et al. BMP4 induces M2 macrophage polarization and favors tumor progression in bladder cancer. Clinical Cancer Research . 2017;23(23):7388–7399. doi: 10.1158/1078-0432.CCR-17-1004. [DOI] [PubMed] [Google Scholar]
- 29.Xu W., Liu W. R., Xu Y., et al. Hexokinase 3 dysfunction promotes tumorigenesis and immune escape by upregulating monocyte/macrophage infiltration into the clear cell renal cell carcinoma microenvironment. International Journal of Biological Sciences . 2021;17(9):2205–2222. doi: 10.7150/ijbs.58295. [DOI] [PMC free article] [PubMed] [Google Scholar]
- 30.Fang Z., Sun Q., Yang H., Zheng J. SDHB suppresses the tumorigenesis and development of ccRCC by inhibiting glycolysis. Frontiers in Oncology . 2021;11, article 639408 doi: 10.3389/fonc.2021.639408. [DOI] [PMC free article] [PubMed] [Google Scholar]
- 31.Chen Y., Yang L., Liu N., et al. NONO-TFE3 fusion promotes aerobic glycolysis and angiogenesis by targeting HIF1A in NONO-TFE3 translocation renal cell carcinoma. Current Cancer Drug Targets . 2021;21(8):713–723. doi: 10.2174/1568009621666210412115026. [DOI] [PubMed] [Google Scholar]
Associated Data
This section collects any data citations, data availability statements, or supplementary materials included in this article.
Supplementary Materials
Figure S1. Western blot was used to validate the knockdown efficiency of ENO2.
Data Availability Statement
Detailed information is available from the corresponding author upon reasonable request.