Abstract
Automated diagnostic techniques based on computed tomography (CT) scans of the chest for the coronavirus disease (COVID-19) help physicians detect suspected cases rapidly and precisely, which is critical in providing timely medical treatment and preventing the spread of epidemic outbreaks. Existing capsule networks have played a significant role in automatic COVID-19 detection systems based on small datasets. However, extracting key slices is difficult because CT scans typically show many scattered lesion sections. In addition, existing max pooling sampling methods cannot effectively fuse the features from multiple regions. Therefore, in this study, we propose an attention capsule sampling network (ACSN) to detect COVID-19 based on chest CT scans. A key slices enhancement method is used to obtain critical information from a large number of slices by applying attention enhancement to key slices. Then, the lost active and background features are retained by integrating two types of sampling. The results of experiments on an open dataset of 35,000 slices show that the proposed ACSN achieve high performance compared with state-of-the-art models and exhibits 96.3% accuracy, 98.8% sensitivity, 93.8% specificity, and 98.3% area under the receiver operating characteristic curve.
Keywords: COVID-19 recognition, Capsule network, Lung infections, Chest CT scan, Deep learning, Feature sampling
1. Introduction
The novel coronavirus disease (COVID-19), triggered by the severe acute respiratory syndrome coronavirus 2, has become a global pandemic over the last two years [1,2]. Despite the adoption of different forms of emergency response and targeted governance policies, the number of confirmed cases continues to increase rapidly. As of June 2022,1 more than 520 million people have been infected with COVID-19, with approximately 6.28 million deaths [3]. By October, the new data are as follows, 6,470,473 deaths have occurred, and the number of cases of infected people has increased to 600,216,125, indicating that 574,235,609 may have recovered.
Reverse transcription polymerase chain reaction (RT-PCR) testing is the quickest way to diagnose COVID-19 [4]. However, such tests involve certain drawbacks, particularly a high possibility of false negatives. Hence, their capacity to diagnose COVID-19 in the early stages of the disease is limited [5]. Recently, computed tomography (CT) images have played a vital role in COVID-19 diagnosis [6,7]; in previous studies, patients whose chest CT scans indicated typical COVID-19 symptoms yielded negative RT-PCR results [8]. However, accurately extracting slices to diagnose COVID-19 from many CT images is challenging. Diagnosing COVID-19 from CT scans requires professional expertise and extensive clinical experience because many other lung diseases exhibit similar features. Therefore, the development of an effective, accurate, and fast diagnostic tool is critical.
Artificial-intelligence-based models have been successfully employed in the field of medical imaging analysis, particularly for detecting COVID-19. Extensive research [[9], [10], [11], [12], [13], [14], [15], [16]] has shown the automatic diagnosis of COVID-19 by using medical scanning images has excellent potential. Recently, Heidarian et al. [17] proposed a network architecture called CT-Caps based on 3D convolutional neural networks (CNNs) and designed to extract features from 3D CT by using a capsule network; they adopted the max pooling sampling method to obtain the last feature map. The feature maps were then input into a fully connected layer for case classification. However, the following problems remain to be solved in the field of COVID-19 diagnosis from CT images using CT-Caps networks.
-
●
The existing capsule network only processes each slice individually. When COVID-19 patients have multiple minor lesion areas scattered between different CT slices, the capsule network mistakenly extracts features from low-value slices because it cannot identify the most critical and representative slice. This causes false negative results for some patients with pathological changes.
-
●
The existing method uses a max pooling method to sample the feature map, focuses only on the most active local information, and directly discards other information. For patients with multiple lesion regions, the active information only represents parts of the lesion regions. Hence, discarding a substantial amount of information may lead leads to misclassification.
Therefore, to diagnose COVID-19 rapidly faster and more precisely, critical distinctions between slices should be established by combining all CT slices, and the maximum amount of information should be extracted from as many key slices as possible. In the process of sampling the feature information graph, global information should be retained, and excessive information loss avoided. These approaches can be expected to lead to better classification results. In this study, we propose an attention capsule sampling network (ACSN) to detect COVID-19 from CT images by using key slices enhancement and a key pooling sampling method. Our proposed approach is designed to solve the two aforementioned problems. The contributions of this study are summarized as follows.
-
●
To solve the problem that low-value slices may be mistakenly used as key slices for detection, we propose a key slices enhancement method that assigns different attention levels to different slices through a squeezing and excitation network and attention on key slices. This helps the network obtain high-value lesion information and achieve accurate classification.
-
●
To address the problem that max pooling sampling only focuses on a portion of the information of feature maps and discards a large amount of information directly, we present a required key pooling sampling method that uses the advantages of the max pooling sampling and average pooling sampling methods to obtain feature maps that focus on local and global information. In addition, the method retains all lesion information to a certain extent.
-
●
We combine the two aforementioned methods to propose the ACSN as a new network structure designed to solve the problems of CT-Caps [17]. The ACSN is evaluated on the COVID-CT-MD dataset [18], which consists of patient CT information and clinical information collected in 2020. In a direct experimental comparison, the ACSN considerably outperforms existing state-of-the-art (SOTA) methods, and it reduces the occurrence of incorrect diagnoses effectively. The proposed approach is designed to serve as a tool for clinicians to diagnose COVID-19.
The remainder of this paper is structured as follows. Section 2 presents the relevant literature and some background. Section 3 introduces the proposed ACSN in detail. Section 4 describes the experimental setup and results. Section 5 introduces some extended discussions. Finally, the last section summarizes our findings and provides some possible future research directions.
2. Related work and background
2.1. COVID-19 detection technology
COVID-19 has proven to be one of the most severe threats to humans. Various advanced medical tools and facilities have been created to assist in the diagnosis of COVID-19, such as CT and X-ray imaging. Because of the versatility of CT screening methods and the ability to record three-dimensional lung views, CT is preferred over X-ray imaging. In general, because of the experiences with COVID-19 detection and lessons learned during the pandemic, developing more effective methods for diagnosing COVID-19 has remained an active research topic.
Several automatic detection systems have been developed to identify COVID-19 cases from images collected via CT scans. An algorithm named RF-SMA-SVM [19] was proposed to estimate the extent of COVID-19 infection; the main structures of the algorithm were a random forest classifier and a support-vector machine (SVM) model optimized by applying a slime-mold algorithm. The accuracy of this approach reached 90%. Kim and Jae [20] used various machine learning models to distinguish COVID-19 from pneumonia and performed grid searches to determine the best hyperparameters for each model. Finally, they confirmed that radioactive characteristics can be used as an index to distinguish COVID-19 from pneumonia. Ye et al. [21] proposed a method to extract features such as roughness and contrast from chest CT images to confirm the infected area and then extract an outline to detect lesions. Finally, the texture features and V-descriptors were fused to describe the severity of the disease. Ozturk et al. [22] proposed a deep neural network to automatically diagnose cases. Their proposed model has the advantage of being able to extract and segment features without using additional network structures. However, they used only a limited number of X ray scan images. In addition, Khan et al. [23] performed a multi classification test on chest radiographs using CoroNet, which was trained and tested on a finite dataset consisting of a few hundred images, and achieved an overall accuracy of 89.6% and an accuracy of 93%. Farhan et al. [24] proposed a model called SKICU-Net, which was designed to overcome the loss of information in dimension scaling by adding an extra hopping interconnection to the U-Net model. In addition, they introduced parallel convolution paths to a traditional DenseNet model to obtain a classification model. Their proposed approach achieved a score of 0.97 on segmentations tasks and an accuracy rate of 87.5%. Qi et al. [25] proposed an automatic deep learning pipeline, comprising four parts: lung segmentation, pathological slice selection, slice level prediction, and patient-level prediction. This method achieved 97.1% accuracy in lung segmentation, 98.1% accuracy in section, and 100% accuracy in patient-level diagnosis. Damasceno et al. [26] proposed a CNN structure to extract features from CT images and then used a tree structured Parzen estimator to optimize the hyperparameters of the network. The accuracy of their method was 99.7% and 98.9% on two datasets. Moreover, some methods that use other indicators have also been proposed. Shi et al. [27] created a functional design (EBSO SVM) for the early detection and classification of COVID-19 intensity using coagulation indices. This approach achieved an accuracy of 91.9195%, a Matthew correlation coefficient of 90.529%, sensitivity of 90.9912%, and specificity of 88.5705%.
However, all these methods have significant drawbacks. For example, they cannot capture the spatial relationships between image instances. As a result, CNNs cannot successfully recognize objects that are rotated or subjected to other types of transformation compared with the samples in the training dataset. Specifically, deep learning models perform better for images with limited variability, and their performance declines to some extent for complex images with high diversity.
Typically, the solution to such problems is to use a sufficiently large dataset that includes all possible positional and sequential transformations. However, obtaining sufficiently massive public datasets for most current diseases, including COVID-19, is challenging. To address this key problem, Hinton et al. [28] proposed a capsule network structure called CapsNet to solve the problem by capturing the “part-whole relationship.” It was designed to consider not only the existence of features, but also their directionality. Consequently, this method does not require a large amount of data.
2.2. Attention mechanisms
2.2.1. Principle of attention mechanisms
Based on the human nervous and visual systems, attention mechanisms have been applied to neural network models and have achieve good results. Attention mechanisms learn to focus attention on different parts of the data to strengthen necessary parts and weaken other parts to complete tasks more effectively. Specifically, the output of an attention-based network is processed via weighting to complete the intended task. These models have the advantage of showing the relationship between parts in terms of weight.
2.2.2. Implementation of attention mechanism
In 2017, Girshick et al. [29] first applied this method to the visual field and achieved promising results. In 2017, Vaswani et al. [30] proposed a transformer structure to enable the rapid development of attention network models. In recent years, attention networks have been used to design networks for computer vision (CV)-related problems, and the Vit-transformer and Swin-transformer architectures have achieved good results.
2.2.3. Expansion of attention mechanism
Although the original transformer network was designed for natural language processing problems, it has been applied in other fields. A network called a visual converter suitable for CV tasks [31] was proposed, and excellent results were achieved by abandoning the previous system and relying completely on an encoder-decoder architecture. This network has contributed significantly to the development of attention mechanisms. As of 2022, the converter remains a SOTA approach. Other attention modules have also been developed for image processing, such as SK Attention [32] and ECA-Net [33], which use information collected from convolution operations to identify areas that should be considered more important. Hu et al. [34] studied the importance of comparing different convolution channels and proposed a compressed excitation block to adaptively recalibrate the characteristic response in the channel direction. Subsequently, the convolutional block attention module was designed to focus on both space and channel [35] to adaptively refine features. These results indicate the considerable prospects for the further development of attention mechanisms in learning systems.
2.3. Segmentation methods
The U-Net was proposed in 2015 and has been used extensively in diverse medical image segmentation tasks. Many researchers have proposed targeted improvements to the U-Net architecture to obtain U-net models designed to achieve better results for different problems. In 2015, Ronneberger et al. [36] first proposed the U-Net structure, which was used to segment images of cells under electron microscopy and achieved excellent results in the International Symposium on Biomedical Imaging competition that year. The network can improve the efficiency of visual recording. The advent of the U-Net has facilitated research on medical image segmentation tasks.
Existing segmentation methods for CT images mainly include lung and lesion region segmentation. Focusing on the segmentation problem of the lung region, Hoffman et al. [37] used the classical model and several other new models (ResU-net, extended residual network-Dmur22, and Deeplabv3+) to test segmentation capabilities. Finally, the segmentation speed and effectiveness of all networks were reported, and the U-Net (R231CovidWeb) exhibited better performance and speed than the other models. The structure of the model was a classical U-net architecture, and the database used for training comprised several different databases, including a COVID-19 database from a dataset called “MedSeg” which includes 100 CT images of patients with COVID-19 with lung region markers. The classical U-net was trained to obtain a new network called U-Net (R231CovidWeb).
In this study, we use the U-Net (R231CovidWeb) model with a CT scan image as input, and the input scale is adjusted from the default size of 572 572 to a special size of 512 512 pixels. For the output, the model returns the lung tissue after removing the unimportant and artifact areas. We also standardize and adjust the step size for the database in this study. More specifically, the final output image is standardized between 0 and 1 to facilitate the generalization and effective convergence of the model. We modify the output size as per reference [38] for testing. Specifically, we adjust the output image size to 256 256 pixels instead of the typical 388 388 to reduce the complexity and internal storage requirements.
3. Proposed methods
In this study, we propose the ACSN model to automatically examine COVID-19 by using chest CT scans. Fig. 1 shows the overall network structure of the ACSN. The network involves the following stages: lung segmentation, primary feature sampling, key slices enhancement, key feature sampling, and fully connected layer classification stages. In the first stage, the model uses the U-Net (R231CovidWeb) architecture to segment lung regions shown in CT slices. A preliminary feature map is obtained in the second stage based on the capsule network. This stage uses the proposed key slices enhancement method to calculate the importance of each part of the feature set to help the model focus on slices that are more important for the detection task and obtain a new weighted feature map. The fourth stage uses the proposed key pooling sampling method to fuse the enhanced feature maps and obtains a more comprehensive feature map by focusing on the active and background information. Finally, classification of the feature maps as “exhibiting COVID-19” or as “negative” is performed using a fully connected network.
Fig. 1.
Overall framework diagram of ACSN.
Head and tail CT images typically exhibit few or no lung regions and, thus, have little effect on the classification. We chose to use 108 slices in the middle of each scan to reduce the calculation time.
3.1. Key slices enhancement method
The existing capsule network defaults to considering all slices of a given patient as equally important, which does not achieve satisfactory results because the importance of different slices varies in practice. When a large amount of data must be processed, focusing on more key slices can solve the problem more effectively. Therefore, we propose a key slice enhancement method to improve the performance of the network on COVID-19 detection tasks. The key slices enhancement method is designed to make the most representative and informative slices more active to assist in the detection task. The specific operational process and the meaning of the formula are described below.
The 3D attention network first accepts the initial feature map obtained from the capsule network and then compresses its features to obtain a low-dimensional feature map, which is denoted as s1 in Fig. 2 . In addition, we named the initial feature map as model1, which contains the important feature information extracted from the original CT slice. The size of the feature graph is h*w*n1, and each group of h*w corresponds to an original slice, as shown in Fig. 2. Each slice in s1 corresponds to the information of each initial slice, and s1 can thus be used to obtain the importance of different slices. The specific process is implemented by compressing the feature map of h*w*n1 into a feature map of 1*1*n1, and h and w are respectively used to represent the height and width of the feature graph. In this study, they were 32 and 16, and n1 was 108, which indicates the number of slices. The calculation formula is as follows.
| (1) |
Fig. 2.
Key slices enhancement method.
The next step is to generate the attention of each slice. The main purpose of this process is to calculate the importance of each slice in s1 through the fully connected layers, determine the location of the key slices through the fully connected layer network and finally obtain an importance array called s2, as shown in Fig. 2. The generation of importance depends mainly on the two fully connected layers in the attention network, with an activated ReLU layer between the layers. The most critical operation is to reduce the dimensions in the first fully connected layer. This enables more nonlinear processing to be added and complex correlations between slices to be fitted and can reduce the number of parameters and calculations required.
The second fully connected layer performs dimensionality recovery to obtain the importance of each component in the classification task, with the importance normalized between 0 and 1 using a sigmoid function. The above processes of attention generation and dimension recovery are summarized as . The final generated importance is represented as an array of size 1*1*n1, named s2, and is calculated as follows,
| (2) |
Here s1 represents the compressed feature map described earlier. Parameters w and b are used in the fully connected layers and are obtained after training. The ReLU and sigmoid functions are the activation functions of the two fully connected layers. Then, the new array, s2, which has the same format as s1, can be obtained.
Subsequently, the generated importance array is applied to the preliminary feature map by multiplying the importance arrays corresponding to the slices by the initial values in the corresponding preliminary feature map. Finally, the new feature map, Attention_m1 is obtained by applying more attention on the more important slices using the following formula,
| (3) |
| (4) |
Formula 3 shows the weighting process for a single slice. The main operation is multiplication between the scalar and the feature map ∈ , and c represents a serial number, represents the slice weight of the slice with subscript c, and Formula 4 shows that the weighted slices are combined to obtain the final weighted feature data.
3.2. Key pooling sampling method
Existing sampling methods mainly use max pooling, the main operation of which is to target each position of the feature map, extract the maximum value of that position on all channels, and finally combine them to obtain a new feature map of reduced dimensionality as shown in (5), (6). The input of Formula 5 is the value of all channels at position (h, w), with a size of 1 n1. Through the Max function, we compare the n1 values and determine the largest value as the output. The output data size is 1 1, representing the final eigenvalue determined from the position (h, w) of all slices. Formula 6 shows the composition of the maximum feature map. in these formulas.
| (5) |
| (6) |
The max feature focuses only on the most active positions in all channels. When combined with an actual problem, it should not be discarded directly because relatively inactive information is also valuable characteristic information. However, other problems arise if the average pooling sampling method is used to preserve most of this information. The average feature sampling takes the average of each location on all channels to obtain a new feature map, as shown in (7), (8). Therefore, the most important problem is that average pooling inhibits active information and strengthens background information, rendering the sampling process vulnerable to being misled by irrelevant information. The proposed key pooling sampling method fully exploits the advantages of max pooling sampling and average pooling sampling and is designed to avoid their negative impacts.
| (7) |
| (8) |
Formula 7 describes the method to find the average value of a single position. Formula 8 shows the composition of the average feature map.In these formulas, .
In the key pooling sampling method, as shown in Fig. 3 , the main operation is to use max pooling sampling and average pooling sampling to obtain two feature maps. The first of these is a partial active feature map: Max_m1. The other is the global feature map: Mean_m1. Then, we take 1/2 of these values and add them to obtain the last_feature map. This process of adding and dividing by two is denoted by , as shown in Formula 9.
| (9) |
Fig. 3.
Key pooling sampling method and subsequent structures of ACSN.
Subsequently, the last_feature maps are fed into a fully connected network layer comprising four fully connected layers to obtain patient patient-level COVID-19 diagnostic results.
4. Experiments and analysis
This section introduces the data sources and specific experimental methods used in this work, including the database, evaluation metrics, and the process used to train the model. We analyzed the problem-solving ability of the model through targeted experiments, ablation experiments and a quantitative evaluation.
4.1. Experimental setup
Extensive trials on lung CT scans of varying sizes were conducted using a DL GPU (Nvidia RTX2070) system with PyCharm and Python 3.6.2. (TensorFlow).
4.1.1. Introduction to the database
The dataset used in this study was released in 2021 and is called COVID-CT-MD [18]. The study included 169 COVID-19 patients, 60 CAP patients, and 76 normal patients. In COVID-CT-MD, an experienced radiologist detected and labeled slices with significant infection by analyzing 25 community-acquired pneumonia (CAP) and 55 COVID-19 patients. The COVID-19 patient data were collected from February to April 2020, which can more accurately reflect the early characteristics of COVID-19. To train the model more accurately and conveniently, in this study, we assume that all sections of CAP patients are sections without COVID-19 characteristics. The labeling process aimed to identify slices with significant COVID-19 lesions. The labeled data subset contained 4993 slices showing infection, whereas 18,416 slices showed no signs of infection. Details are presented in Table 1 .
Table 1.
Number of labeled patients and labeled slices in the dataset.
| Diagnosis | All Cases | Slices Marked case | Slices with Infection | Slice without infection |
|---|---|---|---|---|
| COVID-19 | 169 | 55 | 3779 | 4269 |
| CAP | 60 | 25 | 1172 | 2718 |
| Normal | 76 | 76 | 0 | 11429 |
The COVID-CT-MD dataset is available at the URL given in the footnote.2 Refer to Ref. [18] for more information on the imaging setup and detailed description of the dataset. For more specific settings and experimental results of this database, please refer to Ref. [40].
4.1.2. Evaluation indicators
To evaluate the ACSN model more effectively, we selected some widely used performance evaluation metrics such as accuracy (ACC), sensitivity, specificity, and area under the receiver operating characteristic curve (AUC).
| (10) |
| (11) |
| (12) |
The abbreviations in these equations are defined as follows. True positive (TP) indicates a sample that is predicted to show COVID-19, for which the patient actually had COVID-19. A true negative (TN) sample is predicted as not indicating COVID-19, and the patient did not have the disease. A false positive (FP) indicates a sample incorrectly predicted as positive. A false negative (FN) refers to a sample predicted as negative when the patient actually did have COVID.
4.1.3. ACSN training process
The initial feature sampling part of the ACSN is composed of a capsule network. The dataset used in capsule network training was composed of 18,000 slices marked by a doctor in COVID-CT-MD [18]. The corresponding tokens can be found in the Table titled “Slice-level-labels.” The Adam optimizer was used in the training process with a learning rate of 1.00E-04 and a batch size of 16,100 epochs.
For the subsequent key slices’ enhancement method, key pooling sampling method, and four full connection layers, all the data from the COVID-CT-MD dataset were used for training. The Adam optimizer was used in the training process, and we tested various batch sizes before finally selecting a value of 16; however, the initial learning rate was changed to 1.00E-03, and the corresponding epoch was changed to 500. The dataset was divided into two parts for training and testing with a ratio of 9:1.
We trained the ACSN and CT-CAPS models and show part of their training process in Fig. 4 . From Fig. 4, it may be observed that the final accuracy of ACSN was clearly higher than that of CT-CAPS, and the accuracy of CT-CAPS improved very slowly. In contrast, the accuracy of ACSN improved very quickly and slowed down over the last 100 epochs. These results show that the training process of ACSN is considerably superior to that of CT-CAPS.
Fig. 4.
Training process of 4.ACSN and CT-CAPS.
4.2. Analysis of the effects of the proposed key slices enhancement method
We also conducted comparative experiments to verify whether the key slices enhancement method helps the capsule network find slices that are more critical to the classification task.
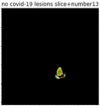
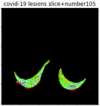
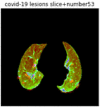
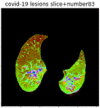
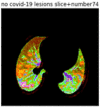
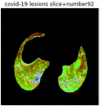
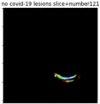
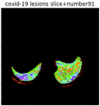
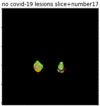
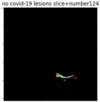
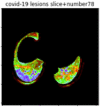
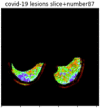
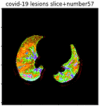
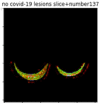
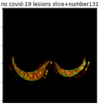
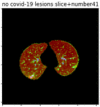
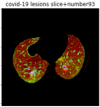
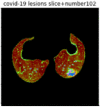
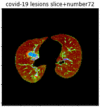
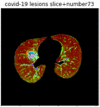
First, six batches of critical sites were detected from three patients using two methods. The capsule network method and the proposed key slices enhancement method were compared. The three COVID-19 patients were incorrectly diagnosed as COVID-negative when using the capsule network, and they were correctly detected as having COVID-19 after the key slices enhancement method was added. Table 2 lists the heat maps of the slices with the top five key degrees among the six batches of slices.
Table 2.
Heat map of the top five key slices selected from three patients by two methods.
| Activity top one | Activity top two | Activity top three | Activity top four | Activity top five | |
|---|---|---|---|---|---|
| Capsule Network |  |
 |
 |
 |
 |
| Ours | 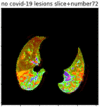 |
 |
 |
 |
 |
| Capsule Network |  |
 |
 |
 |
 |
| Ours | 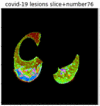 |
 |
 |
 |
 |
| Capsule Network | 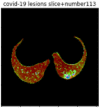 |
 |
 |
 |
 |
| Ours | 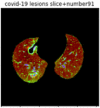 |
 |
 |
 |
 |
In this study, the use of “pathological slices” and “key slices” renders the implementation of the method more convenient and accurate. As the name implies, pathological slices contain pathological information. The specific judgment refers to the slice-marking files in the database. The slice with more sampling times in the subsequent sampling process of the model is considered the key, and the formula used to calculate its degree of sampling is given as follows:
| (13) |
The higher the sampling degree of this slice, the more critical it is. If the critical slice is a pathological slice, the ability of the model to sample pathological information is improved.
As shown in Table 2, when we rely only on the capsule network to search for key slices, the obtained key slices do not contain rich information about lung lesions. For example, in the first patient, slices with the first, second, and fourth levels of activity determined by the capsule network contained only a small amount of lung information and even less information about COVID-19 lesions. For example, for the second patient, the slices with the second, fourth, and fifth levels of activity were the same and did not contain sufficient information about lesions. Simultaneously, for the third patient, the slices with the second, third, and fourth levels of activity may contain more information than those of the first two patients. However, these slices contained relatively little helpful information compared with the overall condition.
Overall, the key slices selected by the capsule network exhibited an obvious shortcoming. That is, most were low-value slices in a conventional perspective.
By observing the heat maps that we obtained by our method, we found some notable characteristics when key slices enhancement methods were used to look for key slices. That is, the key slices selected after using key slices enhancement methods largely included more lung tissue, and most of them were found to have pathological information (the database contains slice-level tags, and the category of slices was marked in the images). This means that key slices enhancement methods consider these slices as critical for categorizing tasks, and this result fits our conventional perception.
Table 3 lists and compares the proportion of pathological slices in the two batches of key slices obtained earlier. The results of this study are shown in bold.
Table 3.
Proportion of pathological slices in the key slices group. The first line shows the proportion of pathological slices found only using the capsule network, and the second line shows the proportion after the key slice enhancement method was used in the capsule network. The results of this study are presented in bold font.
| Methods | Test indicators | COVID-19 | COVID-19 | COVID-19 |
|---|---|---|---|---|
| Capsule network | Lesion slices ratio | 40.2% | 66.7% | 57.4% |
| Predicted results | Normal | Normal | Normal | |
| Capsule + key slices enhancement (Our) | Lesion slices ratio | 46.8% | 67.5% | 66.8% |
| Predicted results | COVID-19 | COVID-19 | COVID-19 |
Table 3 reveals that the proportion of pathological sections is significantly increased after the use of key feature enhancement. In particular, for Patient 3, the increase is nearly 10%. This means that for Patient 3, most of the key slices selected were pathological slices. This indicates that after the key feature enhancement method was used, the network was able to correctly identify more pathological slices as key slices that were helpful for the classification task.
Furthermore, performance tests were executed on the entire database for both methods. The experimental results are listed in Table 4 and show that the key slices enhancement method improves the performance of the capsule network in all aspects. The results of this study are presented in bold.
Table 4.
Classification results of the two methods on the entire database.
| Accuracy (%) | Sensitivity (%) | Specificity (%) | |
|---|---|---|---|
| Capsule | 89.8 | 94.6 | 83.7 |
| Capsule + key slices enhancement (Our) | 96.3 | 98.8 | 93.3 |
Two points can be summarized from the above data and analysis.
-
●
As shown in Table 2, the proposed key slices enhancement method in this study increased the weight of slices with large lung areas and more pathological information, which means that more sampling processes were carried out on these slices in the subsequent sampling process. However, this also narrows the sampling range to some extent. Overall, it may be observed from Table 2 that the model was able to complete the classification task more accurately after using the key slices enhancement method.
-
●
After analyzing the proportion of pathological sections in the overall critical sections, we found that after using the key slices enhancement method, the network was able to find more pathological slices as key slices, which means that the pathological information in the key slices group was also improved.
Therefore, the network can find more effective slices as key slices using the key slices enhancement method.
4.3. Analysis of the effects of the key pooling sampling method
Because the max pooling sampling method focuses only on the most active information for patients with multiple lesion areas, using the max pooling sampling method directly discards a large amount of pathological and global information. Therefore, we propose a key pooling sampling method to solve this problem. Section 3 describes the key pooling sampling method. In addition, we experimentally demonstrated that the key pooling sampling method can solve the problems of max pooling sampling. The details of the experiments are as follows.
Table 5 show two indicators, represent abstract and concrete aspects. The first is the slices utilization ratio, which is calculated by applying the following formula:
| (14) |
Table 5.
The ratio of the number of slices involved by the feature was extracted using three methods for all slices. Moreover, the categories of patients were predicted with three methods. In this study, Cap patients were classified as normal. The results of the proposed method are shown in bold.
| Methods | Test indicators | Covid-19 patient | Cap Patient | Covid-19 patient |
|---|---|---|---|---|
| Max pooling sampling | Slices utilization ratio | 30.1% | 37.1% | 43.4% |
| Predicted results | COVID-19 | COVID-19 | COVID-19 | |
| Average pooling sampling | Slices utilization ratio | 100% | 100% | 100% |
| Predicted results | Normal | Normal | Normal | |
| Key pooling sampling | Slices utilization ratio | 100% | 100% | 100% |
| Predicted results | COVID-19 | COVID-19 | COVID-19 |
This index refers to the proportion of the number of sampled slices to the total number of patient slices when the model is finally sampled. Different methods can be used to infer the degree of pathological information utilization based on the slice utilization rate. The second is the prediction result, which has a value of either COVID-19-positive or normal. This represents the result of predicting the same patient using different pooling sampling methods. However, there is no formula for this metric. These two indicators demonstrate the advantages and disadvantages of the three pooling sampling methods.
The number of sections used by these three patients accounted for only 30.1%, 37.1%, and 43.4% of the total sections. This means that although patients had a large amount of slice information, max pooling sampling only extracts part of this data for classification. Moreover, all other slices of information were discarded. Therefore, the second CAP patient incorrectly tested positive for COVID-19.
Similarly, Table 5 shows that the average pooling sampling method achieved 100% utilization of slices because every slice of information was used. However, ultimately two COVID-19 positive patients were identified as negative by the averaging pooling sampling method. At the same time, for the second CAP patient, the test results of the max pool sampling method were incorrect, but the detection results of the average pool sampling method were correct.
These experimental results show that the average pooling sampling method utilized all slices but could not find the most active and vital information. This capability is unique to the max pooling sampling method. Therefore, the proposed key pooling sampling method integrates the advantages of the two methods.
Fig. 5 shows the final feature images obtained using the three methods presented in Fig. 5(a) and (b). Fig. 5(c) shows the max, average, and key pooling sampling methods. Each graph shows a red box to mark the most important region with a significant influence on the classification results. It may be observed that although the key areas in Fig. 5(a) of the max pooling sampling and Fig. 5(b) of the average pooling sampling were largely in the same position, the specific size and content of each significant area differed. Specifically, the key areas in Figure (a) are more obvious. As depicted in (c), the output shown in Fig. 5 retains the obvious parts of (a) in Fig. 5 and (b) in Fig. 5 to some extent. This represents the ability of our approach to integrate the benefits of max pooling and average pooling sampling.
Fig. 5.
Final feature maps were obtained by using the three methods. The salient features are marked in the red box.
We also scaled the experiment to the entire database and obtained the results shown in Table 6 .
Table 6.
Three sampling methods used to test the entire database. The results of the proposed method are shown in bold.
| Method | Accuracy (%) | Sensitivity (%) | Specificity (%) |
|---|---|---|---|
| Max pooling sampling method | 89.8 | 94.6 | 83.7 |
| Average pooling sampling method | 88.7 | 90.8 | 88.3 |
| Key pooling sampling method | 89.9 | 92.4 | 86.4 |
In Table 6, we can see that when using the average pooling sampling method, some noticeable changes in the results compared with max pooling sampling method exist. First, the specificity of the results is enhanced. This represents an increase in the network's ability to detect healthy patients after successfully using all slices. Second, a significant decrease in sensitivity is observed. This means that the average pooling sampling method cannot obtain key information, which reduces the ability of the network to detect COVID-19. This shows that the average pooling sampling method is inadequate. Therefore, our proposed key pooling sampling method is designed to solve the problem more effectively. As indicated by the experimental results in Table 6, the accuracy of this method does not differ significantly from that of the other methods. However, the sensitivity and specificity of this method are between those of the other three. This means that the method successfully integrates the two traditional sampling methods. Therefore, the proposed ACSN algorithm exhibits three advantages. First, because the formula is very clear and only two steps are needed, our proposed approach is relatively easy to understand. Second, as presented in Table 6, the accuracy of our proposed method reaches 90%, and its sensitivity and sensitivity are at an intermediate level, which shows that it integrates the advantages of other methods to obtain a more comprehensive sampling ability. Finally, our proposed approach does not require the data for training, and it has good adaptability to most sampling problems and spreads well.
Therefore, the proposed key pooling sampling method inherits the ability of max pooling sampling to focus on key features and the ability of average pooling sampling to synthesize global information to achieve a more comprehensive analysis.
4.4. Ablation experiments
The proposed approach is designed to better extract the feature map information of patients using key slices enhancement and key pooling sampling methods. To demonstrate the contributions of each element of our proposed method, we conducted the ablation studies described in this section. This section lists the test results for four different networks on the same database, including 1) capsule network + max pooling sampling, 2) capsule network + key pooling sampling, 3) capsule network + key slices enhancement + max pooling sampling, and 4) capsule network + key slices enhancement + key pooling sampling (ACSN), and their specific performance is shown for comparison in Table 7 .
Table 7.
Results of ablation experiments.
| Method | Accuracy (%) | Sensitivity (%) | Specificity (%) | AUC (%) |
|---|---|---|---|---|
| Capsule Network + max pooling sampling (CT-Caps) [17] | 89.8 | 94.6 | 83.7 | 92.8 |
| Capsule Network + key pooling sampling | 89.6 | 92.4 | 86.4 | 92.2 |
| Capsule Network + key slices enhancement + max pooling sampling | 96.3 | 98.8 | 93.3 | 98.3 |
| Capsule Network + key slices enhancement + key pooling sampling (ACSN) | 97.7 | 97.1 | 98.5 | 99.4 |
As indicated in Table 7, when the key pooling sampling method is used to replace the max pooling sampling method, although the difference in accuracy between them is small, a large difference in sensitivity and specificity can be observed. The reasons for this result are described in the previous section.
When the key slices enhancement method in CT-Caps is used, the performance of the method is significantly improved. The specificity is improved by 10%, which indicates that the key slices enhancement effectively improves the ability of the capsule network to find the key slices.
Similarly, in the ACSN, all the metrics except sensitivity increase after replacing the max pooling sampling method with the key pooling sampling methods. This means that even though average pooling sampling in key pooling sampling reduces the network's ability to discover lesion information, the overall accuracy improves. Therefore, we conclude that the ACSN can identify patients with large-scale lesion information more easily.
4.5. Comparison with the most advanced existing method
To validate the performance of the ACSN model, we evaluated its performance on the COVID-CT-MD dataset and compared it with several other methods, as shown Table 8 .
Table 8.
Comparison of experimental results of different models.
| Performance | Accuracy (%) | Sensitivity (%) | Specificity (%) | AUC (%) |
|---|---|---|---|---|
| Resnet [39] | 81.6 | 96.4 | 62.8 | 82.5 |
| CT-Caps [17] a | 89.8 | 94.6 | 83.7 | 92.8 |
| Covid-Fact [40] b | 90.8 | 94.5 | 86.1 | 93.1 |
| Vaidyanathan et al. [41] | 88.2 | 83.6 | 91.9 | 90.4 |
| Wang et al. [42] c | 75.8 | 83.5 | 67.4 | 81.3 |
| Mohamed et al. [43] | 96.8 | 95.7 | 93.7 | 98.9 |
| ACSN(Ours) | 97.7 | 97.1 | 98.5 | 99.4 |
Clearly, the proposed ACSN model showed superior performance compared to other methods in all indicators compared with the results published by Covid-Fact [40] and Vaidyanathan [41]. Moreover, compared with the results of Mohamed et al.’s study [43], the ACSN model was not superior in all indicators but did surpass it in some regards, especially in terms of specificity, with 1.4% better results. This means that ACSN further reduces the possibility of false positives. Moreover, its accuracy and sensitivity were 0.9% and 3.8% better, respectively. Finally, we compared ACSN with CT-Caps [17] and found that the specificity, accuracy, and sensitivity of our ACSN were greater by 14.8%, 7.9%, and 2.5%, respectively. To summarize, the proposed ACSN model outperformed the existing SOTA method.
In addition, to demonstrate the performance of ACSN more intuitively, we show its specific confusion matrix in Table 9 . It may be observed that the classification ability of this model was more comprehensive, with only seven error cases.
Table 9.
Confusion matrix of ACSN.
| Forecast category | True category |
|
|---|---|---|
| Covid-19 | Cap + Normal | |
| Covid-19 | 164 | 2 |
| No covid-19 | 5 | 58 |
5. Discussion
We proposed an ACSN and introduced its main structures. We conducted an ablation study of the two new structures in the model to effectively illustrate the advantages of these two new structures, and the proposed ACSN achieved better results than previous SOTA methods in a direct comparison.
However, the ACSN has some limitations. First, it requires the number of slices of a single patient in the dataset to be more than 108. However, the number of slices captured may differ between hospitals, which significantly limits the adoption of the proposed method. Second, the proposed method can only divide samples into two categories, and the CAP cases in the database are considered as normal patients. Therefore, considering these two problems, we plan to conduct follow-up research. First, by dynamically extracting slice features, we plan to remove the restriction on the number of patient slices to enable the model be applied in a wider variety of hospital facilities. Second, we plan to improve the model from two categories to three or more classes to suit additional application scenarios.
The scope of potential applications of the proposed model extends to other abnormalities of lung CT images and the classification of COVID-19. Furthermore, it can quickly and accurately classify various diseases.
6. Conclusion
In this study, we proposed an ACSN to screen for COVID-19 quickly, accurately, and interpretably. First, we used the proposed key slices enhancement method to enhance the capacity of the network to discover key slices among many slices. We then used key pooling sampling methods to obtain as much key information as possible. We presented extensive experimental results to show that the ACSN can effectively classify COVID-19 by using CT to solve the problem of poor recognition for patients with multiple lesion regions by capsule network models. The experimental results also indicated that the key slices enhancement method is suitable for many tasks that require a large amount of data to achieve better performance. The key pooling sampling method is suitable for various scenarios that require reducing the dimensionality of high-dimensional features.
In future research, we plan to enhance the accuracy of the model in identifying COVID-19 patients by improving the feature extraction capability of individual slices or by using clinical information on each patient. The source code for this study is provided at https://github.com/shaowuliu/ASCN.
Declaration of competing interest
The authors declare that they have no known competing financial interests or personal relationships that could have appeared to influence the work reported in this paper.
Acknowledgments
This work was supported by the National Natural Science Foundation of China with grant No. 62207012, the National Social Science Foundation of China with grant No. AEA200013, the Natural Science Foundation of Hunan Province with grant No. 2020JJ5372, 2020JJ4434, and 2020JJ5368, the Scientific Research Projects of Department of Education of Hunan Province with grant No. 19A312 and 18C0005, the Key Research Project on Degree and Graduate Education Reform of Hunan Province with grant No. 2020JGZD025.
Footnotes
References
- 1.Wu F., Zhao S., Yu B., et al. A new coronavirus associated with human respiratory disease in China. Nature. 2020;579:265–269. doi: 10.1038/s41586-020-2008-3. [DOI] [PMC free article] [PubMed] [Google Scholar]
- 2.Cucinotta D., Vanelli M. WHO declares COVID-19 a pandemic. Acta Biomed.: Atenei Parmensis. 2020;91(1):157. doi: 10.23750/abm.v91i1.9397. [DOI] [PMC free article] [PubMed] [Google Scholar]
- 3.Dong E., Du H., Gardner L. An interactive web-based dashboard to track COVID-19 in real time. Lancet Infect. Dis. 2020;5(20):533–534. doi: 10.1016/S1473-3099(20)30120-1. [DOI] [PMC free article] [PubMed] [Google Scholar]
- 4.CDC Cdc diagnostic tests for covid-19. https://www.cdc.gov/coronavirus/2019-ncov/lab/testing.html [online] Available:
- 5.Ai T., Yang Z., Hou H., Zhan C., Chen C., Lv W., et al. Correlation of chest ct and rt-pcr testing in coronavirus disease 2019 (COVID-19) in China: a report of 1014 cases. Radiology. 2020;2(296):32–34. doi: 10.1148/radiol.2020200642. [DOI] [PMC free article] [PubMed] [Google Scholar]
- 6.Zhao W., Zhong Z., Xie X., et al. Relation between chest CT findings and clinical conditions of coronavirus disease (COVID-19) pneumonia: a multicenter study. AJR Am. J. Roentgenol. 2020;5(214):1072–1077. doi: 10.2214/AJR.20.22976. [DOI] [PubMed] [Google Scholar]
- 7.Bai H.X., Hsieh B., Xiong Z., Halsey K., Choi J.W., Tran T.M.L., et al. Performance of radiologists in differentiating covid-19 from non- covid-19 viral pneumonia at chest ct. Radiology. 2020;2(296):46–54. doi: 10.1148/radiol.2020200823. [DOI] [PMC free article] [PubMed] [Google Scholar]
- 8.Liu M., Zeng W., Wen Y., et al. COVID-19 pneumonia: CT findings of 122 patients and differentiation from influenza pneumonia. Eur. Radiol. 2020;10(30):5463–5469. doi: 10.1007/s00330-020-06928-0. [DOI] [PMC free article] [PubMed] [Google Scholar]
- 9.Fang M., He B., Li L., et al. CT radiomics can help screen the coronavirus disease 2019 (COVID-19): a preliminary study. Sci. China Inf. Sci. 2020;7(63):1–8. [Google Scholar]
- 10.Chen H.J., Chen Y., Yuan L., et al. 2020. Machine Learning-Based CT Radiomics Model Distinguishes COVID-19 from Other Viral Pneumonia. arXiv: [DOI] [PMC free article] [PubMed] [Google Scholar]
- 11.Li L., Qin L., Xu Z., et al. Using artificial intelligence to detect COVID-19 and community-acquired pneumonia based on pulmonary CT: evaluation of the diagnostic accuracy. Radiology. 2020;2(296):E65–E71. doi: 10.1148/radiol.2020200905. [DOI] [PMC free article] [PubMed] [Google Scholar]
- 12.Bai H.X., Wang R., Xiong Z., Hsieh B., Chang K., Halsey K., Tran T.M.L., Choi J.W., Wang D.-C., Shi L.-B., et al. Artificial intelligence augmentation of radiologist performance in distinguishing covid-19 from pneumonia of other origin at chest ct. Radiology. 2020;3(296):156–166. doi: 10.1148/radiol.2020201491. [DOI] [PMC free article] [PubMed] [Google Scholar]
- 13.Wang X., Deng X., Fu Q., et al. A weakly-supervised framework for COVID-19 classification and lesion localization from chest CT. IEEE Trans. Med. Imag. 2020;8(39):2615–2625. doi: 10.1109/TMI.2020.2995965. [DOI] [PubMed] [Google Scholar]
- 14.Ouyang X., Huo J., Xia L., et al. Dual-sampling attention network for diagnosis of COVID-19 from community acquired pneumonia. IEEE Trans. Med. Imag. 2020;8(39):2595–2605. doi: 10.1109/TMI.2020.2995508. [DOI] [PubMed] [Google Scholar]
- 15.Kang H., Xia L., Yan F., et al. Diagnosis of coronavirus disease 2019 (COVID-19) with structured latent multi-view representation learning. IEEE Trans. Med. Imag. 2020;8(39):2026–2614. doi: 10.1109/TMI.2020.2992546. [DOI] [PubMed] [Google Scholar]
- 16.Han Z., Wei B., Hong Y., et al. Accurate screening of COVID-19 using attention-based deep 3D multiple instance learning. IEEE Trans. Med. Imag. 2020;8(39):2584–2594. doi: 10.1109/TMI.2020.2996256. [DOI] [PubMed] [Google Scholar]
- 17.Heidarian S., Afshar P., Mohammadi A., et al. Proc. IEEE Conf. ICASSP 2021-2021 IEEE International Conference on Acoustics. Speech and Signal Processing; 2021. Ct-caps: feature extract-based automated framework for covid-19 disease identification from chest ct scans using capsule networks; pp. 1040–1044. [Google Scholar]
- 18.Afshar P., Heidarian S., Enshaei N., et al. COVID-CT-MD, COVID-19 computed tomography scan dataset applicable in machine learning and deep learning. Sci. Data. 2021;1(8):1–8. doi: 10.1038/s41597-021-00900-3. [DOI] [PMC free article] [PubMed] [Google Scholar]
- 19.Wu P., et al. An effective machine learning approach for identifying non-severe and severe coronavirus disease 2019 patients in a rural Chinese population: the wenzhou retrospective study. IEEE Access. 2021;9:45486–45503. doi: 10.1109/ACCESS.2021.3067311. [DOI] [PMC free article] [PubMed] [Google Scholar]
- 20.Kim Young Jae. Machine learning model based on radiomic features for differentiation between COVID-19 and pneumonia on chest X-ray. Sensors. 2022;22(17):6709. doi: 10.3390/s22176709. [DOI] [PMC free article] [PubMed] [Google Scholar]
- 21.Ye B., Yuan X., Cai Z., Lan T. Severity assessment of COVID-19 based on feature extraction and V-descriptors. IEEE Trans. Ind. Inf. Nov. 2021;17(11):7456–7467. doi: 10.1109/TII.2021.3056386. [DOI] [PMC free article] [PubMed] [Google Scholar]
- 22.Ozturk T., Talo M., Yildirim E.A., et al. Automated detection of COVID-19 cases using deep neural networks with X-ray images. Comput. Biol. Med. 2020;121(103792) doi: 10.1016/j.compbiomed.2020.103792. [DOI] [PMC free article] [PubMed] [Google Scholar]
- 23.Khan A.I., Shah J.L., Bhat M.M. CoroNet: a deep neural network for detection and diagnosis of COVID-19 from chest x-ray images. Comput. Methods Progr. Biomed. 2020;196(105581) doi: 10.1016/j.cmpb.2020.105581. [DOI] [PMC free article] [PubMed] [Google Scholar]
- 24.Sadik Farhan, Ghosh Dastider Ankan, Rashid Subah Mohseu, Mahmud Tanvir, Anowarul Fattah Shaikh. A dual-stage deep convolutional neural network for automatic diagnosis of COVID-19 and pneumonia from chest CT images. Comput. Biol. Med. 2022;(105806) doi: 10.1016/j.compbiomed.2022.105806. [DOI] [PMC free article] [PubMed] [Google Scholar]
- 25.Qqa B., Sqa B., Ywa B., Chen, et al. Fully automatic pipeline of convolutional neural networks and capsule networks to distinguish covid-19 from community-acquired pneumonia via ct images. Comput. Biol. Med. 2021;(105812) doi: 10.1016/j.compbiomed.2021.105182. [DOI] [PMC free article] [PubMed] [Google Scholar]
- 26.Carvalho E.D., Silva R.R.V., Araújo F.H.D., Rabelo R.A.L., de Carvalho Filho A.O. An approach to the classification of covid-19 based on ct scans using convolutional features and genetic algorithms. Comput. Biol. Med. 2021 doi: 10.1016/j.compbiomed.2021.104744. [DOI] [PMC free article] [PubMed] [Google Scholar]
- 27.Shi Beibei, Ye Hua, Asghar Heidari Ali, Zheng Long, Hu Zhongyi, Chen Huiling, Turabieh Hamza, Mafarja Majdi, Wu Peiliang. Analysis of COVID-19 severity from the perspective of coagulation index using evolutionary machine learning with enhanced brainstorm optimization. J. King Saud University Comput. Informat. Sci. 2020;34(8):4874–4887. doi: 10.1016/j.jksuci.2021.09.019. [DOI] [PMC free article] [PubMed] [Google Scholar]
- 28.Hinton G.E., Sabour S., Frosst N. International Conference on Learning Representations. ICLR; 2018. Matrix capsules with EM routing. [Google Scholar]
- 29.Wang X., Girshick R., Gupta A., et al. Proc. IEEE Conf. Proceedings of the IEEE Conference on Computer Vision and Pattern Recognition (CVPR) 2018. Non-local neural networks; pp. 7794–7803. [Google Scholar]
- 30.Vaswani A., Shazeer N., Parmar N., et al. Attention is all you need. Adv. Neural Inf. Process. Syst. 2017;30:5998–6008. [Google Scholar]
- 31.Dosovitskiy A., Beyer L., Kolesnikov A., et al. An image is worth 16x16 words: transformers for image recognition at scale. 2020. https://arxiv.org/abs/2010.11929 arXiv:
- 32.Li X., Wang W., Hu X., et al. Proc. IEEE Conf. Proceedings of the IEEE/CVF Conference on Computer Vision and Pattern Recognition (CVPR) 2019. Selective kernel networks; pp. 510–519. [Google Scholar]
- 33.Wang Q., Wu B., Zhu P., et al. Proc. IEEE Conf. 2020 IEEE/CVF Conference on Computer Vision and Pattern Recognition (CVPR) 2020. ECA-net: efficient channel attention for deep convolutional neural networks. [Google Scholar]
- 34.Hu J., Shen L., Sun G. Proc. IEEE Conf. Proceedings of the IEEE Conference on Computer Vision and Pattern Recognition. 2018. Squeeze-and-excitation networks; pp. 7132–7141. [Google Scholar]
- 35.Woo S., Park J., Lee J.Y., et al. Proc. IEEE Conf. Proceedings of the European Conference on Computer Vision. 2018. CBAM: convolutional block attention module; pp. 3–19. [Google Scholar]
- 36.Ronneberger O., Fischer P., Brox T. Proc. IEEE Conf. International Conference on Medical Image Computing and Computer-Assisted Intervention. 2015. U-net: convolutional networks for biomedical image segmentation; pp. 234–241. springer,cham. [Google Scholar]
- 37.Hofmanninger J., Prayer F., Pan J., et al. Automatic lung segmentation in routine imaging is primarily a data diversity problem, not a methodology problem. Eur. Radiol. Experimental. 2020;4(1):1–13. doi: 10.1186/s41747-020-00173-2. [DOI] [PMC free article] [PubMed] [Google Scholar]
- 38.Yang P., Clapworthy G., Dong F., et al. GSWO: a programming model for GPU-enabled parallelization of sliding window operations in image processing. Signal Process. Image Commun. 2016;47 332-245. [Google Scholar]
- 39.He K., Zhang X., Ren S., Sun J. 2016 IEEE Conference on Computer Vision and Pattern Recognition (CVPR) 2016. Deep residual learning for image recognition; pp. 770–778. [DOI] [Google Scholar]
- 40.Heidarian S., Afshar P., Enshaei N., et al. Covid-fact: a fully-automated capsule network-based framework for identification of covid-19 cases from chest ct scans. 2021. arXiv: [DOI] [PMC free article] [PubMed]
- 41.Vaidyanathan A., Guiot J., Zerka F., Belmans F., Van Peufflik I., Deprez L., Danthine D., Canivet G., Lambin P., Walsh S., Occhipinti M., Meunier P., Vos W., Lovinfosse P., Leijenaar R.T.H. An externally validated fully automated deep learning algorithm to classify COVID-19 and other pneumonias on chest computed tomography. ERJ Open Res. 2022 May 3;2(8) doi: 10.1183/23120541.00579-2021. 00579-2021. [DOI] [PMC free article] [PubMed] [Google Scholar]
- 42.Wang S., Kang B., Ma J., et al. A deep learning algorithm using CT images to screen for Corona virus disease (COVID-19) Eur. Radiol. 2021;31:6096–6104. doi: 10.1007/s00330-021-07715-1. [DOI] [PMC free article] [PubMed] [Google Scholar]
- 43.Abdel-Basset Mohamed, Hawash Hossam, Moustafa Nour, Osama M. Elkomy. Two-stage deep learning framework for discrimination between COVID-19 and community-acquired pneumonia from chest CT scans. Pattern Recogn. Lett. 2021;152:311–319. doi: 10.1016/j.patrec.2021.10.027. [DOI] [PMC free article] [PubMed] [Google Scholar]


