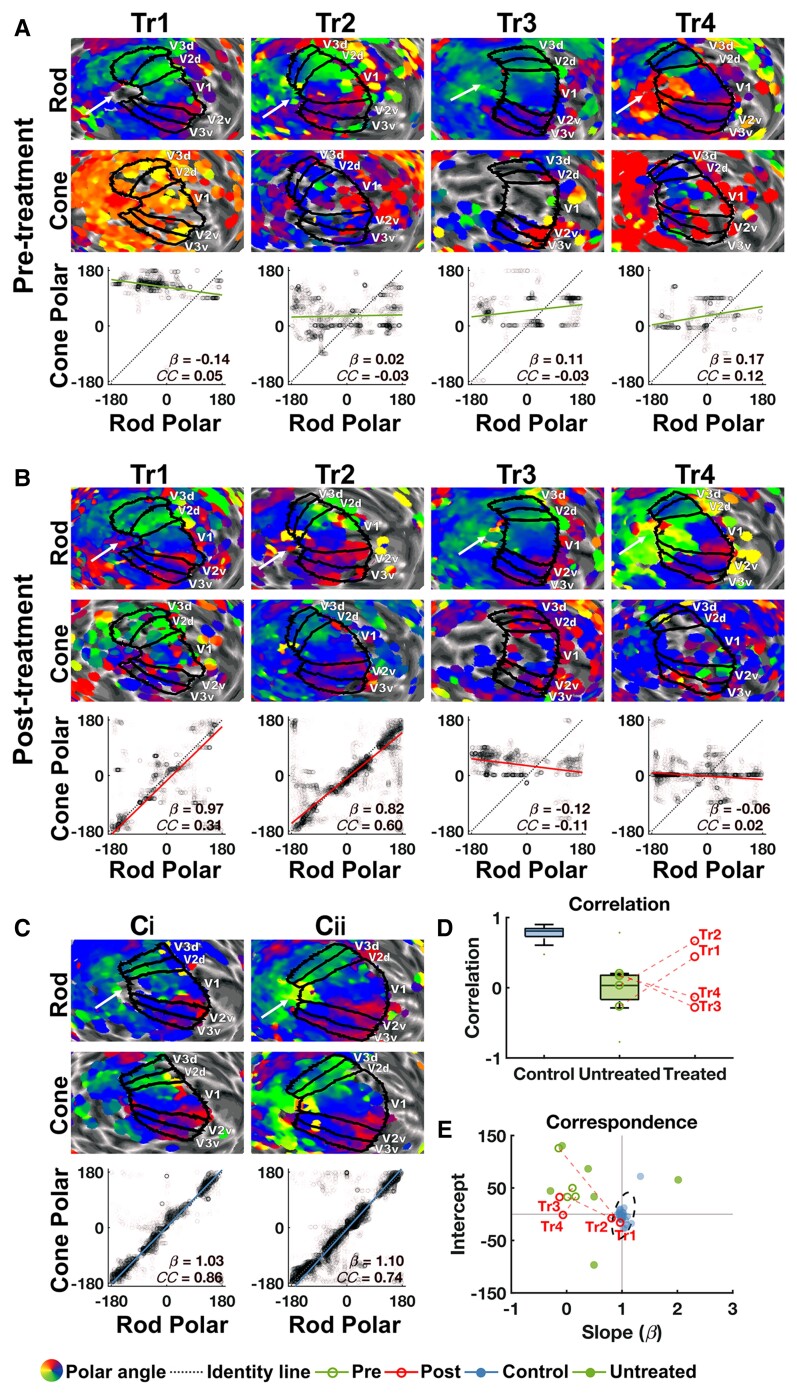
Figure 2.
Cone-mediated retinotopy in visual cortex. Cone-mediated versus rod-mediated polar angle measures in areas V1–3 in four treated patients (Patients Tr1–4) before (A) and after (B) gene therapy and in two age-matched normal-sighted controls (C). For polar angle maps in (A–C), rod- and cone-mediated estimates were projected onto the left hemisphere cortical surface, inflated to a sphere and overlaid with individual V1–3 labels (maps unthresholded for visualization). White arrow points towards the occipital pole; the arrow also indicates the direction of posterior to anterior. To test for cone-mediated retinotopic signals in visual cortex, rod-mediated polar angle estimates (x-axis) from left and right V1–3 are plotted against cone-mediated polar angle estimates (y-axis). If a cone map is present, data should cluster tightly around the identity line [dark blue dotted line; slope(β) = 1, intercept = 0], showing high correspondence and correlation across the two maps. Solid lines indicate the orthogonal linear regression fit to these data for ACHM patients pre-treatment (green), post-treatment (red) and normal-sighted controls (light blue). β = slope of fitted line; CC = Fisher–Lee circular correlation coefficient. Prior to treatment, patients had a well-defined rod-mediated retinotopic map, but the cone-mediated map lacks discernible structure. After treatment, a cone-mediated retinotopic map emerged for Patients Tr1 and Tr2, with rod/cone map similarity measures now resembling those of two representative age-matched normal-sighted controls [C(i) and ii)]. (D) Fisher–Lee circular correlation coefficient between rod and cone maps for 26 normal-sighted controls (blue) and 13 untreated patients with ACHM (green). Data for treated Patients Tr1–4 are also plotted individually: pre- (open green circles) and post- (open red circles) measurements of each patient are connected by a dotted red line. (E) Slope and intercept of rod–cone correspondence are plotted for the same groups as in D. Intersection of solid lines (β=1, intercept = 0) indicates high spatial correspondence between the rod and cone maps. Data from all normal-sighted controls (blue solid circles) cluster around this point, with the dotted ellipse indicating the 95% range of these data. Data from all 13 untreated ACHM patients (green solid and open circles) fall outside the normal range, as expected when cone signalling is absent ('Retinotopic organization of cone-mediated maps' in the Supplementary material). One untreated ACHM patient (Patient Utr8) had a very large negative slope and intercept and is therefore not plotted here (Table 1 and Supplementary Fig. 6A). Pre- and post-treatment measures for Patients Tr1–4 (green and red open circles, respectively) are connected by a dotted red line. For both correlation (D) and correspondence (E) results, indices of cone polar angle map structure fall within the normal-sighted range for Patients Tr1 and Tr2 but not for Patients Tr3 and Tr4.

