

Abstract
Enteropathogenic Escherichia coli O125, the cause of infectious diarrheal disease, is comprised of two serogroups, viz., O125ab and O125ac, which display the aggregative adherence pattern with epithelial cells. Herein, the structure of the O-antigen polysaccharide from E. coli O125ac:H6 has been elucidated. Sugar analysis revealed the presence of fucose, mannose, galactose and N-acetyl-galactosamine as major components. Unassigned 1H and 13C NMR data from one- and two-dimensional NMR experiments of the O125ac O-antigen in conjunction with sugar components were used as input to the CASPER program, which can determine polysaccharide structure in a fully automated way, and resulted in the following branched pentasaccharide structure of the repeating unit: →4)[β-d-Galp-(1 → 3)]-β-d-GalpNAc-(1 → 2)-α-d-Manp-(1 → 3)-α-l-Fucp-(1 → 3)-α-d-GalpNAc-(1→, where the side chain is denoted by square brackets. The proposed O-antigen structure was confirmed by 1H and 13C NMR chemical shift assignments and determination of interresidue connectivities. Based on this structure, that of the O125ab O-antigen, which consists of hexasaccharide repeating units with an additional glucosyl group, was possible to establish in a semi-automated fashion by CASPER. The putative existence of gnu and gne in the gene clusters of the O125 serogroups is manifested by N-acetyl-d-galactosamine residues as the initial sugar residue of the biological repeating unit as well as within the repeating unit. The close similarity between O-antigen structures is consistent with the presence of two subgroups in the E. coli O125 serogroup.
Keywords: CarbBuilder, CASPER, lipopolysaccharide, NMR spectroscopy
Introduction
Escherichia coli is the most abundant of the facultatively anaerobic microbes in the gastrointestinal tract of mammals, colonizing human infants within hours of birth (Kaper et al. 2004). Both commensal and pathogenic strains of this bacterium have been identified in vertebrate hosts, birds, cheeses and several other environments (van Elsas et al. 2011), indicative of high ecological adaptability (Bergthorsson and Ochman 1998). While incompletely understood, the primary ecological niche of E. coli in mammals is the mucus layer of the gastrointestinal tract, ostensibly due to its proficient utilization of gluconate as a primary nutrient source.
Pathogenic E. coli strains are divided into “pathotypes” distinguishable by serotyping, analysis of lipopolysaccharide (O) and flagellar (H) antigens, and several of these are causative agents of diarrhea, cystitis, pyelonephritis and meningitis (Stenutz et al. 2006; Croxen et al. 2013; Liu et al. 2020). Of the six identified enteric pathotypes, enteropathogenic E. coli (EPEC) are associated with severe infections of the gastrointestinal tract in humans. The O125 serogroup, originally identified during a diarrheal outbreak in London in 1952 (Taylor and Charter 1952; Mc Naught 1956) has since been isolated from diarrheal patients worldwide (Croxen et al. 2013) and is recognized as a significant pathogenic EPEC serogroup by the World Health Organization. Recent studies have shown that E. coli O125 is comprised of two subgroups determined by O antigen variation, viz., E. coli O125ab and E. coli O125ac. (Freitas Do Valle et al. 1997) While the original O125 identified was of O125ab type, the O125ac has increasingly been isolated from diarrheal patients worldwide though it is as yet unclear how virulence determinants interplay with serotype in pathogenesis. E. coli O125ac strains are clinically termed atypical EPEC as they lack the discriminating adherence factor, EAF, yet display aggregative adherence to HeLa cells, in this case attributed to another gene, eaeA (Freitas Do Valle et al. 1997; Elias et al. 2002). Elucidation of the structure of the O antigen of this strain is of particular relevance to the understanding of its increasing geographical prevalence.
To this end, we have performed chemical analysis and NMR spectroscopy experiments, in conjunction with automated structure analysis using the computer program CASPER (Furevi et al. 2022), to determine the O-antigen structure of E. coli O125ac in an efficient way. Furthermore, chemical analysis and acquired NMR spectra of the O125ab polysaccharide were utilized in the analysis of the O-antigen structure, relying on information from the structural elucidation of the E. coli O125ac O-antigen.
Results and discussion
The two E. coli strains O125ab and O125ac were cultivated and extracted as previously described (Furevi et al. 2020) in order to obtain lipopolysaccharide (LPS) material. Initial 1H NMR spectra of the two LPS did not show any presence of O-acetyl groups with distinct resonances at ~2.1 ppm. A mild acidic delipidation, followed by dialysis of both strains, was performed to obtain the polysaccharide materials (PS). Sugar analysis of the E. coli O125ab and O125ac PS revealed fucose, mannose, glucose, galactose, galactosamine (Supplementary Fig. S1), but with a significantly lower amount of glucose in O125ac. All the identified sugar-residues had m/z fragmentation patterns corresponding to their alditol acetates counterparts (Jansson et al. 1976). The structure of the repeating unit (RU) of E. coli O125ab has been determined (Kjellberg et al. 1996) and consists of a hexasaccharide RU in which the fucose residue has the l absolute configuration and the remaining sugars have the d absolute configuration. As the gene sequences of the two strains, between galF and gnd, are closely similar or identical (DebRoy et al. 2016), we concluded that the sugar residues have the same absolute configurations in the PS of the two strains.
The 1H NMR spectrum of O125ac PS (Fig. 1a) showed resonances at δH 1.22, 2.07 and 2.05 each corresponding to three protons consistent with the methyl group of C6 in fucose and N-acetylation of the two galactosamine residues, respectively. In the spectral region 4.4–5.2 ppm six 1H resonances were present, but the 13C NMR spectrum (Fig. 1b) showed only five major peaks in the region 98–106 ppm where resonances from anomeric carbon nuclei reside; in total 34 resonances were observed including, inter alia, two from carbonyl carbons at δC 175.37 and 175.76. Taken together these results confirm a pentasaccharide RU containing two N-acetyl-d-galactosamine sugars.
Fig. 1.

(a) Diffusion-edited 1H NMR spectrum and (b) 13C NMR spectrum of the E. coli O125ac O-antigen polysaccharide.
The 1H,13C-HSQC NMR spectrum of the anomeric region of the O125ac PS (Fig. 2a) revealed five sugar residues that were annotated A–E based on descending 1H NMR chemical shifts. Moreover, the 2D NMR spectrum also showed two correlations at δH/δC 4.44/49.85 and 4.20/52.63 that are characteristic for amino-sugars, as well as a cross-peak at δH/δC 1.22/16.05 confirming the presence of the 6-deoxy sugar fucose in the repeating unit. As expected, the anomeric region of O125ab PS displayed correlations for six sugar residues in the region for anomeric resonances (Fig. 2b) and these were herein annotated A–E and G (for glucose); the 1H and 13C NMR chemical shifts obtained herein correlated well with the previously published data (Kjellberg et al. 1996).
Fig. 2.

Selected region of anomeric resonances in 1H,13C-HSQC NMR spectra from E. coli O125ac (a) and O125ab (b) O-antigen polysaccharides. Sugar residues are annotated A – E (E’) in order of decreasing 1H NMR chemical shifts, except for the additional glucose residue in O125ab that is annotated as G.
In structural determination of polysaccharides, the spectral resolution in 2D NMR spectra is essential in order to resolve and identify all or a sufficient number of cross peaks for spectral assignment as well as for input to computerized analysis methods. Correlations of 1H and 13C resonances are most commonly performed by 1H,13C-HSQC NMR experiments due to higher sensitivity of 1H nuclei although the 13C-detected 13C,1H-HETCOR experiment offers a good alternative, sensitivity permitting. To investigate ease of use and quality of 1H,13C-HSQC NMR spectra these were recorded using on the one hand aliasing in the F1 dimension and on the other by employing non-uniform sampling in the indirect dimension. The initial 1H,13C-HSQC NMR experiments of the O125ab and O125ac polysaccharides were used to map the cross-peaks of the resulting spectra and were carried out at a 1H frequency of 500 MHz covering 100 ppm with 256 data points and 140 ppm with 512 data points in the F1 dimension, respectively. To increase resolution in the indirect dimension, two approaches were carried out at 700 MHz, viz., first by recording the 1H,13C-HSQC spectrum of the O125ac PS using a narrower 13C spectral region of 30 ppm covered by 1k data points resulting in aliasing (Fig. 3a), since echo-antiecho gradient selection was used (Jeannerat 2011). In the second case, the spectrum (Fig. 3b) was recorded over 100 ppm using the same number of data points in the F1 dimension, but with non-uniform sampling (NUS) (Robson et al. 2019) set to 25 percent using a 13C T2 value of 0.1 s, based on transverse relaxation times for polysaccharides at elevated temperature and the same magnetic field strength of 16.4 T (Fontana et al. 2014). In both cases, the resulting acquisition time was ~0.1 s in the indirect dimension and the resolution was similar in the two data sets. Interpretation of the spectrum containing aliased cross-peaks requires calculation of the chemical shift from which the 13C resonance originates according to δ0 = δa ± n × SWppm where δ0 is the true chemical shift, δa is the apparent chemical shift and n is the unknown aliasing order (n = 1 herein) and SWppm is the spectral width in ppm (Jeannerat 2011). In the case of the NUS data, reconstruction of the full 2D data matrix is required prior to Fourier transformation (Mobli et al. 2012). In both spectra, all anticipated correlations can be identified (Fig. 3). The peak shape of the 1H,13C-correlations was not perturbed in the spectrum for which uniform sampling was employed and where aliasing took place whereas it was slightly perturbed in the spectrum where NUS was utilized, though the spectral appearance is straightforward in the latter case. The well-resolved 1H,13C-HSQC NMR spectrum of O125ac PS facilitated peak-picking to obtain the 1H,13C-correlations for subsequent use in determination of the structure of the RU of the polysaccharide.
Fig. 3.

Selected regions of the E. coli O125ac O-antigen polysaccharide: (a) an aliased and uniformly sampled 1H,13C-HSQC NMR spectrum covering 30 ppm in the F1 dimension, with aliased resonances annotated; (b) a non-uniformly sampled 1H,13C-HSQC NMR spectrum covering 100 ppm in the F1 dimension with a sampling coverage of 25 percent, where substitution positions in sugar residues are annotated.
Determination of the polysaccharide structure using sugar components and unassigned NMR data can be carried out by the computer program CASPER (Jansson et al. 2006; Lundborg and Widmalm 2011) as shown in Scheme 1. For the E. coli O125ac PS, the magnitude of 3JH1,H2 of anomeric protons in the 1D 1H NMR spectrum (1 small, 2 medium and 2 large) and chemical shifts from the 13C NMR spectrum were entered. From 2D NMR data correlations observed in 1H,1H-TOCSY, 1H,13C-HSQC, 1H,13C-H2BC, 1H,13C-HMBC spectra were used as input to the program (Supporting information) as well as 1JC1,H1 of anomeric nuclei (2 small and 3 large) from an F2-coupled 1H,13C-HSQC spectrum. Additional input that can be provided is information on sugar components, and if the Wzx/Wzy biosynthetic pathway can be anticipated (Ståhle and Widmalm 2019). The latter utilizes WecA resulting in either an N-acetyl-d-glucosamine or an N-acetyl-d-galactosamine at the reducing end of its biological repeating unit (BRU). This “biological rule” related to WecA should pertain to the E. coli O125ac O-antigen possessing four different sugar residues in its RU as seen from the sugar analysis. The NMR data from the above described experiments, the “activated” WecA rule in conjunction with l-Fuc, d-Man, d-Gal and two d-GalNAc as monosaccharide residues, along with all possible linkages available were used as input to the CASPER program using the module “determine glycan structure”.
Scheme 1.

Flowchart of the general workflow used for elucidation of polysaccharide structure using CASPER followed by 3D model building employing CarbBuilder.
Of the three highest ranked structures for the O125ac PS (Fig. 4) the top-two structures have four sugars in the backbone and one sugar in the side-chain of the RU, i.e. the most commonly observed topology (Liu et al. 2020), and the highest ranked structure contains the same glycosidic linkages as the O125ab PS, except for that of the α-d-Glc residue. The assigned experimental 1H and 13C NMR chemical shifts (vide infra) correlated quite well with the chemical shifts predicted by CASPER (Fig. 5), although chemical shift deviations were evident, e.g. H2, H3 and H4 of the →3)-α-d-GalpNAc-(1→ residue, which substitutes the →3,4)-β-d-GalpNAc-(1→ residue where branching takes place in the RU. This divergence of 1H chemical shifts is presumably due to a lack of model substances in the database for this vicinally disubstituted arrangement containing two N-acetyl-d-galactosamine residues, which may lead to a highly congested local structure in the polysaccharide.
Fig. 4.
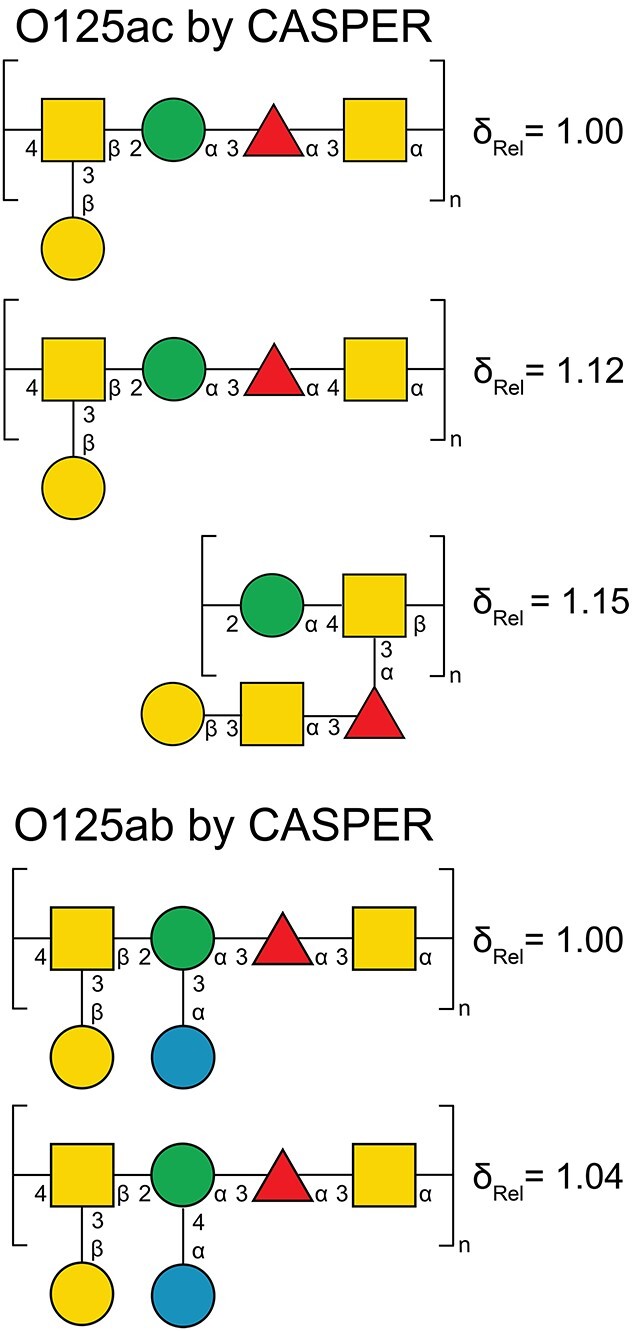
The highest ranked structures using the “determine glycan structure” module in CASPER for the O125ac (top) and the O125ab (bottom) O-antigen polysaccharides. The relative deviations between structures have been normalized by setting the top-ranked structure to unity.
Fig 5.

Comparison of 1H (top) and 13C (bottom) NMR chemical shifts predicted by CASPER versus assigned from NMR experiments for the O125ac O-antigen polysaccharide.
Similarly, unassigned NMR input data for the O125ab O-antigen obtained from the herein collected 1H,13C-HSQC NMR spectrum and from previously described 1H,13C-HMBC connectivities together with sugar components (Kjellberg et al. 1996), the “activated” WecA rule and information on determined linkage positions and anomeric configurations (as given above) present in the O125ac O-antigen structure were used to elucidate the O125ab O-antigen structure by CASPER, i.e. determining the linkage and anomeric configuration of the additional d-glucosyl residue (Fig. 4). This two-step process relies first on the structure of the O125ac O-antigen and then adding data to obtain the structure of the O125ab O-antigen, akin to the NMR structure determination of O-acetyl substitution in the O-antigen of Salmonella typhimurun O-factor 5 LPS relying on the O-antigen structure from S. typhimurun O-factor 4 (Ståhle and Widmalm 2017). However, it was not possible to fully utilize the outlined approach. Instead, when the sugar residue to which the glucosyl residue should be linked was restricted to the mannosyl residue using “unknown linkage position,” the highest ranked structure predicted by CASPER (Fig. 4) agreed with the previously elucidated O-antigen structure of E. coli O125ab (Kjellberg et al. 1996).
Complete assignment of NMR resonances (Table 1) was performed in order to confirm the suggested structure of the O125ac O-antigen polysaccharide, using herein a nomenclature referring to the residue by a capital letter, atom position in the sugar residue by a number, where the number may also correspond to a resonance from a 1H or 13C nucleus or a 1H/13C correlated pair. Analysis of 13C NMR chemical shifts showed absence of furanosides (Ritchie et al. 1975; (Beier et al. 1980) and that all sugar residues have the pyranoid ring-form (Jansson et al. 1989; Jansson et al. 1991) in the O125ac PS. The anomeric configuration of each sugar residue in the O125ac PS was assigned from the magnitude of 1JC1,H1 (Bundle and Lemieux 1976) observed in an F2-coupled 1H,13C-HSQC spectrum. Correlations for the anomeric nuclei corresponding to A1, B1 and C1 show 1JC1,H1 > 168 Hz, and these sugar residues thus have the α-anomeric configuration, whereas the correlations for D1 and E1 have 1JC1,H1 of 165 and 162 Hz, respectively, and consequently these sugar residues have the β-anomeric configuration. The 1H NMR chemical shifts of the anomeric resonances of the O125ac PS were resolved and identification of the sugar residues and whether they had a gluco/galacto- or manno-configuration was aided by an array of 1H,1H-TOCSY spectra using mixing times of 30, 60, 90, 120 and 200 ms.
Table 1.
1H and 13C NMR chemical shifts of the O-antigen from E. coli O125ac
| Sugar residue | 1 | 2 | 3 | 4 | 5 | 6 | Me | CO | |
|---|---|---|---|---|---|---|---|---|---|
| A | →2)-α-d-Manp-(1→ | 5.16 | 4.21 | 3.95 | 3.58 | 3.74 | 3.66, 3.90 | ||
| (−0.02) | (0.27) | (0.09) | (−0.10) | (−0.08) | |||||
| 100.08 [172] | 77.71 | 70.37 | 68.39 | 74.33 | 62.58 | ||||
| (5.14) | (6.02) | (−0.88) | (0.45) | (1.00) | |||||
| B | →3)-α-l-Fucp-(1→ | 5.11 | 3.89 | 4.02 | 3.97 | 4.18 | 1.22 | ||
| (−0.09) | (0.12) | (0.16) | (0.16) | (−0.02) | |||||
| 101.79 [172] | 68.46 | 77.98 | 72.42 | 67.88 | 16.05 | ||||
| (8.67) | (−0.63) | (7.68) | (−0.38) | (0.78) | (−0.28) | ||||
| C | →3)-α-d-GalpNAc-(1→ | 4.99 | 4.44 | 4.09 | 4.14 | 4.50 | ~3.80 | 2.07 | |
| (−0.29) | (0.25) | (0.14) | (0.09) | (0.37) | |||||
| 98.09 [174] | 49.85 | 76.38 | 69.27 | 70.90 | 60.82 | 23.01 | 175.37 | ||
| (6.14) | (−1.31) | (7.98) | (−0.27) | (−0.46) | (−1.29) | ||||
| D | →3,4)-β-d-GalpNAc-(1→ | 4.59a | 4.20 | 3.98 | 4.29 | 3.75 | 3.72, 3.74 | 2.05 | |
| (−0.09) | (0.30) | (0.21) | (0.31) | (0.03) | |||||
| 100.91 [165] | 52.63 | 78.94 | 74.43 | 76.31 | 61.29 | 23.36 | 175.75 | ||
| (4.62) | (−2.17) | (6.93) | (5.60) | (0.33) | (−0.60) | ||||
| E | β-d-Galp-(1→ | 4.45 | 3.54 | 3.63 | 3.93 | 3.66 | 3.77, 3.80 | ||
| (−0.08) | (0.09) | (0.04) | (0.04) | (0.01) | |||||
| 106.00 [162] | 71.55 | 73.48 | 69.64 | 75.90 | 61.97 | ||||
| (8.63) | (−1.41) | (−0.30) | (−0.05) | (−0.03) | (0.13) |
J C1,H1 are given in hertz in square brackets. 1H and 13C NMR chemical shift differences between experimental data and corresponding monosaccharides (Jansson et al. 1989) are displayed in parentheses.
J H1,H2 = 8.3 Hz.
In 1H,1H-TOCSY spectra A1 showed only one cross-peak to δH 4.21 at mixing times 30–120 ms, while at 200 ms, five correlations were observed, which indicated a spin-system from a sugar having the manno-configuration. From the resonance frequencies for B1 and C1 one cross-peak was detected at δH 3.89 and 4.44, respectively, for the shortest mixing time of 30 ms; longer mixing times of 60–200 ms revealed three correlations (H2–H4 from each sugar residue) indicating spin-systems from residues having the galacto-configuration. Arising from D1 and E1 two correlations were observed for each sugar residue when the shortest mixing time of 30 ms was used, viz., to δH 4.20 and 3.98 and to δH 3.54 and 3.63, respectively; in each of the spin systems, a third cross-peak was observed to δH 4.29 (D4) and to δH 3.93 (E4) when mixing times in the range 60–200 ms were used. The poorer transfer of magnetization in B1/C1 compared to D1/E1 is consistent with the former having the α-anomeric configuration and the latter, the β-anomeric configuration, in complete agreement with the results from 1JC1,H1 coupling constants of the sugar residues. This analysis also confirms the lack of a sugar residue having the gluco-configuration in the RU, and consequently the O125ac PS is devoid of a glucosyl residue in its O-antigen.
The spin-systems were thereafter fully assigned using a combination of 1H,13C-HSQC, 1H,13C-H2BC, 1H,13C-HMBC and 1H,13C-HSQC-TOCSY experiments; the two experiments with TOCSY transfer employed mixing times of 20 and 120 ms, respectively. Starting from A1 correlations were observed to δH/δC 4.21/77.71 (A2) via cross-peaks in both 1H,13C-H2BC and 1H,13C-HSQC-TOCSY spectra and further from A2 cross-peaks throughout the spin-system were observed due to large 3JH,H coupling constants from H2 and onward in mannosyl residues; combined with information form 1H,13C-H2BC spectra resonances from A3–A6 could thus be fully assigned.
The spin-system of the fucosyl residue was tied together starting from the methyl group resonance of the 6-deoxy sugar resonating at δH/δC 1.22/16.05 (B6) with subsequent correlations observed in the 1H,13C-H2BC and 1H,13C-HSQC-TOCSY spectra to δH/δC 4.18/67.88 (B5) as well as a 1H,13C-HMBC correlation due to 3JH6,C4 observed at δC 72.42 corresponding to B4. From anomeric positions C1 and D1 both display cross-peaks in the 1H,13C-H2BC spectrum to δH/δC 4.44/49.85 (C2) and δH/δC 4.20/52.63 (D2), respectively, the 13C NMR chemical shifts of which are characteristic of 2-amino-2-deoxy-sugars (Jansson et al. 1989). In the 1H,13C-BS-CT-HMBC spectrum correlations were observed between the resonance at δC 175.37 and C2, and from δC 175.75 to D2. Thus, residues C and D can be assigned to α-d-GalNAc and β-d-GalNAc, respectively.
The high resolution in the 13C dimension of the 1H,13C-HSQC and 1H,13C-HSQC-TOCSY (20 and 120 ms mixing times) spectra facilitated chemical shift assignments for the hydroxymethyl groups of residues A, C, D and E in both polysaccharides as well as the one in residue G of the O125ab PS to be fully assigned (Fig. 6). Interestingly, the proton chemical shifts of D6a and D6b were closely similar, δH 3.72 and δH 3.74, respectively, in the O125ac PS but showed a larger difference for the O125ab PS, viz., D6a and D6b having δH 3.72 and δH 3.82, respectively, presumably due to a change in the rotameric distribution of the ω (O5-C5-C6-O6) torsion angle of the branched →3,4)-β-d-GalpNAc-(1 → when the additional glucosyl group is present and linked to the mannosyl residue in the backbone of the polysaccharide. The NMR chemical shift assignments of hydroxymethyl groups of residues in the O125ab PS carried out herein complement the previous study (Kjellberg et al. 1996) and are given by δH6a/δH6b/δC6 3.66/3.90/62.60 (A), 3.79/3.81/60.80 (C), 3.72/3.82/61.09 (D), 3.77/3.79/61.98 (E) and 3.75/3.88/61.87 (G).
Fig. 6.

Selected regions with (a) multiplicity-edited 1H,13C-HSQC NMR spectrum of the O125ac O-antigen polysaccharide (correlations in black) overlaid with 1H,13C-HSQC-TOCSY spectra with mixing times of 20 (correlations in red) and 120 ms (correlations in green); (b) multiplicity-edited 1H,13C-HSQC NMR spectrum of O125ac PS with assigned correlations; (c) 1H,13C-HSQC NMR spectra of O125ab PS (correlations in black) overlaid with 1H,13C-HSQC-TOCSY spectra with mixing times of 20 ms (red) and 120 ms (green); (d) multiplicity-edited 1H,13C-HSQC NMR spectrum of O125ab PS with assigned correlations, where those from the glucose residue, G2-G5, are highlighted in blue. Note the different expansions in the 13C dimension of the of the spectral region related to hydroxymethyl groups (top) and cross-peaks related to ring-carbon resonances (bottom).
The linkage positions of the O125ac PS suggested by CASPER were confirmed experimentally by correlations observed in 1H,13C-HMBC and 1H,1H-NOESY spectra (Table 2, Figs 3b and 7a). Significant downfield 13C NMR chemical shift displacements in the range 5.6–8.0 ppm were observed for the linkage positions compared to their monosaccharide counterparts (Söderman et al. 1998), which further supported the position(s) of substitution in each sugar residue of the polysaccharide (Table 1).
Table 2.
Inter-residue correlations observed in 1H,1H-NOESY and 1H,13C-HMBC NMR spectra for the E. coli O125ac O-antigen polysaccharide
| Sugar residue | NOE | HMBCa | ||
|---|---|---|---|---|
| Atom | Correlations to | |||
| A | →2)-α-d-Manp-(1→ | H1,A | H3,B; H1,D | C3,B |
| B | →3)-α-l-Fucp-(1→ | H1,B | H3,C | C3,C |
| C | →3)-α-d-GalpNAc-(1→ | H1,C | H4,D; H6/H5,D | C4,D |
| D | →3,4)-β-d-GalpNAc-(1→ | H1,D | H2,A (H2,D) | C2,A |
| E | β-d-Galp-(1→ | H1,E | H3,D | C3,D |
Correlations were also observed for C1,C to H4,D and C1,D to H2,A (H2,D).
Fig. 7.

(a) Selected regions of a 1H,1H-NOESY NMR spectrum at 700 MHz with a 60 ms mixing time for the O125ac O-antigen polysaccharide. Trans-glycosidic or inter-residue correlations are annotated in bold; (b) selected regions of a 1H,1H-NOESY NMR spectrum at 700 MHz with a 60 ms mixing time for the O125ab polysaccharide along with a schematic representation of residues G and A. Observed correlations between atom pairs G1-G2 and G1-A3 are highlighted in blue and the one for A2-G5 is marked in red.
In addition, the 1H,1H-NOESY spectra of both O125ac (Fig. 7a) and O125ab showed a strong correlation between A5 and B4, which indicated an exo-anomeric conformation at the glycosidic linkage for the structural element →2)-α-d-Manp-(1 → 3)-α-l-Fucp-(1 → (A-B). In a polysaccharide model of the O125ac PS generated by CarbBuilder (Kuttel et al. 2016) with torsion angles ϕH = −40° and ψH = 0° for the A-B structural element had a distance of <3 Å between A5 and B4 consistent with the observation of a conspicuous cross-peak in the 1H,1H-NOESY spectrum (Fig. 7a, rightmost panel).
Analysis of the 1H,1H-NOESY spectrum of the O125ab PS whose RU contains an additional glucosyl residue (G) showed, besides from the expected trans-glycosidic linkage correlation, G1 to A3, an inter-residual correlation between A2 and G5 (Fig. 7b). Integration of cross-peak volumes in the 1H,1H-NOESY spectrum (700 MHz and mixing times of 60 and 150 ms) showed that G1-A3 < G1-G2 < G5-A2. Based on molecular model-derived proton-proton distances the structural element α-d-Glcp-(1 → 3)-α-d-Manp-(1→ displays a slightly different conformational preference compared to the similar structural element α-d-Galp-(1 → 3)-β-d-Manp-(1→ in the E. coli O188 O-antigen (Furevi et al. 2020) for which the corresponding NOEs were closely similar and the corresponding proton-proton pairs are approximately equidistant.
In the 1H,13C-HSQC NMR spectrum of the O125ac PS a cross-peak of low intensity was observed close to the cross-peak from the H1/C1 nuclei of side-chain galactose group (E), i.e. it was present at δH/δC 4.47/105.50 presumed to originate from a similar sugar residue denoted by E1’. The NMR chemical shifts of the low intensity cross-peak are in excellent agreement with predictions made by CASPER for the β-d-Galp-(1 → 3)-β-d-GalpNAc disaccharide structural element, i.e. δH/δC 4.48/105.50, thereby lending support to that this H1/C1 correlation in the spectrum arises from the terminal sugar residue in the O-antigen, consistent with a d-GalpNAc residue at the reducing end of the biological repeating unit (BRU). Furthermore, the number of RUs of the O-antigen polysaccharide was estimated by integration of the 13C resonances from the anomeric carbons of residues E1 and E1’ and was found to be ~15.
In the gene clusters of the O125 serogroups (Iguchi et al. 2015; DebRoy et al. 2016; Liu et al. 2020), the presence of manBC is consistent with the mannosyl residue in the polysaccharides. Furthermore, in the Wzx/Wzy biosynthetic pathway of O-antigen polysaccharides (Ståhle and Widmalm 2019), Gnu is responsible for converting Und-PP-GlcNAc to Und-PP-GalNAc when GalNAc is the initial sugar in the BRU and Gne isomerizes UDP-d-GlcNAc to UDP-d-GalNAc (Rush et al. 2010; Cunneen et al. 2013) The presence of two glucose 4-epimerases in the gene cluster of the O125 serogroup (Iguchi et al. 2015), presumably gnu and gne, is fully consistent with products thereof participating in the biosynthesis of an oligosaccharyl-PP-Und entity, which is then flipped into the periplasmic space and polymerized by the Wzy-Wzz complex (Ståhle and Widmalm 2019; Wiseman et al. 2021) prior to translocation and insertion into outer leaflet of the outer membrane by the Lpt pathway (Li et al. 2019; Owens et al. 2019). Furthermore, there are four putative GTs encoded between galF and gnd in the gene cluster of O125 (Iguchi et al. 2015), viz., wetD, wetE, wdaF and wdaG (Liu et al. 2020) and an analysis of conserved domains in these genes revealed them as GTs belonging to families, 2, 2, 4 and 2, respectively, where family 2 acts through an inverting mechanism and family 4 operates via a retaining mechanism. From the pentasaccharide RU of the O125ac O-antigen structure the four NDP-donors used by the GTs should be GDP-l-Fuc, GDP-d-Man, UDP-d-GalNAc and UDP-d-Gal in sequence for the nascent oligosaccharyl-PP-Und. Furthermore, GDP-l-Fuc has the β-anomeric configuration whereas the other three NDP-donors have the α-anomeric configuration and in the O-antigen structure the sugar residues Fuc, GalNAc and Gal all have an inverted anomeric configuration compared to that of their NDP-donors. Taken together with the retention of the anomeric configuration for the sugar residue Man, we propose that the third GT in the gene sequence uses GDP-d-Man as the donor in the glycosylation reaction. This glycosylation step also corresponds to the second glycosidic linkage formed for the oligosaccharyl-PP-Und. Thus, we surmise that the GTs are present in inverse order of their function order; i.e. the gene for the first sugar to be added corresponds to the last GT gene in the cluster and so on (Liu et al. 2020). If this is the case, the functions have been identified of all the GTs making the O125ac oligosaccharyl-PP-Und, whose oligosaccharide subsequently is polymerized. In E. coli, translation of a given protein within an operon increases with distance from transcription end (transcription distance) (Lim et al. 2011). While operon arrangement favors production of 5′-end proximal genes more so than downstream encoded open reading frames, the “reverse order arrangement” may be significant in controlling the concentration of lipopolysaccharides in the growing cell.
Additionally, we speculate that the glucosyl group in the O125ab O-antigen is added at the periplasmic side of the inner membrane in a three-step process (Mann and Whitfield 2016) whereby a glucosyl entity is transferred from UDP-glucose to the undecaprenyl phosphate by GtrB to yield the Und-P-Glc precursor in the cytoplasm. This is followed by the flipping of Und-P-Glc into the periplasm by GtrA and subsequent transfer of the glucosyl group by a specific glucosyl transferase (Gtr) to the acceptor molecule. Notably, this sequence is similar to the glucosylation that occurs in modification of e.g. the Shigella flexneri serotype 2a O-antigen (Teh et al. 2020), in which the linear RU of the polysaccharide corresponding to serotype Y is converted by GtrII into serotype 2a having α-d-Glcp-(1 → 3)-linked to RhaI of the RU, resulting in branched structures within the O-antigen.
The structures of the two O-antigens from E. coli O125ab and O125ac (Fig. 8) differ only by the presence or absence of a side-chain glucosyl group, respectively. Molecular models of the polysaccharides generated by CarbBuilder (Fig. 9) reveal possible differences in the backbone conformation of the two polymers as well as the well-exposed epitope presented by the glucosyl group at each RU of the O125ab O-antigen. Not only should it be possible to identify and make a monoclonal antibody that specifically recognizes an epitope that contains the glucosyl group in the RU of the O125ab O-antigen, but results from the modeling suggest that the glucosylation will lead to a shortening of the O-antigen of the LPS molecule, i.e. not extending as far from the outer membrane of the bacterium. This change in polysaccharide extension upon glucosylation is reminiscent of the difference between the O-antigen in S. flexneri serotype 5a and that of serotype Y, which is a linear polysaccharide devoid of side-chains. The former extends only half as far as the latter, which has important consequences for the ability of the tip of the filamentous needle of the bacterium to make contact with the host cell membrane in invasion of the gut epithelial cells of mammalian hosts (West et al. 2005). Possibly, a similar mechanism may be at work in E. coli O125ab. The degree of extension of the O-antigens of serogroups O125ac and O125ab as part of their LPS at the bacterial membrane surface could be investigated in detail by molecular dynamics simulations (Patel et al. 2020) to shed light on O-antigen modification in general and glucosylation in particular.
Fig. 8.

E. coli O125ab and O125ac O-antigen repeating units in SNFG-representation (Neelamegham et al. 2019) and in standard nomenclature; sugar residues are labeled by bold capital letters.
Fig. 9.

CarbBuilder (Kuttel et al. 2016) models of E. coli O125ac and O125ab O-antigen polysaccharides with 11 and 15 repeating units, respectively, visualized by VMD (Humphrey et al. 1996) in a van der Waals’ representation. The sugar residues are colored according to the SNFG-standard (Neelamegham et al. 2019) with Gal/GalNAc residues in yellow, Glc residues in blue, Man residues in green and Fuc residues in red.
Conclusions
The structure of the O-antigen repeating unit from E. coli O125ac was determined using NMR as the main tool. The structure elucidation program, CASPER, successfully predicted its structure to be similar to the O125ab O-antigen, except that the O125ac polysaccharide lacks a glucosyl side-chain residue in its BRU. NMR resonance assignments utilizing multiple 2D NMR experiments confirmed the O-antigen structure. Furthermore, 1H,13C-HSQC and 1H,13C-HSQC-TOCSY experiments with high resolution in the F1 dimension facilitated full assignment of the chemical shifts of the hydroxymethyl groups of hexose residues in both the O125ac and O125ab polysaccharides. Analysis of putative GTs between galF and gnd in the gene cluster of O125, the proposed GT families and the mechanism by which they act, i.e. inverting or retaining, NDP-donor sugars and their sequence in the gene cluster supports the hypothesis that the genomic arrangement of encoded GTs is inverse to their functional order, i.e. the gene for the last sugar to be added corresponds to the first GT gene in the cluster etc., and consequently we were able to identify the function of the GTs that make the oligosaccharyl-PP-Und. Three-dimensional molecular models of the O-antigens highlight the similarity between the structures but also a different epitope arising from the glucosyl group of O125ab, thereby explaining that the E. coli O125 serogroup has been subdivided into O125ab and O125ac.
Materials and methods
Bacterial strains and polysaccharide preparations
E. coli reference strains of O125ac (E. coli O125ac:H6) and O125ab (E. coli O125ab:H19) were obtained from SSI Diagnostica A/S (Hillerød, Denmark). Bacterial culture, LPS extraction and preparation of lipid-free polysaccharides (PS) were carried out as previously described (Furevi et al. 2020).
Sugar analysis by GC–MS
Polysaccharides purified by gel-filtration chromatography (PS) from O125ab and O125ac were hydrolyzed with 2 M TFA at 120 °C for 30 min followed by reduction with NaBH4 in aq. ammonia (1 M) at ambient temp for 30 min and acetylation at 100 °C for 30 min using Ac2O and pyridine (1:1). The resulting mixtures of alditol acetates were analyzed by gas chromatography–mass spectrometry (GC–MS) and separated on an HP-5MS column attached to a Shimadzu GCMS-QP2020 with an electron impact (EI) source. The temperature program used an injection temperature of 250 °C and an initial oven temperature of 60 °C with a hold time of 2 min, followed by ramped heat increase @ 20 °C min−1 to 200 °C then 5 °C min−1 to 260 °C with a hold time of 4 min at 260 °C. The samples were compared with authentic standard references and their mass fragments. The retention times of the derivatives were compared to those of authentic standards as references and their mass spectra were compared to EI-MS fragmentation patterns (Jansson et al. 1976).
NMR spectroscopy
The PS samples were deuterium-exchanged by freeze-drying from 99.9 percent D2O and examined by NMR spectroscopy as solutions in 99.96 percent D2O (8 mg in 0.55 mL) with a trace amount of NaN3 prior to 1D 13C NMR, 2D 1H,13C-HMBC, 1H,13C-H2BC and 1H,13C-BS-CT-HMBC experiments. Samples of O125ab and O125ac PS purified by gel-permeation chromatography were used for additional NMR experiments (1 mg in 0.55 mL). NMR spectra were recorded at 70 °C using Bruker Avance 500 MHz or Bruker Avance III 700 MHz spectrometers equipped with 5 mm TCI (1H/13C/15N) Z-Gradient (53.0 G cm−1) CryoProbes. Chemical shifts are reported in ppm using internal sodium 3-trimethylsilylpropanoate-2,2,3,3-d4 (TSP, δH 0.00) for 1H NMR and external 1,4-dioxane 10 percent in D2O (δC 67.40) for 13C NMR as references. Chemical shift differences were obtained by comparison to NMR data of the corresponding monosaccharides (Jansson et al. 1989). NMR experiments apt for resonance assignments of carbohydrates (Widmalm 2021) were recorded essentially as previously described (Furevi et al. 2020); specific additional experimental conditions are given below.
The F2-coupled 1H,13C-HSQC experiment applied to the O125ac PS was recorded with 1224 × 256 data points in the F2 and F1 dimensions, respectively, using an evolution time corresponding to 1JCH of 145 Hz. Two 1H,1H-NOESY experiments, with suppression of effects from zero-quantum coherence (Thrippleton and Keeler 2003), were carried out for the O125ab PS at 700 MHz with mixing times of 60 and 150 ms employing 14 k × 256 data points in F2 and F1, respectively, an acquisition time of 1.7 s and a relaxation delay of 5 s. Multiplicity-edited 1H,13C-HSQC-TOCSY experiments with 20 and 120 ms mixing times were recorded with 918 × 1024 data points in the F2 and F1 dimensions, respectively, with non-uniform sampling using a sparsity level of 25 percent and an evolution time corresponding to 1JCH of 145 Hz for both the O125ab PS and the O125ac PS. Multiplicity-edited 1H,13C-HSQC experiments were acquired for the two polysaccharides at a 1H frequency of 500 MHz with 1224 × 512 data points in F2 and F1, respectively, covering 140 ppm in the indirect dimension for the O125ac PS and 840 × 256 as well as 938 × 1024 data points in F2 and F1, respectively, covering 100 ppm in F1 for the O125ab PS. The HSQC experiment was also acquired at a 1H frequency of 700 MHz for the two polysaccharides with 938 × 1024 data points in F2 and F1, respectively, covering 100 ppm in F1 with uniform and non-uniform sampling of 25 percent sparsity and an exponential weighting set to 100 ms for the T2 relaxation time. The 1H,13C-HSQC experiment on the O125ac PS with aliasing instead used 1270 × 1024 data points in F2 and F1, respectively, with a spectral width in F1 of 30 ppm centered at 65 ppm.
Bioinformatics analysis
The bioinformatics analysis was based on published genomes of E. coli O125 strains related to O-antigen synthesis and expression (Iguchi et al. 2015; DebRoy et al. 2016; Liu et al. 2020), as deposited at NCBI (GenBank AB812053.1) by Iguchi et al. (Iguchi et al. 2015) and (GenBank KP835694 for O125ab and KP835695 for O125ac) by DebRoy et al. (DebRoy et al. 2016) but also relied on BLAST (Camacho et al. 2009) and CAZy (Drula et al. 2022).
Funding
This work was supported by grants from the Swedish Research Council (2017-03703) and the Knut and Alice Wallenberg Foundation to G.W. K.U. acknowledges support from the Swedish Research Council (2012-03564).
Conflict of interest statement: None declared.
Supplementary Material
Contributor Information
Axel Furevi, Department of Organic Chemistry, Arrhenius Laboratory, Stockholm University, SE-106 91 Stockholm, Sweden.
Klas I Udekwu, Department of Aquatic Sciences and Assessment, Swedish University of Agriculture, P.O. Box 7050, SE-750 07 Uppsala, Sweden.
Göran Widmalm, Department of Organic Chemistry, Arrhenius Laboratory, Stockholm University, SE-106 91 Stockholm, Sweden.
References
- Beier RC, Mundy BP, Strobel GA. Assignment of anomeric configuration and identification of carbohydrate residues by 13C NMR. 1. Galacto- and glucopyranosides and furanosides. Can J Chem. 1980:58:2800–2804. [Google Scholar]
- Bergthorsson U, Ochman H. Distribution of chromosome length variation in natural isolates of Escherichia coli. Mol Biol Evol. 1998:15:6–16. [DOI] [PubMed] [Google Scholar]
- Bundle DR, Lemieux RU. Determination of anomeric configuration by NMR. Methods in Carbohydrate Chemistry. 1976:7:79–86. [Google Scholar]
- Camacho C, Coulouris G, Avagyan V, Ma N, Papadopoulos J, Bealer K, Madden TL. BLAST+: Architecture and applications. BMC Bioinformatics. 2009:10:421. [DOI] [PMC free article] [PubMed] [Google Scholar]
- Croxen MA, Law RJ, Scholz R, Keeney KM, Wlodarska M, Finlay BB. Recent advances in understanding enteric pathogenic Escherichia coli. Clin Microbiol Rev. 2013:26:822–880. [DOI] [PMC free article] [PubMed] [Google Scholar]
- Cunneen MM, Liu B, Wang L, Reeves PR. Biosynthesis of UDP-GlcNAc, UndPP-GlcNAc and UDP-GlcNAcA involves three easily distinguished 4-epimerase enzymes, Gne, Gnu and GnaB. PLoS ONE. 2013:8:e67646. [DOI] [PMC free article] [PubMed] [Google Scholar]
- DebRoy C, Fratamico PM, Yan X, Baranzoni G, Liu Y, Needleman DS, Tebbs R, O’Connell CD, Allred A, Swimley M et al. Comparison of O-antigen gene clusters of all O-serogroups of Escherichia coli and proposal for adopting a new nomenclature for O-typing. PLoS One. 2016:11:e0147434. [DOI] [PMC free article] [PubMed] [Google Scholar]
- Drula E, Garron ML, Dogan S, Lombard V, Henrissat B, Terrapon N. The carbohydrate-active enzyme database: functions and literature. Nucleic Acids Res. 2022:50:D571–D577. [DOI] [PMC free article] [PubMed] [Google Scholar]
- Elias WP, Barros SF, Moreira CG, Trabulsi LR, Tardelli Gomes TA. Enteroaggregative Escherichia coli strains among classical enteropathogenic Escherichia coli O serogroups. J Clin Microbiol. 2002:40:3540–3541. [DOI] [PMC free article] [PubMed] [Google Scholar]
- van Elsas JD, Semenov AV, Costa R, Trevors JT. Survival of Escherichia coli in the environment: fundamental and public health aspects. ISME J. 2011:5:173–183. [DOI] [PMC free article] [PubMed] [Google Scholar]
- Fontana C, Kovacs H, Widmalm G. NMR structure analysis of uniformly 13C-labeled carbohydrates. J Biomol NMR. 2014:59:95–110. [DOI] [PubMed] [Google Scholar]
- Freitas Do Valle GR, Tardelli Gomes TA, Irino K, Trabulsi LR. The traditional enteropathogenic Escherichia coli (EPEC) serogroup O125 comprises serotypes which are mainly associated with the category of enteroaggregative E. coli. FEMS Microbiol Lett. 1997:152:95–100. [DOI] [PubMed] [Google Scholar]
- Furevi A, Ståhle J, Muheim C, Gkotzis S, Udekwu KI, Daley DO, Widmalm G. Structural analysis of the O-antigen polysaccharide from Escherichia coli O188. Carbohydr Res. 2020:498:108051. [DOI] [PubMed] [Google Scholar]
- Furevi A, Ruda A, Angles, d’Ortoli T, Mobarak H, Ståhle J, Hamark C, Fontana C, Engström O, Apostolica P, Widmalm G. Complete 1H and 13C NMR chemical shift assignments of mono-to tetrasaccharides as basis for NMR chemical shift predictions of oligo- and polysaccharides using the computer program CASPER. Carbohydr Res. 2022:513:108528. [DOI] [PubMed] [Google Scholar]
- Humphrey W, Dalke A, Schulten K. VMD: visual molecular dynamics. J Mol Graph. 1996:14:33–38. [DOI] [PubMed] [Google Scholar]
- Iguchi A, Iyoda S, Kikuchi T, Ogura Y, Katsura K, Ohnishi M, Hayashi T, Thomson NR. A complete view of the genetic diversity of the Escherichia coli O-antigen biosynthesis gene cluster. DNA Res. 2015:22:101–107. [DOI] [PMC free article] [PubMed] [Google Scholar]
- Jansson P-E, Kenne L, Liedgren H, Lindberg B, Lönngren J. A practical guide to methylation analysis of carbohydrates. Chem Commun Univ Stockholm. 1976:8:1–75. [Google Scholar]
- Jansson P-E, Kenne L, Widmalm G. Computer-assisted structural analysis of polysaccharides with an extended version of casper using 1H- and 13C-n.m.r. data. Carbohydr Res. 1989:188:169–191. [DOI] [PubMed] [Google Scholar]
- Jansson P-E, Kenne L, Widmalm G. Computer-assisted structural analysis of oligosaccharides using CASPER. Anal Biochem. 1991:199:11–17. [DOI] [PubMed] [Google Scholar]
- Jansson P-E, Stenutz R, Widmalm G. Sequence determination of oligosaccharides and regular polysaccharides using NMR spectroscopy and a novel Web-based version of the computer program CASPER. Carbohydr Res. 2006:341:1003–1010. [DOI] [PubMed] [Google Scholar]
- Jeannerat D. Rapid multidimensional NMR: High resolution by spectral aliasing. eMagRes. 2011:1–9. [Google Scholar]
- Kaper JB, Nataro JP, Mobley HL. Pathogenic Escherichia coli. Nat Rev Microbiol. 2004:2:123–140. [DOI] [PubMed] [Google Scholar]
- Kjellberg A, Urbina F, Weintraub A, Widmalm G. Structural analysis of the O-antigenic polysaccharide from the enteropathogenic Escherichia coli O125. Eur J Biochem. 1996:239:532–538. [DOI] [PubMed] [Google Scholar]
- Kuttel MM, Ståhle J, Widmalm G. CarbBuilder: Software for building molecular models of complex oligo- and polysaccharide structures. J Comput Chem. 2016:37:2098–2105. [DOI] [PubMed] [Google Scholar]
- Li Y, Orlando BJ, Liao M. Structural basis of lipopolysaccharide extraction by the LptB 2 FGC complex. Nature. 2019:567:486–490. [DOI] [PMC free article] [PubMed] [Google Scholar]
- Lim HN, Lee Y, Hussein R. Fundamental relationship between operon organization and gene expression. Proc Natl Acad Sci U S A. 2011:108:10626–10631. [DOI] [PMC free article] [PubMed] [Google Scholar]
- Liu B, Furevi A, Perepelov AV, Guo X, Cao H, Wang Q, Reeves PR, Knirel YA, Wang L, Widmalm G. Structure and genetics of Escherichia coli O antigens. FEMS Microbiol Rev. 2020:44:655–683. [DOI] [PMC free article] [PubMed] [Google Scholar]
- Lundborg M, Widmalm G. Structural analysis of glycans by NMR chemical shift prediction. Anal Chem. 2011:83:1514–1517. [DOI] [PubMed] [Google Scholar]
- Mann E, Whitfield C. A widespread three-component mechanism for the periplasmic modification of bacterial glycoconjugates. Can J Chem. 2016:94:883–893. [Google Scholar]
- Mc Naught W. Bact. coli O 125.B15 in infantile gastro-enteritis. Scott Med J. 1956:1:376–380. [DOI] [PubMed] [Google Scholar]
- Mobli M, Maciejewski MW, Schuyler AD, Stern AS, Hoch JC. Sparse sampling methods in multidimensional NMR. Phys Chem Chem Phys. 2012:14:10835–10843. [DOI] [PMC free article] [PubMed] [Google Scholar]
- Neelamegham S, Aoki-Kinoshita K, Bolton E, Frank M, Lisacek F, Lütteke T, O’Boyle N, Packer NH, Stanley P, Toukach P et al. Updates to the symbol nomenclature for glycans guidelines. Glycobiology. 2019:29:620–624. [DOI] [PMC free article] [PubMed] [Google Scholar]
- Owens TW, Taylor RJ, Pahil KS, Bertani BR, Ruiz N, Kruse AC, Kahne D. Structural basis of unidirectional export of lipopolysaccharide to the cell surface. Nature. 2019:567:550–553. [DOI] [PMC free article] [PubMed] [Google Scholar]
- Patel DS, Blasco P, Widmalm G, Im W. Escherichia coli O176 LPS structure and dynamics: A NMR spectroscopy and MD simulation study. Curr Res Struct Biol. 2020:2:79–88. [DOI] [PMC free article] [PubMed] [Google Scholar]
- Ritchie RGS, Cyr N, Korsch B, Koch HJ, Perlin AS. Carbon-13 chemical shifts of furanosides and cyclopentanols. Configurational and conformational influences. Can J Chem. 1975:53:1424–1433. [Google Scholar]
- Robson S, Arthanari H, Hyberts SG, Wagner G. Nonuniform sampling for NMR Spectroscopy. Methods Enzymol. 2019:614:263–291. [DOI] [PubMed] [Google Scholar]
- Rush JS, Alaimo C, Robbiani R, Wacker M, Waechter CJ. A novel epimerase that converts GlcNAc-P-P-undecaprenol to GalNAc-P-P-undecaprenol in Escherichia coli O157. J Biol Chem. 2010:285:1671–1680. [DOI] [PMC free article] [PubMed] [Google Scholar]
- Söderman P, Jansson P-E, Widmalm G. Synthesis, NMR spectroscopy and conformational studies of the four anomeric methyl glycosides of the trisaccharide D-Glcp-(1→3)-[D-Glcp-(1→4)]-α-D-Glcp. J Chem Soc Perkin Trans. 1998:2:639–648. [Google Scholar]
- Ståhle J, Widmalm G. NMR chemical shift predictions and structural elucidation of oligo- and polysaccharides by the computer program CASPER. In: Kato K, Peters T, editors. New Developments in NMR. The Royal Society of Chemistry; 2017. pp. 335–352. [Google Scholar]
- Ståhle J, Widmalm G. Lipopolysaccharides of gram-negative bacteria: Biosynthesis and structural aspects. Trends Glycosci Glycotechnol. 2019:31:E159–E171. [Google Scholar]
- Stenutz R, Weintraub A, Widmalm G. The structures of Escherichia coli O-polysaccharide antigens. FEMS Microbiol Rev. 2006:30:382–403. [DOI] [PubMed] [Google Scholar]
- Taylor J, Charter RE. The isolation of serological types of Bact. coli in two residential nurseries and their relation to infantile gastro-enteritis. J Pathol Bacteriol. 1952:64:715–728. [DOI] [PubMed] [Google Scholar]
- Teh MY, Furevi A, Widmalm G, Morona R. Influence of Shigella flexneri 2a O antigen acetylation on its bacteriophage Sf6 receptor activity and bacterial interaction with human cells. J Bacteriol. 2020:202:e00363–20. [DOI] [PMC free article] [PubMed] [Google Scholar]
- Thrippleton MJ, Keeler J. Elimination of zero-quantum interference in two-dimensional NMR spectra. Angew Chem Int Ed. 2003:42:3938–3941. [DOI] [PubMed] [Google Scholar]
- West NP, Sansonetti P, Mounier J, Exley RM, Parsot C, Guadagnini S, Prévost M-C, Prochnicka-Chalufour A, Delepierre M, Tanguy M et al. Optimization of virulence functions through glucosylation of Shigella LPS. Science. 2005:307:1311–1317. [DOI] [PubMed] [Google Scholar]
- Widmalm G. General NMR spectroscopy of carbohydrates and conformational analysis in solution. In: Barchi JJ Jr, editors. Comprehensive Glycoscience. 2nd ed. Elsevier Inc.; 2021. pp. 340–373 [Google Scholar]
- Wiseman B, Nitharwal RG, Widmalm G, Högbom M. Structure of a full-length bacterial polysaccharide co-polymerase. Nat Commun. 2021:12:369. [DOI] [PMC free article] [PubMed] [Google Scholar]
Associated Data
This section collects any data citations, data availability statements, or supplementary materials included in this article.