Abstract
Recently, the hemodynamic assessments with 3D cine phase-contrast (PC) MRI (4D flow MRI) have attracted considerable attention from clinicians. Unlike 2D cine PC MRI, the technique allows for cardiac phase-resolved data acquisitions of flow velocity vectors within the entire FOV during a clinically viable period. Thus, the method has enabled retrospective flowmetry in the spatial and temporal axes, which are essential to derive hemodynamic parameters related to vascular homeostasis and those to the progression of the pathologies. Accelerations in imaging are critical for this technology to be clinically viable; however, a high SNR or velocity-to-noise ratio (VNR) is also vital for accurate flow measurements. In this chapter, the technologies enabling this difficult balance are discussed.
Keywords: energy loss, 4D flow magnetic resonance imaging, k-and adaptive-t auto-calibrating reconstruction for Cartesian sampling, phase-contrast image, sparse sampling
Introduction
MR data inherently include velocity information. The most efficient and precise method to measure velocity is phase-contrast (PC) MRI. Specific velocity encoding (VENC) is allowed with a bipolar gradient, and the technique enables proton velocities to be replaced by signal intensities of phase proportional to the velocity on a PC. Triggered by electrocardiography (ECG), time-resolved velocimetry is also available at each cardiac phase. Regarding spatial encoding, 2D PC MRI has been the workhorse for in vivo velocity data collection for decades. ECG gated 2D cine PC MRI has been used for cardiac phase-resolved investigation.1–9
Despite its availabilities, 2D cine PC MRI has not been widely used in day-to-day clinical practice. One of the reasons is its cumbersome flowmetry, what may be called a prospective flowmetry. The determination of measurement plane setting should be concluded, while patients are within the MR scanner. The operators cannot terminate the examination until they are confident that the measured flowmetry values are reasonable. Another reason is its limited spatial resolution in the z-axis of 2D Fourier transform (FT). Although there is much hemodynamic information with physiological significance, a 3D view of arbitrary multi-section is essential to convey it to the clinician in an understandable form. However, 2D FT requires multiple postprocessing across multiple non-negligibly thick slices with interslice gaps, as well as setting every measurement section.
To solve these drawbacks in the 2D PC method, 3D cine PC MRI has been the natural development alternatives. If 3D cine PC is available, the data are acquired en-bloc during a specific period; therefore, the flow measurements can be performed after patients leave the MR scanner room. This strategy could be termed as a retrospective flowmetry. Time-resolved 3D data acquisitions in velocimetry can maximize the practical usefulness and abilities in postprocessing en-bloc velocity data. When the temporal and spatial information in velocimetry is available, numerous postprocessings that expand the physiological and clinical understandings of the cardiovascular physiologies and pathologies are available. However, the time-resolved 3D velocimetry had required an unacceptably long scan time, such as one hour or longer, which had not been clinically viable.
With the aid of hardware and software developments in high-speed data acquisitions, 3D cine PC MRI, or so-called 4D flow MRI has enabled the strategy clinically viable. 4D flow is a method that allows the most efficient cardiac phase-resolved data acquisitions in the whole 3D FOV.10–16 4D flow MRI to maximize the efficiencies in data acquisition, retrospective ECG gating, interleaved acquisitions with appropriate K-space data segmentation, efficient excitations. TR and TE can be set shorter than 2D cine PC MRI, it allows data acquisitions with more minor errors in velocimetry of the accelerated fluid movement.
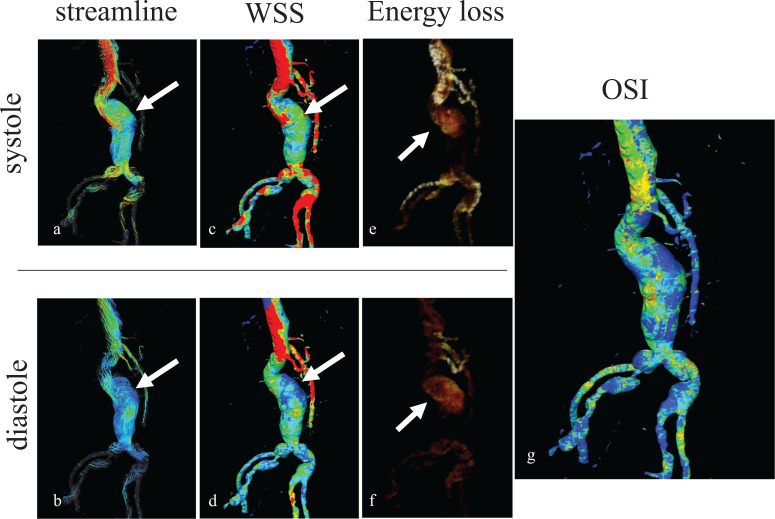
Even if very accurate velocity data with the spatial and temporal information are available in hemodynamic analysis, clinical usefulness is limited if it is not convincingly presented to the clinicians. Therefore, it has been essential to develop the dedicated flow analysis software equipped with various visually appealing 3D options, such as streamline, pathline, wall shear stress (WSS), oscillatory shear index (OSI), and energy loss (EL) (Fig. 1). These parameters have not been readily available until 3D spatial (particularly concerning WSS) and temporal data (particularly concerning pathline and OSI) components have been provided by 4D flow MRI.
Fig. 1.
Representative flow analysis with data obtained by 4D flow MRI of Cartesian data sampling for AAA. a) Streamline image at systole shows a vortex flow (arrow in a) in the aortic aneurysm. b) Streamline image at diastolic phase. The vortex flow (arrow in b) is still evident within AAA. c) WSS image at systole shows a low value (arrow in c) of the AAA wall. d) WSS image at diastole shows a low value (arrow in d) of the AAA wall. e) EL image at systole and f) at diastole shows an increased EL (arrow in e and f) at both phases within the AAA. g) OSI image shows an elevated value on the right side of the AAA. AAA, abdominal aortic aneurysm; EL, energy loss; OSI, oscillatory shear index; WSS, wall shear stress.
Scanning Technique
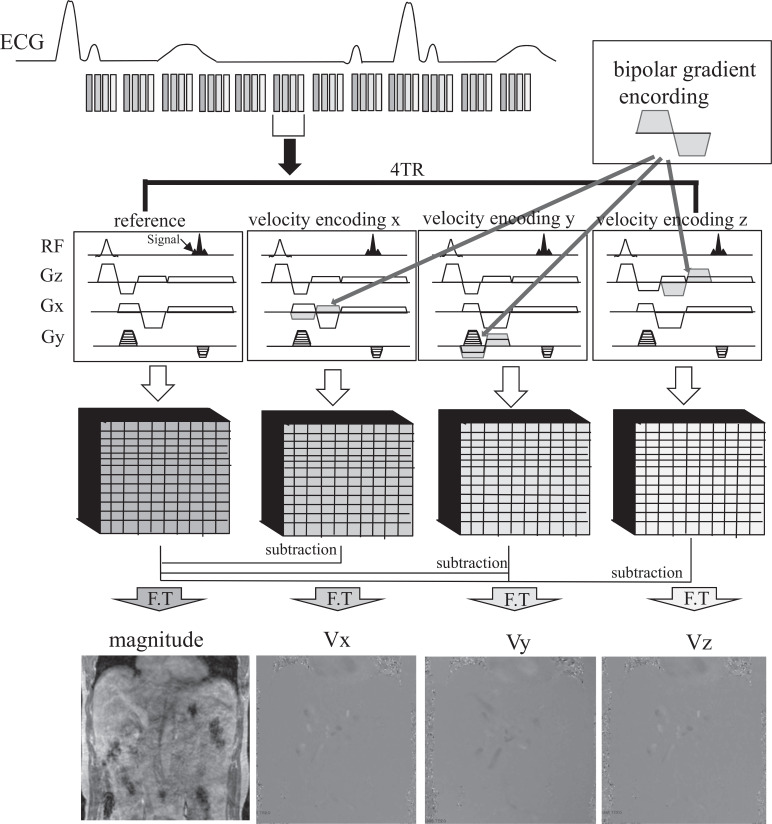
The PC flowmetry is characterized by a bipolar gradient, i.e., a pair of positive and negative gradients of equivalent strength. The amount of phase shift varies in proportional to the velocity of the measured protons and the intensity of the bipolar gradients VENC (Fig. 2). ECG triggering is used to cover variable velocities related to the cardiac phase.
Fig. 2.
Schematic illustration for Cartesian 4D flow MRI in the abdomen. Four sets of velocity data are collected for each time frame to measure 3D velocity encoding (Vx, Vy, and Vz). The refore, using the shortest TR, has a positive impact on speeding up the 4D flow MRI. ECG, electrocardiogram; F.T, fourier transform.
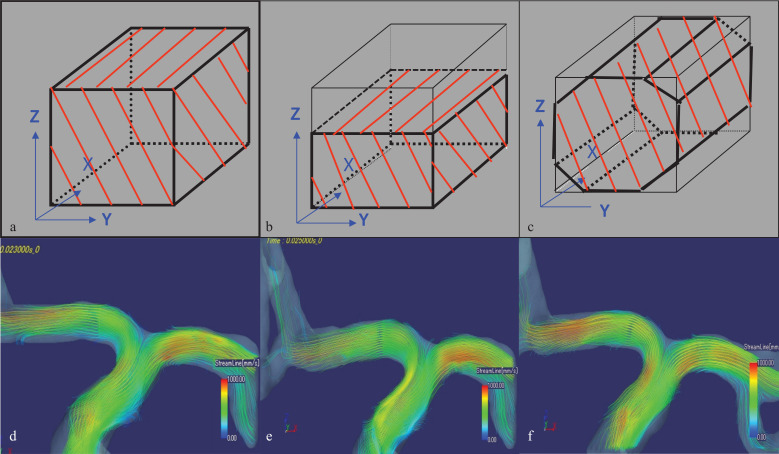
In terms of imaging time, other methods have not enabled clinically viable 3D cine PC MRI before 4D flow method innovated by Markl et al.13,14 The K-space data are acquired in 3D Fourier transformation; therefore, it allows a high SNR. While encoding in the slice and phase directions using short TRs and TEs, bipolar gradient almost simultaneously encodes x-, y-, and z-phase shifts. The use of short TR and TE also allows for accurate data collections for accelerating fluids. 4D flow MRI also allows for K-space data segmentation (Fig. 3) and parallel imaging techniques or compressed sensing (CS), further reducing imaging time.
Fig. 3.
Examples of the partial sampling of K-space, a) complete sampling of K-space data (100% sampling), b) fractional sampling of K-space data on Kz (67% sampling in Asymmetric), and c) undersampling of Ky-Kz corners (Shaving the octagonal shape corners of K space results in 78% sampling). There is no noticeable difference in the streamline analysis results between the three types of data acquisition. d) complete sampling of K-space data (100% sampling), e) fractional sampling of K-space data on Kz (67% sampling in Asymmetric), and f) undersampling of Ky-Kz corners Shaving the octagonal shape corners of K space results in 78% sampling).
Performing the subtraction on the K-space and after FT, the real data as phase images and magnitude images are available for each cardiac cycle (Fig. 2).
K-space data trajectory
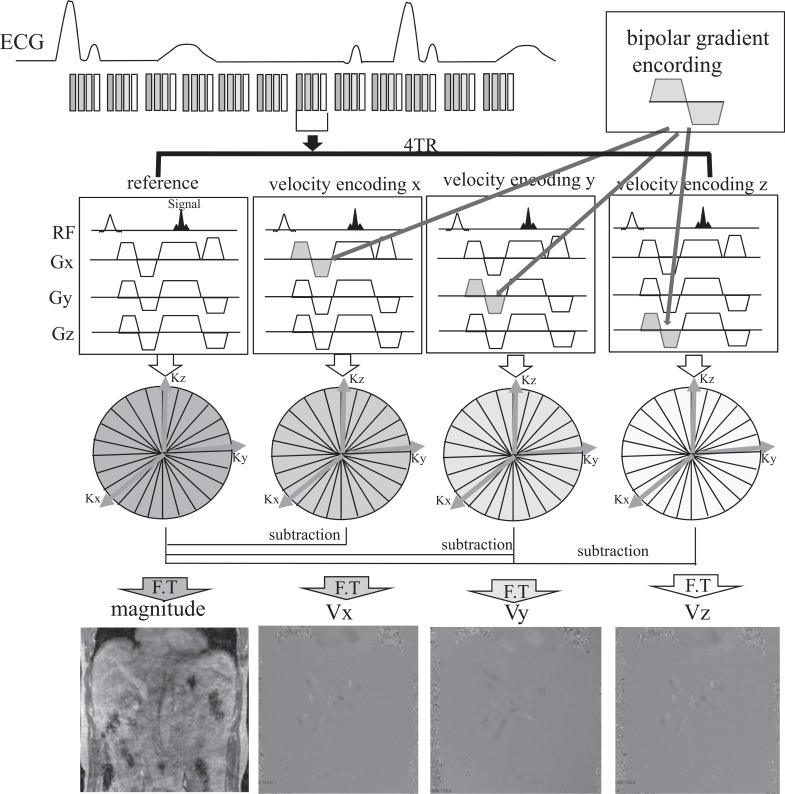
The trajectory for K-space data filling with Markl’s 4D flow has been Cartesian linear data filling. On the other hand, PC vastly undersampled isotropic projection reconstruction (PC-VIPR) is a radial data filling trajectory that fills the K-space like a kooshball (Fig. 4). The significant advantages of PC-VIPR include high spatial resolution of isotropic voxels and a large FOV.17,18 The Cartesian data acquisition is characterized by velocity encoding by bipolar gradient in three directions (x, y, and z) while encoding in slice and phase directions. Radial acquisition requires no slice encoding, The average addition effect by filling the k space center repeatedly, and its short readout time help minimizes TE, thereby avoiding phase shifts other than the proton movement of the velocity.19 The radial sampling in PC-VIPR makes the sequence highly resistant to bulk motion and susceptibility artifacts. Furthermore, the undersampled components of the higher frequency are suitable for the subtraction of stationary tissue. Although streak artifacts occur, they are mitigated by the high contrast and sparse signal distribution between vessels and tissue (Fig. 5).19
Fig. 4.
In 3D radial acquisitions, every acquired k-space line traverses through the center of k-space; therefore, higher signal is expected. With radial undersampling, scan time is reduced at the expense of streak-like artifacts and a reduced SNR, while spatial resolution is preserved. The pulse sequence diagram shows no traditional readout gradient, phase-encoding gradient, and slice-encoding gradient in a radial acquisition. ECG, electrocardiogram; F.T, fourier transform.
Fig. 5.
Three types of flow analysis postprocessed using velocity data acquired with PC-VIPR overlapped on MR angiography of the right internal carotid artery and anterior and middle cerebral artery. a) streamline image, b) wall shear stress image, c) OSI image. PC-VIPR, phase-contrast vastly undersampled isotropic projection reconstruction; OSI, oscillatory shear index.
TR
Similar to other MRI, the length of the TR affects temporal resolution. Since standard 4D flow MRI employs four sets of TR for velocity encoding, the length of the TR has a particular impact on the overall imaging time. Therefore, the TR should have a minimum value.
TE
The use of minimum value for TE is essential for avoiding intravoxel phase shifts. A shown below, an increase in TE significantly affects the SNR; therefore, it degrades the velocity-to-noise ratio (VNR) on PC image.
VENC
When the VENC setting is lower than the maximum flow velocity value of the target vessel, the velocity will be aliased, causing an error in the flow velocity measurement. However, it is not easy to predict the highest blood velocity in an entire field of interest. For example, in healthy circulations, the aorta is the highest velocity; however, in the pathological status, such as with narrowed segments, the jet flow may coexist where the velocity is extremely high, which is even higher than that of the aorta.
Setting the optimum VENC in PC study enables data with high accuracy and precision by reducing the noise. VNR can be calculated as follows: which can be reduced by increasing the SNR of the PC image and by setting as low as possible VENC within the range not exceeding the maximum flow velocity value in the field of interest.3
| [1]20 |
where VENC is the velocity corresponding to a phase shift of π, V is the measured velocity component.
Dual VENC
As stated above, according to the equation of VNR, velocity noise can be reduced by using higher SNR PC images, which is enabled by the hardware (i.e., magnetic field strength or coils) to some extent. In addition, VENC should be set to the lowest possible level not to induce aliasing. Since VENC obtains the velocity information from the phase difference of spins, it is necessary to set the maximum velocity value corresponding to the phase difference. It is, therefore, essential to determine the target vessels. Since flow velocities in the tissues are not homogeneous, it is challenging to set the VENC just right for all blood flows.
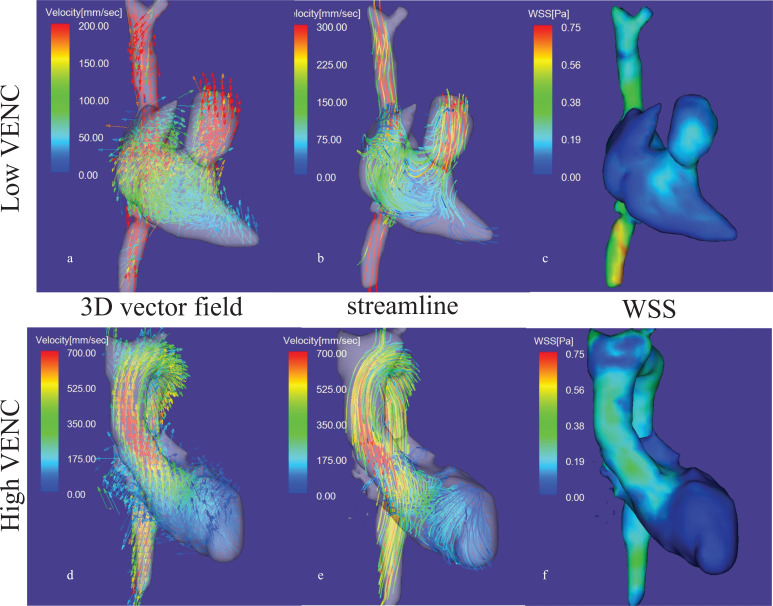
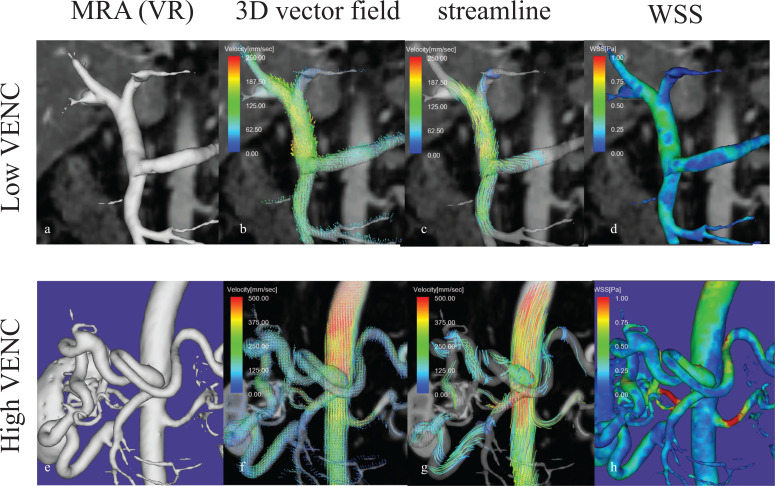
The dual-VENC method provides two VENC settings, one for the highest velocity and the other for the lowest velocity. Dual VENC enables simultaneous acquisitions of high-velocity and low-velocity components of the flow in the same FOV in a single imaging session19,21,22 (Figs. 6 and 7). Dual VENC contributes to the improvement of VNR in the show blood flow component compared to single VENC (even if it is assumed to be 2 number of excitations [NEX]). It improves the accuracy in measuring slow blood vessels, near vessel walls, and slow blood flow velocity components during diastole. However, drawbacks should be considered: the extension of 4 TR of single VENC to 7 TR of dual VENC may decrease temporal resolution and misregistrations.
Fig. 6.
An example of the use of dual VENC for 4D flow MRI. Upper row: Low VENC:50 cm/sec, lower row: high VENC: 150 cm/sec. Optimization of VENC is essential for high-velocity noise ratio image on 4D flow MRI. Lower VENC (upper row) is appropriate for the venous system and the pulmonary circulation, where the blood flow velocities are relatively low. Note higher VENC depicts un-aliasing on the high-velocity aortic blood flow. All images are at systole. a) 3D vector field map postprocessed using low VENC data acquisition, b) streamline image with low VENC, c) WSS map with low VENC, d) 3D vector field map of with high VENC, e) streamline image with high VENC, f) WSS with high VENC. VENC, velocity encoding; WSS, wall shear stress.
Fig. 7.
The use of dual VENC for simultaneous velocity acquisitions for the arterial and portal venous system for 4D flow MRI. Upper row: low VENC (50 cm/sec) for slow flow of the portal venous system, Lower row: High VENC (150 cm/sec) for the higher flow velocity of the arterial system. The patient is suffering from occlusion of the celiac artery. Note markedly dilated pancreaticoduodenal arcade. a) Portal MRA with low VENC, b) 3D vector field map with low VENC, c) streamline image with low VENC, d) WSS image with low VENC, e) MRA of the collateral arteries with high VENC, f) 3D vector field map with high VENC. Note that the flow vectors within the aorta are not aliased. g) streamline image with high VENC, h) WSS with high VENC on abdomen aorta. MRA, MR angiography; VENC, velocity encoding; WSS, wall shear stress.
Contrast administration
The easiest extrinsic way to increase SNR on PC is to take advantage of the T1 shortening effect of contrast media. When contrast-enhanced MRA is scheduled in the MR examination menu, the 4D Flow is advised to be performed after the contrast administration. Since short TR fast spoiled gradient echo is incorporated into the pulse sequence of 4D Flow, VNR on the 4D flow MRI is considerably improved with the T1 shortening effect of the blood after the administration of gadolinium chelate.15 However, the imaging parameters need to be optimized by increasing the flip angle.
High-speed Scanning
The drawbacks of 4D flow in clinical practice are the long imaging time, relatively low spatial resolution, and the significant effect of motion artifacts. To solve these problems, high-speed imaging techniques should be employed. However, speeding up in MRI has to be done with care because, in most cases, there is a dilemma of SNR, and spatial and temporal resolution degradation concerning the speed up of 4D flow MRI. The following is a list of high-speed imaging techniques that are currently available for 4D flow.
Number of views per segment (NVS)
During each heartbeat, while the R-R interval of the cardiac cycle is divided into multiple cine frames, only a K-space segment is collected over the duration of each cine frame. The number of lines of K-space acquired throughout a cine frame is termed as the number of views per segment or simply as the views per segment. The views per segment multiplied by TR equals the duration of the cine frame. When multiple lines of K-space are collected per R-R interval, the imaging time decreases by a factor of NVS.23
Partial sampling of K-space data
Since high-frequency components have relatively little effect on the fundamental image contrast, the high-frequency components of the K-space data can be undersampled. This method includes asymmetric undersampling using Conjugate symmetry of K-space (Fig. 3b) and Ky-Kz octagonal undersampling (Fig. 3c).
Parallel imaging
Parallel imaging, such as sensitivity encoding (SENSE), simultaneous acquisition of spatial harmonics (SMASH), and generalized autocalibrating partial parallel acquisition (GRAPPA), is a technique that can be used to measure the spatial harmonics of an image. Parallel imaging deliberately applies a small amount of phase sampling data to speed up the data sampling and takes advantage of the fact that the sensitivity distribution provided by multiple RF coils (phased-array coils) differs spatially, expands the folded signals, and reconstructs the image by accurately restoring the omitted sampling. Since the number of phase sampling is reduced, this method considerably shortens the imaging time. However, it is necessary to pay attention to the decrease in SNR due to reducing phase sampling.24,25 The SNR of parallel imaging degrades depending on the geometric factor related to coil arrangements and on the square root of the reduction factor.26
Sparse imaging using time and spatial components
Sparse imaging using time and spatial components, such as k-and adaptive-t auto-calibrating reconstruction for Cartesian sampling (kat ARC), k-t SENSE, and k-t GRAPPA, improves time resolution.
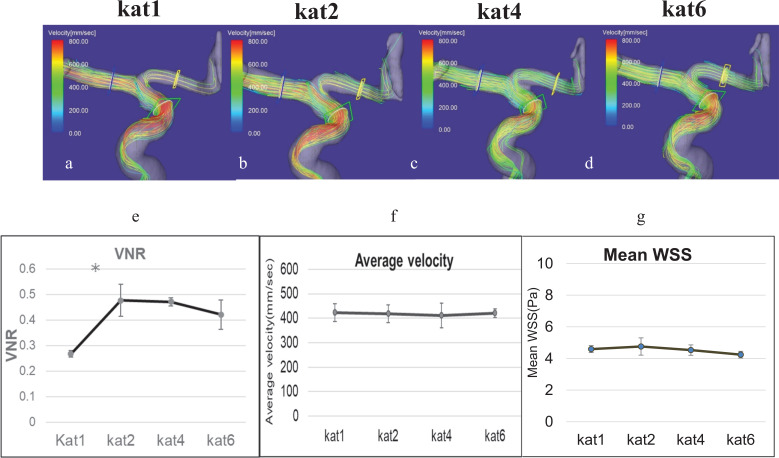
For significantly shorten the imaging time, undersampling of k-space over time in the main acquisition process (sparse imaging). The cardiac motion can be estimated from the low-frequency data of each segment. Based on the heartbeats, the data can be collected more densely during systole, where movement is more significant than in the diastole. Combining spatial-temporal data into the k-t axis can efficiently fill the uncollected points and finally reconstruct the image. The technique is already applicable to 4D flow MRI.27,28 It has the advantage of less SNR degradation even when a significant reduction factor is used (Fig. 8).29–33
Fig. 8.
Effect of reduction factors in kat ARC on the streamline analysis for the internal carotid artery. (a) kat ARC factor1, (b) kat ARC factor2, (c) kat ARC4, (d) kat ARC6. (e) Change in VNR according to the difference in kat ARC factor. (f) Change in average velocity according to the difference in kat ARC factor. *P < 0.05. (g) Change in mean WSS according to the difference in kat ARC factor. The VNR was higher with kat 2 or kat 4 as compared to kat1. ARC, auto-calibrating reconstruction for cartesian imaging; VNR, velocity-to-noise ratio; WSS, wall shear stress.
Compressed Sensing
CS is a signal recovery theory enabling image reconstruction from fewer sampled signals. According to the recently developed mathematical theory of CS, images with a sparse representation can be recovered from randomly undersampled k-space data. The artifacts due to random undersampling overlap as similar to noise; however, significant signals stand out above the noise with iterative reconstruction using suitable regularization parameter. CS can considerably shorten imaging time by changing the imaging sequence and algorithm for image reconstruction without using additional hardware for MRI. The image restoration from sparse signal sampling in CS depends on the two assumptions, i.e., the sparsity and the incoherence.34,35 Deep learning utilizing CNN for reconstruction from a randomly undersampled signal; the images obtained from the CNN are used as a constrained reconstruction model in conventional CS iterative reconstruction.36,37 The use of CNN and CS for 4D flow MRI is still underway. The scan time can be considerably shortened; however, potential hemodynamic underestimation (i.e., 7%–10% underestimation of maximum velocity, maximum flow or net flow) should be considered when interpreting the results.
Echo planner imaging
EPI employs gradient switching for the echo sampling, which can be incorporated into 4D flow MR data acquisition. EPI reduces imaging time and may ensure quality by reducing motion-related artifacts, such as breathing, due to the fast data sampling.38–40 However, when using large EPI factors, caution should be exercised as phase shifts during data acquisition may cause velocity shifts and resolution loss.41
Postprocessing
Streamline analysis
Streamline refers to a continuous curve connecting velocity vectors at a specific time. The flow diagram is drawn for each phase of the cardiac cycle and the color-coded blood flow velocity. Non-laminar flow such as vortex or helical flow can be visually observed with streamline analysis (Figs. 1a, 1b, 5a, 6b, 6e, 7c, 7g, and 8a–8d).42
Pathline analysis
The pathline is the path of blood or fluid that travels over a certain period of time, which are the trajectories that individual fluid particles follow. The streamlines of the fluid will determine the direction the path takes at each moment in time.
WSS
WSS is the frictional force caused by viscous blood flowing along the vessel wall.43 This value can be calculated as the product of the ratio of the velocity component dv along the vessel wall at a small distance dx from the vessel wall (shear rate: dv/dx) and the blood viscosity.
| [2]44 |
where is the viscosity, dv is the velocity, and dx is the shortest distance from the measuring point to the vascular wall.
For vessel integrities, a certain amount of WSS must be maintained against the vessel endothelium. As a mechanoreceptor, vascular endothelium detects WSS, and when WSS is inappropriately high or low, the endothelium releases substances to promote atherosclerosis (Figs. 1c, 1d, 5d, 6c, 6f, 7d, and 7h). The value of WSS suggests future atherosclerosis,12 which may predict vascular diseases.
Energy loss
In the human body, energy dissipation occurs due to viscous friction in some blood vessels and the heart. Determining the velocity and the coordinate points, EL is defined using the first spatial differentials of the velocity vector components:
| [3]45 |
where is the viscosity, U is the velocity, and x is the coordinate.
4D flow MRI enables 3D velocimetry in each voxel within the entire FOV in a cardiac phase-resolved fashion (Fig. 1e and 1f).
When this flow EL is more significant, extra energy is required to pump blood throughout the body, and the afterload on the heart increases. In recent studies, it has been used as an index to evaluate various cardiac workloads, such as the effect of blood flow EL on survival in valvular heart disease,46 the fact that cumulative EL increases the risk of future heart failure in pediatric congenital heart disease,47 and an index to evaluate cardiac load in dilated cardiomyopathy.48
The usual EL (total pressure loss × flow rate) cannot be calculated without the total pressure data. However, it is possible to calculate the EL using the information (vector) of blood viscosity and flow velocity field.
Turbulent kinetic energy (TKE)
TKE is supposed to calculate the value of EL associated with turbulence. In practice, the intra-voxel standard deviation (IVSD) is calculated and quantified from the signal difference between the PC images under the velocity control based on the relationship between the velocity distribution in the voxel and the PC MRI signal. To accurately quantify IVSD, two or more magnitude images with different VENCs are required to prevent aliasing, which can be efficiently obtained by dual-NENC imaging as described above.44 TKE has been reported to be helpful in assessing the severity of disease in aortic stenosis49,50 and cardiomyopathy.51,52
Conclusion
4D flow MRI provides useful hemodynamic information on many clinical occasions. Various available hemodynamic parameters can provide vital information concerning hemodynamic disorders, the severity, and the treatment outcomes estimated quantitatively. We need to optimize the imaging parameter settings and high-speed and high VNR method enabling this purpose.
Footnotes
Conflicts of Interest
The second author Yasuo Takehara is an endowed chair of Nagoya University supported by a private company; however, the status is irrelevant to the contents of the paper. Coauthors Tetsuya Wakayama and Atsushi Nozaki are employees of GE Healthcare. Other authors have nothing to disclose related to the current study.
References
- 1.Frayne R, Steinman DA, Ethier CR, Rutt BK. Accuracy of MR phase contrast velocity measurements for unsteady flow. J Magn Reson Imaging 1995; 5:428–431. [DOI] [PubMed] [Google Scholar]
- 2.Nayler GL, Firmin DN, Longmore DB. Blood flow imaging by cine magnetic resonance. J Comput Assist Tomogr 1986; 10:715–722. [DOI] [PubMed] [Google Scholar]
- 3.Lee VS, Spritzer CE, Carroll BA, et al. Flow quantification using fast cine phase-contrast MR imaging, conventional cine phase-contrast MR imaging, and Doppler sonography: in vitro and in vivo validation. AJR Am J Roentgenol 1997; 169:1125–1131. [DOI] [PubMed] [Google Scholar]
- 4.Lotz J, Döker R, Noeske R, et al. In vitro validation of phase-contrast flow measurements at 3 T in comparison to 1.5 T: precision, accuracy, and signal-to-noise ratios. J Magn Reson Imaging 2005; 21:604–610. [DOI] [PubMed] [Google Scholar]
- 5.Rebergen SA, van der Wall EE, Doornbos J, de Roos A. Magnetic resonance measurement of velocity and flow: technique, validation, and cardiovascular applications. Am Heart J 1993; 126:1439–1456. [DOI] [PubMed] [Google Scholar]
- 6.Pelc NJ, Herfkens RJ, Shimakawa A, Enzmann DR. Phase contrast cine magnetic resonance imaging. Magn Reson Q 1991; 7:229–254. [PubMed] [Google Scholar]
- 7.Dumoulin CL. Phase contrast MR angiography techniques. Magn Reson Imaging Clin N Am 1995; 3:399–411. [PubMed] [Google Scholar]
- 8.Mohiaddin RH, Yang GZ, Kilner PJ. Visualization of flow by vector analysis of multidirectional cine MR velocity mapping. J Comput Assist Tomogr 1994; 18:383–392. [DOI] [PubMed] [Google Scholar]
- 9.Napel S, Lee DH, Frayne R, Rutt BK. Visualizing three-dimensional flow with simulated streamlines and three-dimensional phase-contrast MR imaging. J Magn Reson Imaging 1992; 2:143–153. [DOI] [PubMed] [Google Scholar]
- 10.Bammer R, Hope TA, Aksoy M, Alley MT. Time-resolved 3D quantitative flow MRI of the major intracranial vessels: initial experience and comparative evaluation at 1.5T and 3.0T in combination with parallel imaging. Magn Reson Med 2007; 57:127–140. [DOI] [PMC free article] [PubMed] [Google Scholar]
- 11.Frydrychowicz A, Harloff A, Jung B, et al. Time-resolved, 3-dimensional magnetic resonance flow analysis at 3 T: visualization of normal and pathological aortic vascular hemodynamics. J Comput Assist Tomogr 2007; 31:9–15. [DOI] [PubMed] [Google Scholar]
- 12.Ku DN, Giddens DP, Zarins CK, Glagov S. Pulsatile flow and atherosclerosis in the human carotid bifurcation. Positive correlation between plaque location and low oscillating shear stress. Arteriosclerosis 1985; 5:293–302. [DOI] [PubMed] [Google Scholar]
- 13.Markl M, Chan FP, Alley MT, et al. Time-resolved three-dimensional phase-contrast MRI. J Magn Reson Imaging 2003; 17:499–506. [DOI] [PubMed] [Google Scholar]
- 14.Markl M, Harloff A, Bley TA, et al. Time-resolved 3D MR velocity mapping at 3T: improved navigator-gated assessment of vascular anatomy and blood flow. J Magn Reson Imaging 2007; 25:824–831. [DOI] [PubMed] [Google Scholar]
- 15.Takehara Y, Isoda H, Takahashi M, et al. Abnormal flow dynamics result in low wall shear stress and high oscillatory shear index in abdominal aortic dilatation: Initial in vivo assessment with 4D-flow MRI. Magn Reson Med Sci 2020; 19:235–246. [DOI] [PMC free article] [PubMed] [Google Scholar]
- 16.Terada M, Takehara Y, Isoda H, Uto T, Matsunaga M, Alley M. Low WSS and high OSI measured by 3D cine PC MRI reflect high pulmonary artery pressures in suspected secondary pulmonary arterial hypertension. Magn Reson Med Sci 2016; 15:193–202. [DOI] [PMC free article] [PubMed] [Google Scholar]
- 17.Motoyama D, Ishii Y, Takehara Y, et al. Four-dimensional phase-contrast vastly undersampled isotropic projection reconstruction (4D PC-VIPR) MR evaluation of the renal arteries in transplant recipients: Preliminary results. J Magn Reson Imaging 2017; 46:595–603. [DOI] [PubMed] [Google Scholar]
- 18.Sugiyama M, Takehara Y, Kawate M, et al. Optimal plane selection for measuring post-prandial blood flow increase within the superior mesenteric artery: Analysis using 4D flow and computational fluid dynamics. Magn Reson Med Sci 2020; 19:366–374. [DOI] [PMC free article] [PubMed] [Google Scholar]
- 19.Gu T, Korosec FR, Block WF, et al. PC VIPR: a high-speed 3D phase-contrast method for flow quantification and high-resolution angiography. AJNR Am J Neuroradiol 2005; 26:743–749. [PMC free article] [PubMed] [Google Scholar]
- 20.Ha H, Kim GB, Kweon J, et al. Multi-VENC acquisition of four-dimensional phase-contrast MRI to improve precision of velocity field measurement. Magn Reson Med 2016; 75:1909–1919. [DOI] [PubMed] [Google Scholar]
- 21.Nakaza M, Matsumoto M, Sekine T, et al. Dual-VENC 4D flow MRI can detect abnormal blood flow in the left atrium that potentially causes thrombosis formation after left upper lobectomy. Magn Reson Med Sci 2021. Mar 31.[Epub ahead of print] [DOI] [PMC free article] [PubMed] [Google Scholar]
- 22.Schnell S, Ansari SA, Wu C, et al. Accelerated dual-venc 4D flow MRI for neurovascular applications. J Magn Reson Imaging 2017; 46:102–114. [DOI] [PMC free article] [PubMed] [Google Scholar]
- 23.Bluemke DA, Boxerman JL, Atalar E, McVeigh ER. Segmented K-space cine breath-hold cardiovascular MR imaging: Part 1. Principles and technique. AJR Am J Roentgenol 1997; 169:395–400. [DOI] [PMC free article] [PubMed] [Google Scholar]
- 24.Nett EJ, Johnson KM, Frydrychowicz A, et al. Four-dimensional phase contrast MRI with accelerated dual velocity encoding. J Magn Reson Imaging 2012; 35:1462–1471. [DOI] [PMC free article] [PubMed] [Google Scholar]
- 25.Huang F, Akao J, Vijayakumar S, Duensing GR, Limkeman M. k-t GRAPPA: a k-space implementation for dynamic MRI with high reduction factor. Magn Reson Med 2005; 54:1172–1184. [DOI] [PubMed] [Google Scholar]
- 26.Fujita H. New horizons in MR technology: RF coil designs and trends. Magn Reson Med Sci 2007; 6:29–42. [DOI] [PubMed] [Google Scholar]
- 27.Giese D, Schaeffter T, Kozerke S. Highly undersampled phase-contrast flow measurements using compartment-based k-t principal component analysis. Magn Reson Med 2013; 69:434–443. [DOI] [PubMed] [Google Scholar]
- 28.Lai PB, AC, Beatty PJ, Shankaranarayanan A. Highly-accelerated cardiac cine MR imaging using kats ARC (autocalibrating reconstruction for cartesian sampling with k- & Adaptive-t-Space Data Synthesis). Proceedings of the 17th Scientific Meeting and Exhibition of ISMRM, Honolulu, 2009; 767. [Google Scholar]
- 29.Jung B, Stalder AF, Bauer S, Markl M. On the undersampling strategies to accelerate time-resolved 3D imaging using k-t-GRAPPA. Magn Reson Med 2011; 66:966–975. [DOI] [PubMed] [Google Scholar]
- 30.Lai P, Huang F, Larson AC, Li D. Fast four-dimensional coronary MR angiography with k-t GRAPPA. J Magn Reson Imaging 2008; 27:659–665. [DOI] [PMC free article] [PubMed] [Google Scholar]
- 31.Okuda S, Yamada Y, Tanimoto A, et al. Three-dimensional cardiac cine imaging using the kat ARC acceleration: Initial experience in clinical adult patients at 3T. Magn Reson Imaging 2015; 33:911–917. [DOI] [PubMed] [Google Scholar]
- 32.Schnell S, Markl M, Entezari P, et al. k-t GRAPPA accelerated four-dimensional flow MRI in the aorta: effect on scan time, image quality, and quantification of flow and wall shear stress. Magn Reson Med 2014; 72:522–533. [DOI] [PMC free article] [PubMed] [Google Scholar]
- 33.Sekine T, Amano Y, Takagi R, et al. Feasibility of 4D flow MR imaging of the brain with either Cartesian y-z radial sampling or k-t SENSE: comparison with 4D Flow MR imaging using SENSE. Magn Reson Med 2014; 13:15–24. [DOI] [PubMed] [Google Scholar]
- 34.Pathrose A, Ma L, Berhane H, et al. Highly accelerated aortic 4D flow MRI using compressed sensing: Performance at different acceleration factors in patients with aortic disease. Magn Reson Med 2021; 85:2174–2187. [DOI] [PMC free article] [PubMed] [Google Scholar]
- 35.Lustig M, Donoho D, Pauly JM. Sparse MRI: The application of compressed sensing for rapid MR imaging. Magn Reson Med 2007; 58:1182–1195. [DOI] [PubMed] [Google Scholar]
- 36.Wang S, Su Z, Ying L, et al. Accelerating magnetic resonance imaging via deep learning. Proceeding of the 13th International Symposium on Biomedical Imaging (ISBI) of IEEE, Prague, 2016; 514–517. [DOI] [PMC free article] [PubMed] [Google Scholar]
- 37.Ouchi S, Ito S. Reconstruction of compressed-sensing MR imaging using deep residual learning in the image domain. Magn Reson Med Sci 2021; 20:190–203. [DOI] [PMC free article] [PubMed] [Google Scholar]
- 38.Shiina Y, Inai K, Nagao M. Non-physiological aortic flow and aortopathy in adult patients with transposition of the great arteries after the jatene procedure: A pilot study using echo planar 4D flow MRI. Magn Reson Med Sci 2021; 20:439–449. 10.2463/mrms.mp.2020-0101 [DOI] [PMC free article] [PubMed] [Google Scholar]
- 39.Viola F, Dyverfeldt P, Carlhäll CJ, Ebbers T. Data quality and optimal background correction order of respiratory-gated k-space segmented spoiled gradient echo (SGRE) and echo planar imaging (EPI)-based 4D flow MRI. J Magn Reson Imaging 2020; 51:885–896. [DOI] [PMC free article] [PubMed] [Google Scholar]
- 40.Garg P, Westenberg JJM, van den Boogaard PJ, et al. Comparison of fast acquisition strategies in whole-heart four-dimensional flow cardiac MR: Two-center, 1.5 Tesla, phantom and in vivo validation study. J Magn Reson Imaging 2018; 47:272–281. [DOI] [PMC free article] [PubMed] [Google Scholar]
- 41.Dillinger H, Walheim J, Kozerke S. On the limitations of echo planar 4D flow MRI. Magn Reson Med 2020; 84:1806–1816. [DOI] [PubMed] [Google Scholar]
- 42.Wu SP, Ringgaard S, Pedersen EM. Three-dimensional phase contrast velocity mapping acquisition improves wall shear stress estimation in vivo. Magn Reson Imaging 2004; 22:345–351. [DOI] [PubMed] [Google Scholar]
- 43.Ha H, Kim GB, Kweon J, et al. Hemodynamic measurement using four-dimensional phase-contrast MRI: Quantification of hemodynamic parameters and clinical applications. Korean J Radiol 2016; 17:445–462. [DOI] [PMC free article] [PubMed] [Google Scholar]
- 44.Savage B, Saldívar E, Ruggeri ZM. Initiation of platelet adhesion by arrest onto fibrinogen or translocation on von Willebrand factor. Cell 1996; 84:289–297. [DOI] [PubMed] [Google Scholar]
- 45.Itatani K, Okada T, Uejima T, Tanaka T, Ono M. Intraventricular flow velocity vector visualization based on the continuity equation and measurements of vorticity and wall shear stress. Jpn J Appl Phys. 2013; 52:7–16. [Google Scholar]
- 46.Bahlmann E, Gerdts E, Cramariuc D, et al. Prognostic value of energy loss index in asymptomatic aortic stenosis. Circulation 2013; 127:1149–1156. [DOI] [PubMed] [Google Scholar]
- 47.Itatani K, Miyaji K, Qian Y, et al. Influence of surgical arch reconstruction methods on single ventricle workload in the Norwood procedure. J Thorac Cardiovasc Surg 2012; 144:130–138. [DOI] [PubMed] [Google Scholar]
- 48.Nabeta T, Itatani K, Miyaji K, Ako J. Vortex flow energy loss reflects therapeutic effect in dilated cardiomyopathy. Eur Heart J 2015; 36:637. [DOI] [PubMed] [Google Scholar]
- 49.Dyverfeldt P, Hope MD, Tseng EE, Saloner D. Magnetic resonance measurement of turbulent kinetic energy for the estimation of irreversible pressure loss in aortic stenosis. JACC Cardiovasc Imaging 2013; 6:64–71. [DOI] [PMC free article] [PubMed] [Google Scholar]
- 50.Binter C, Gotschy A, Sündermann SH, et al. Turbulent kinetic energy assessed by multipoint 4-dimensional flow magnetic resonance imaging provides additional information relative to echocardiography for the determination of aortic stenosis severity. Circ Cardiovasc Imaging 2017; 10:e005486. [DOI] [PubMed] [Google Scholar]
- 51.Iwata K, Matsuda J, Imori Y, Sekine T, Takano H. Four-dimensional flow magnetic resonance imaging reveals the reduction in turbulent kinetic energy after percutaneous transluminal septal myocardial ablation in hypertrophic obstructive cardiomyopathy. Eur Heart J 2020; 41:1454. [DOI] [PubMed] [Google Scholar]
- 52.Zajac J, Eriksson J, Dyverfeldt P, Bolger AF, Ebbers T, Carlhäll CJ. Turbulent kinetic energy in normal and myopathic left ventricles. J Magn Reson Imaging 2015; 41:1021–1029. [DOI] [PubMed] [Google Scholar]


