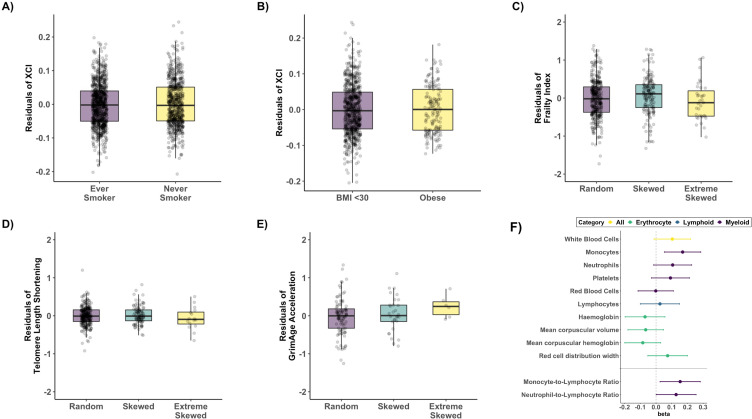
Figure 3. Age acquired XCI-skew and markers of biological ageing and blood cell counts.
Box plots representing the results of the linear regression mixed effects models to assess (A) Smoking status (p=0.33, Nnever_smoker = 879; Never_smoker = 673) and (B) obesity (p=0.88, Nnot_obese = 726; Nobese = 165) after correcting for age with XCI as the dependent variable, and (C) frailty index (p=0.59, Nranodm XCI = 398; nSkewed XCI = 177; Nextreme skew = 36), after correcting for age and BMI, (D) Leukocyte telomere length shortening (p=0.9, Nranodm XCI = 278; nSkewed XCI = 103; Nextreme skew = 16) after correcting for age and smoking status, and (E) DNAm GrimAge acceleration (p=0.22, Nranodm XCI = 101; nSkewed XCI = 30; Nextreme skew = 6), with XCI-skew as the dependent variable. All boxplots display the median and IQR, and have the residuals of the models on the y-axis. (F) A forest plot of associations with data-matched Complete Blood Count data (top panel) and Myeloid-to-lymphoid ratios (bottom) with effect size and lower and upper confidence intervals indicated. Associations were tested with XCI-skew as an independent variable after controlling for age, BMI, seasonality, and smoking status as fixed effects in a linear mixed effects model (Nranodm XCI = 445; nSkewed XCI = 183; Nextreme skew = 43). The significance threshold after Bonferroni correction was p<0.005 and p<0.023 to account for multiple testing across the 10 tests and 2 tests, respectively.


