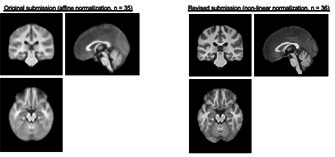
Author response image 1. Mean structural (T1) image comparison – Images depict the average of all participants’ structural scans following normalization, with the initial pipeline on the left and the pipeline used for the revision, which includes nonlinear normalization, on the right.

Nonlinear warping is associated with more consistent normalization, as can be seen in better gray-white matter separation in the group mean image.
