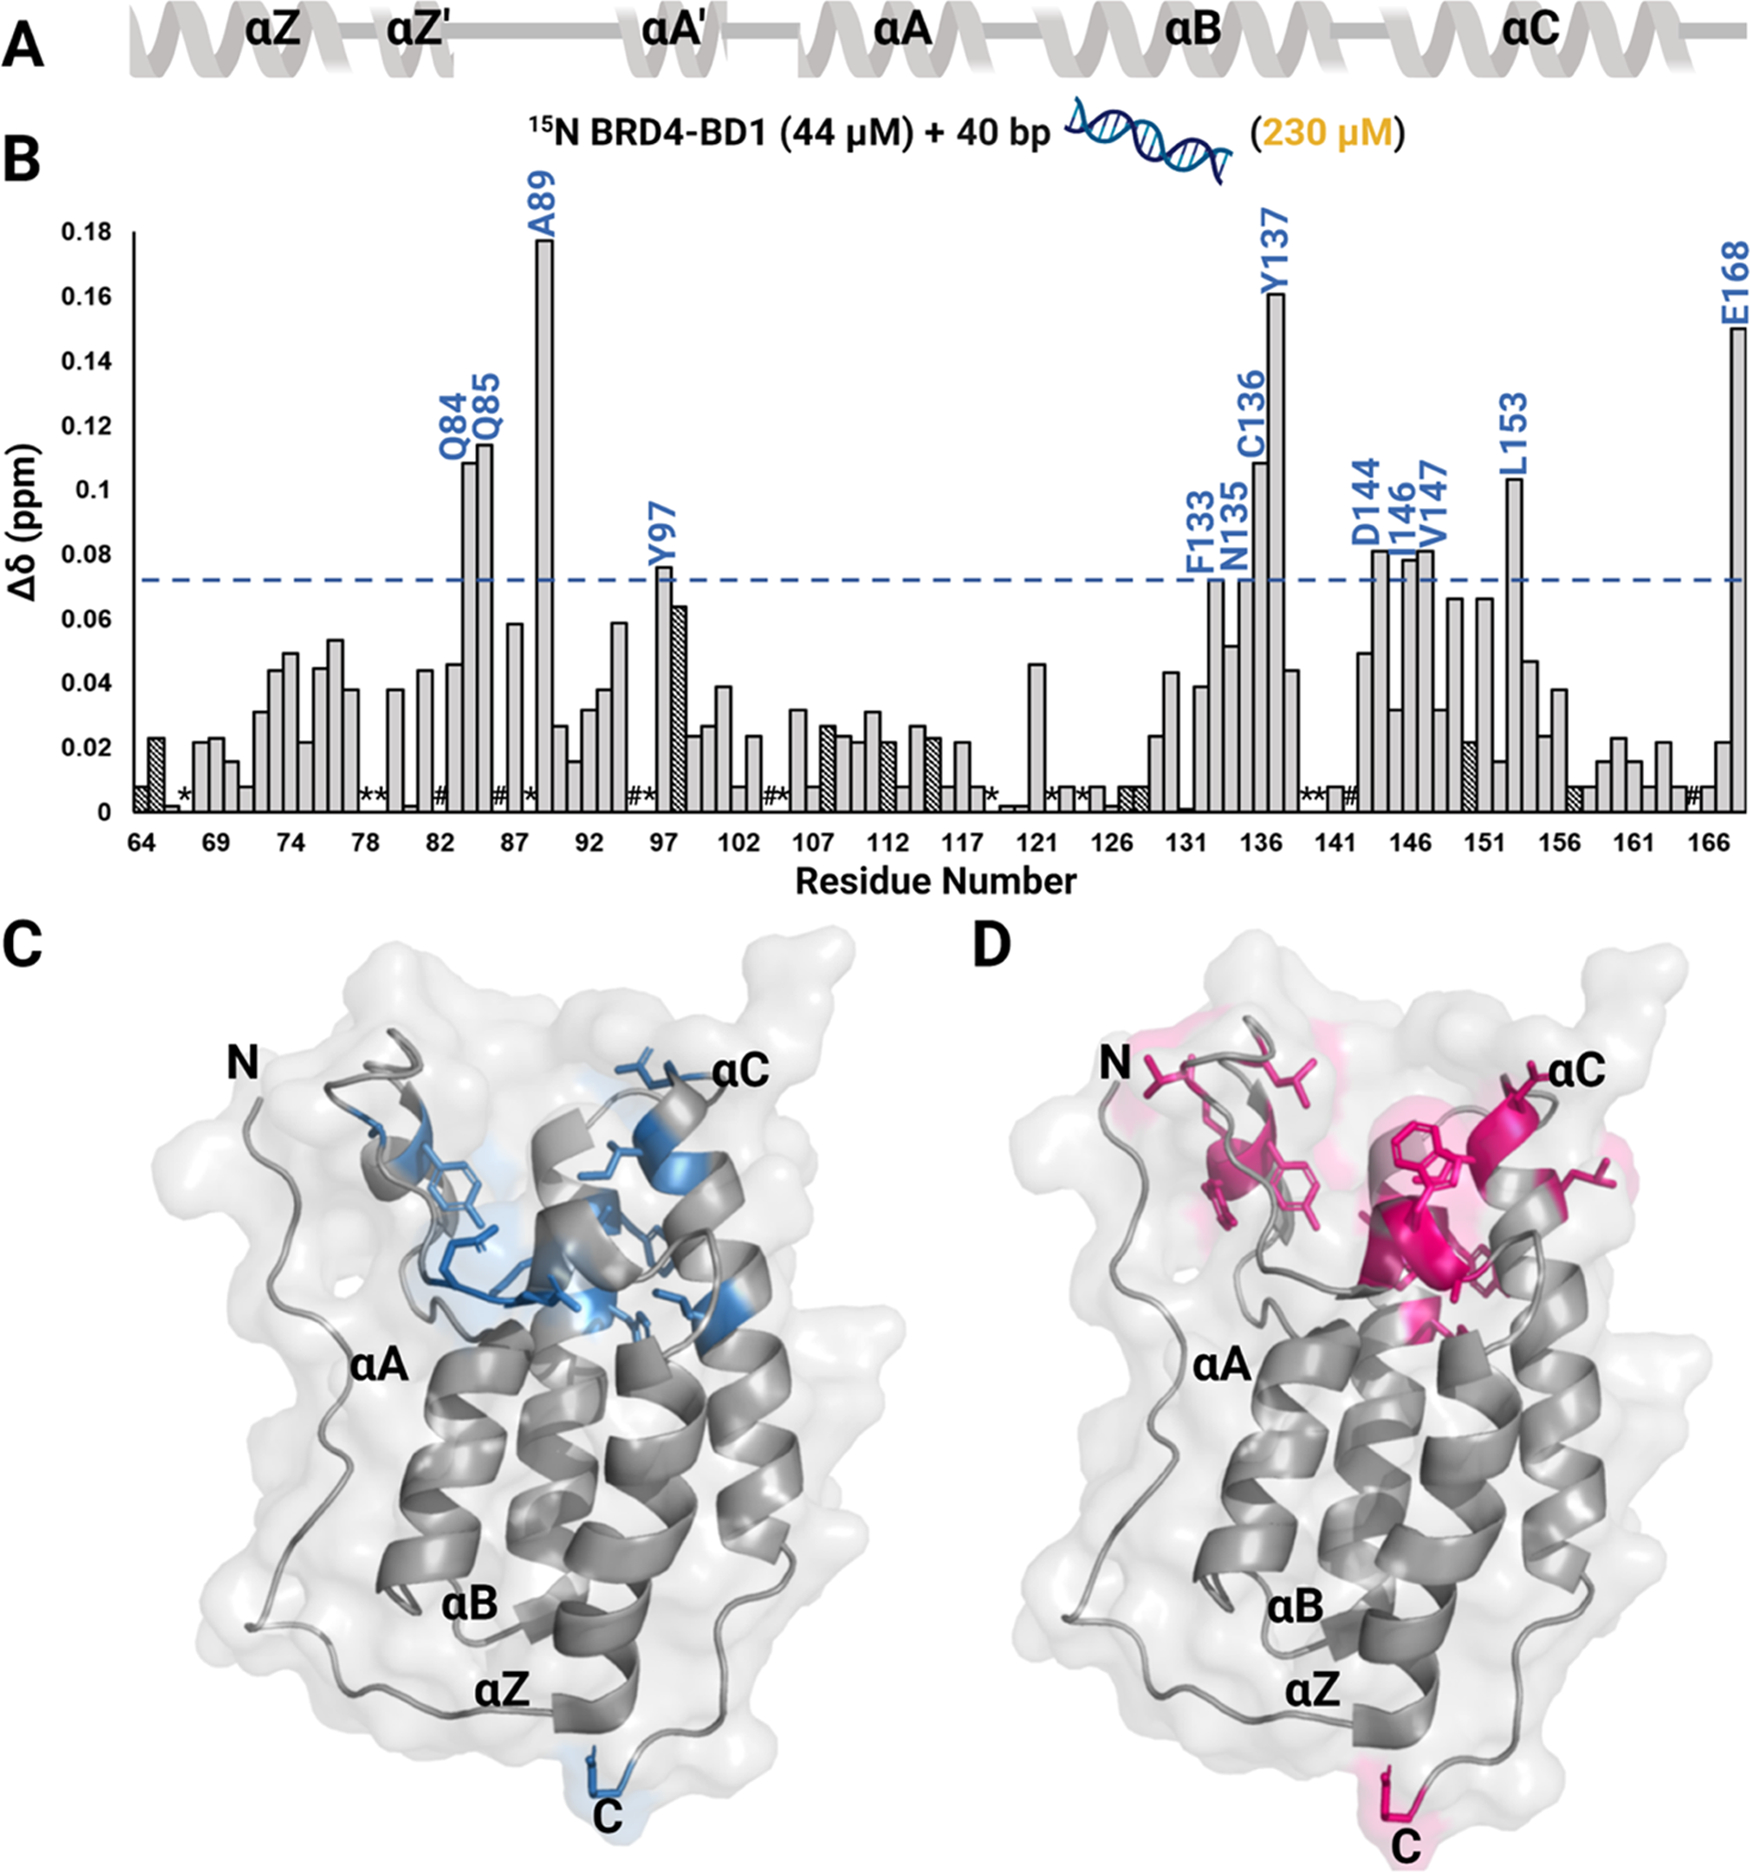
Figure 3.

1H-15N HSQC NMR experiment with 40 bp dsDNA binding to 15N BRD4–BD1. (A) Secondary structure of the BD is denoted above the CSP plot. (B) Normalized CSPs are plotted as a function of residues upon titration of 40 bp dsDNA for the DNA concentration up to 230 μM and residues that are perturbed greater than the average plus one standard deviation are labeled in blue. A blue line marks this level of significance. Dashed bars indicate a CSP at a lower concentration of DNA (28 μM for D128, F157, 79 μM for Q64, G108, K112, and 115 μM for Y65, Y98, E115, Q127, and A150) as the chemical shift at 230 μM could not be assigned. These CSPs also accounted for average and standard deviation calculations. *indicates a missing resonance and # indicates a proline residue. A surface representation of the BRD4–BD1 structure (PDB ID: 3UVW) with residues that are significantly perturbed upon binding to (C) 40 bp dsDNA are colored in blue and (D) to H4 K5Ac,K8Ac,K12Ac,K16Ac are colored in pink.
