

 Content of this journal is licensed under a
 Abstract
Dramatic changes have occurred recently in the field of epilepsy, including a fundamental shift in the etiology of epileptogenic substrates found at surgery. Hippocampal sclerosis (HS) is no longer the most common etiology found at epilepsy surgery and this decrease has been associated with an increase in the incidence of focal cortical dysplasia and encephaloceles. Significant advances have been made in molecular biology and genetics underlying the basis of malformations of cortical development (MCD), and our ability to detect epileptogenic abnormalities with magnetic resonance imaging has markedly improved. This article begins with a discussion of these trends and reviews imaging techniques essential for detecting subtle epilepsy findings. Representative examples of subtle imaging findings are presented, which are often overlooked but should not be missed. These include temporal lobe encephaloceles, MCD, especially focal cortical dysplasia, HS, hippocampal malformation (also known as HIMAL), ulegyria, autoimmune encephalitis, and Rasmussen’s encephalitis. Recent findings on the pathophysiology and genetic underpinnings of several causes of localization-related epilepsy are incorporated. For instance, it has been recently found that focal cortical dysplasia IIb, tuberous sclerosis, hemimegalencephaly, and gangliogliomas are all the result of mutations of the mammalian target of rapamycin pathway for cell growth.
Main points
Recent decrease in hippocampal sclerosis at surgery has been accompanied by an increase in malformations of cortical development. Detection of focal cortical dysplasia (FCD) can be difficult, not infrequently resulting in magnetic resonance imaging (MRI) being labeled “normal,” despite subtle findings. Other under-recognized causes of intractable epilepsy include small temporal pole encephaloceles, hypothalamic hamartomas, and autoimmune encephalopathies.
Temporal lobe atrophy associated with white matter hyperintensity on long TR (repetition time) imaging and blurring of the gray–white matter junction accompanies hippocampal sclerosis in half the cases and is thought to be due to dysmyelination related to degeneration of white matter fibers from early onset seizures.
The coexistence of an epileptogenic abnormality and hippocampal sclerosis is known as dual pathology. It is important to systematically assess for dual pathologies on MRI because satisfaction of search may reveal either hippocampal sclerosis or another pathologic entity but fail to reveal both entities. Unless both entities are addressed (e.g., from a surgical perspective), treatment may be inadequate.
Temporal lobe encephaloceles may account for up to 10% of medically refractory temporal lobe epilepsy. They are best identified on thin-section axial or coronal T2-weighted sequences, less well visualized on FLAIR (fluid attenuated inversion recovery) and T1-weighted images, and demonstrated focal hypometabolism on F-18-fluorodeoxyglucose positron emission tomography/computed tomography imaging.
MRI features of FCD include a localized increase in cortical thickness, localized increase in cortical signal without other known cause, ill-defined or irregular cortical-white matter junction, localized subcortical signal located at the bottom of a sulcus, asymmetrical gyral pattern, abnormal depth, or widening of the overlying sulcus, abnormal subcortical white matter signal, and associated transmantle signal changes (also known as a radial band).
Advances in molecular biology, the genetics underlying malformations of cortical development (MCD), and imaging have evolved our understanding of epilepsy.1,2 The underlying pathologic substrate of pharmacoresistant epilepsy found at surgery has also shifted.3 These changes in the landscape of epilepsy imaging, combined with the inherent difficulty of detecting magnetic resonance imaging (MRI) findings that may be very subtle, make MRI of seizure and epilepsy patients quite challenging.2
Epilepsy can be thought of as abnormal brain function within a network, rather than due to a regional epileptogenic focus.4,5 Different brain abnormalities responsible for precipitating seizure onset propagate into common pathways of well-defined brain networks, with stereotypical phenotypes. About 35% of epilepsy patients have seizures refractory to medications, termed “intractable or drug-resistant epilepsy,” and patients with localization-related epilepsy could have a medication failure rate as high as 75%.6 Surgery is the most effective treatment for many patients with drug-resistant epilepsy and can be curative. The role of imaging is to detect anatomic brain lesions that may represent the cause of focal seizures; these epileptogenic regions may be thought of as critical nodes in the cortico-subcortical network that if removed or ablated will lead to seizure remission. Patients with no identifiable abnormality on imaging have lower benefit rates from epilepsy surgery, signifying the critical role of imaging.7
During the 20th century, the most common cause of intractable epilepsy was hippocampal sclerosis (HS, also known as mesial temporal sclerosis), accounting for up to 70% of cases. Over the last 2-3 decades, an international study found a 48% relative decline in HS surgeries, despite an up-trending number of referrals for refractory epilepsy evaluation. This may be secondary to an increase in non-lesional extra-temporal epilepsy surgery, improvements in imaging and detection of “untreated” cases in the population, and earlier treatment of febrile seizures, among other potential factors.3
The decline in HS has been accompanied by an increase in MCD. Detection of focal cortical dysplasia (FCD) can be difficult, not infrequently resulting in an MRI being labeled “normal,” despite subtle findings, particularly during the first decade of clinical MRI. Other under-recognized causes of intractable epilepsy include small temporal pole encephaloceles, hypothalamic hamartomas, and autoimmune encephalopathies. While these various disorders are currently difficult to detect, we are at the precipice of a quantitative revolution revolving around measurements of MRI brain volumes, signals, and white matter connections using sophisticated artificial intelligence algorithms.8,9 This review will emphasize recent changes in our understanding of the imaging of epilepsy and focus on subtle abnormalities associated with chronic seizures that radiologists should be cognizant of.
Imaging technique considerations
Detecting anatomic abnormalities on MRI, determining whether these are true abnormalities or normal variants, determining if the lesion is concordant with clinical epilepsy data and possible epileptogenic focus, and delineating lesion extent of lesion in preparation for surgery are primary focus in epilepsy imaging.10 MRI is not indicated for absence seizures juvenile myoclonic epilepsy, benign partial epilepsy of childhood with centrotemporal spikes, and idiopathic generalized epilepsy.11 Several studies have shown a doubling in the sensitivity for detecting epileptogenic abnormalities by using a dedicated seizure protocol with trained readers compared to a standard seizure protocol read by radiologists without special training in interpreting imaging with epileptogenic abnormalities.12 One group advocates performing an “essential six” epilepsy protocol (which is formatted into 7 sequences): (a) 3 dimensional (3D)-T1 1-mm isotropic volume (formatted in coronal and axial planes), T2/STIR (short tau inversion recovery) sequences ≤3 mm obtained in (b) axial and (c) coronal planes, FLAIR sequences ≤3 mm obtained in (d) axial and (e) coronal planes, and (f) axial susceptibility-weighted sequences. Coronal images should be angulated perpendicular to hippocampal axis. In a series of 2740 patients, abnormalities were identified on MRI in 80% and these 6 sequences were able to detect 99% of those abnormalities, that is, all lesion types except subtle pial angiomatosis, which necessitated contrast enhancement.11,13. The International League Against Epilepsy (ILAE) Neuroimaging Task Force has recommended an imaging protocol, referred to as “HARNESS_MRI”, consisting of isotropic , millimeter 3D T1 and 3D FLAIR sequences, and high-resolution 2D submillimeter T2 images.14 Due to relative lack of white matter myelin, proton density and FLAIR sequences are less useful in infants than in adults.15 Double inversion recovery pulse sequences can suppress both cerebrospinal fluid (CSF) and white matter signal, increasing the detection of cortically based lesions. 3T field strength or imaging with phased array coils is recommended over 1.5T (particularly for FCD) due to its 6- to 8-fold increase in signal-to-noise ratio, increased resolution, and potentially faster scanning with reduced motion artifacts.16,17 Increased clinical implementation of 7T magnets may also contribute to our understanding of non-lesional epilepsy, utilizing its high signal and contrast to noise ratios. Interestingly, the main source of false-positive findings on 3T scanners are focal regions that are misinterpreted as FCD, due to areas of apparent blurry appearance of grey–white matter interfaces caused by volume averaging rather than pathologic changes.18 Fully automated commercial programs are available that utilize high-resolution volumetric 3D T1-gradient echo images to segment brain anatomy and assist in the detection of mesial temporal sclerosis. Improved detection rates of subtle epileptogenic lesions based on such methodologies as voxel-based morphometry, resting-state functional MR, and/or machine learning will continue to expand, as these techniques evolve from research to commercial clinical tools.8
Temporal lobe epilepsy
Epilepsy arising from the temporal lobes is the most common location for medically refractory epilepsy, reflecting, in part, the importance of the hippocampus in seizure generation. Approximately 70% of patients with drug-resistant temporal lobe epilepsy (TLE) will have a visually identifiable MRI abnormality.19 Recent interest has focused on the role of hippocampal malrotation (also known as HIMAL), autoimmune encephalopathy, temporal lobe networks, and temporal lobe encephaloceles as causes of temporal lobe epilepsy.
Hippocampal sclerosis
HS is characterized by hippocampal neuronal loss associated with gliosis and remains an important cause of medically refractory epilepsy. It is often associated with childhood insult, including encephalitis and febrile seizures. Imaging characteristics include unilateral hippocampal volume loss, T2 prolongation, and loss of internal architecture, along with secondary imaging findings that include atrophy of the ipsilateral fornix, mammillary body, parahippocampal gyrus, and thalamus (Figure 1). Temporal lobe atrophy associated with white matter hyperintensity on long TR imaging and blurring of the gray–white junction accompanies HS in half the cases and is thought to be due to dysmyelination related to degeneration of white matter fibers from early onset seizures20 (Figure 1). Hippocampal volume correlates with several parameters, including hippocampal neuronal loss, memory scores, EEG (electroencephalogram) findings, history of childhood febrile seizures, duration of seizures, lifetime secondary generalized seizure occurrence, and successful postoperative outcome. Hippocampal T2 prolongation with atrophy is a strong indicator of temporal lobe epilepsy.21 ILAE task force classified HS into 4 histopathological subtypes of HS (type I: cell loss in CA1 and CA4, type II: cell loss in CA1, type III: cell loss in CA4, type IV: no cell loss/sclerosis, only gliotic changes).22 This classification contributes to the prognostication of the disease, as type I indicates a better surgical outcome. Utilizing quantitative volumetric MRI analyses, types I and II have been previously associated with lower hippocampal volumes.23 However, a recent study utilizing 3T and 7T MRI scanners found no prognostic value of hippocampal internal architecture, though it was better visualized on 7T scanner. Both hippocampal volume and hippocampal internal architecture did predict seizure laterality, both on 3T and 7T scanners.24 Without coronal sequences, hippocampal abnormalities may be impossible to discern, particularly when findings are bilateral. The importance of detecting MRI findings is underscored by their relationship to postoperative outcomes; 75% of TLE patients with MRI-identified HS become seizure-free postoperatively versus 51% with MRI-negative TLE.25 Quantitative assessment using 3T can help improve the detection of preoperative HS, shifting individuals from the MRI-negative to the MRI-positive group in a quarter of TLE patients.26
Figure 1.

(a) Subtle hippocampal sclerosis, with mild left hippocampal volume loss without associated hyperintense signal changes, is demonstrated on coronal T2W imaging at level of the hippocampal body. The alternating gray–white bands representing the hippocampal internal architecture are decreased on the left (arrow, compare with diagram in Figure 1c). (b) In a different patient, more typical changes of hippocampal sclerosis are present, with a small hyperintense hippocampus (arrow) associated with ipsilateral temporal lobe atrophy on a coronal T2W image. (c) Idealized coronal T2W diagram depicts many of the imaging features associated with hippocampal sclerosis, including hippocampal atrophy, hippocampal T2W signal abnormality, and loss of internal white matter architecture within the gray matter of the hippocampus (arrow). Associated temporal lobe atrophy is illustrated, associated with dysmyelination changes (arrowheads), as demonstrated by white matter hyperintensity and blurring of the gray–white matter junction.
The coexistence of an extrahippocampal epileptogenic abnormality and HS is referred to as dual pathology.27 The most common abnormalities found in association with HS are MCD or early childhood insults. Kuchukhidze et al.28 found hippocampal disorders in almost a third of their patients with MCDs. It is important to systematically assess for dual pathologies on MRI because the satisfaction of search may reveal either HS or another pathologic entity but fail to reveal both entities. Unless both entities are addressed (e.g., from a surgical perspective), treatment may be inadequate.29
Hippocampal malrotation: An anatomic variant or epileptogenic substrate?
During normal in utero development, hippocampal shape transforms from an unfolded structure into a partially folded vertically oriented shape, with continued evolution eventually into a completely folded oval structure in the coronal plane (Figure 2). In an early study evaluating the shape of hippocampi in normal volunteers, 79% were oval, 18% were rectangular, and 3% were round/square.30 Barsi et al.31 linked HIMAL to 6% of their epilepsy patients, which they related to incomplete hippocampal inversion. MRI findings include an abnormally round shape unilaterally with normal hippocampal signal intensity and size, blurring of hippocampal internal architecture, and an abnormal angle of the collateral sulcus (i.e., a more vertical orientation).
Figure 2.

Hippocampal malrotation (HIMAL). A 3-year-old boy with febrile and infantile seizures. Coronal T2W imaging (a) and diagram (b) demonstrate findings associated with HIMAL—a rounded hippocampal shape with a unilateral malrotated left hippocampus with blurred hippocampal internal architecture (black arrowheads), vertical collateral sulcus (long white arrow; compared to normal contralateral side, white arrowhead), and an abnormal temporal horn configuration (short white arrow).
The HIMAL designation has generated a significant amount of controversy related to the classification and reproducibility and the concern that this is a normal variation rather than a biomarker of epilepsy. Several recent studies shed light on this entity, which implicate a relationship to febrile status epilepticus but not to epilepsy itself.32,33 Other groups reported no significant difference between the frequency of HIMAL in epilepsy and non-epilepsy populations suggesting that the presence of HIMAL is an anatomic variant.34,35
Temporal lobe encephalocele
An under-recognized and frequently overlooked cause of TLE in patients with refractory epilepsy is the small temporal pole encephalocele (Figure 3), which was reported in 2%-4% of patients with drug-resistant epilepsy and 10% of temporal lobe resections.36,37 These lesions appear as focal protrusions of brain parenchyma through or indenting the inner table and demonstrate isointense gray–matter signal with characteristic rim of CSF. They are best identified on thin section or 3D isotropic volume T2-weighted sequences that include the anterior temporal pole. These abnormalities are less well seen on 2D FLAIR, 2D or 3D T1-weighted images, or by F-18-fluorodeoxyglucose positron emission tomography/computed tomography (F-18 FDG-PET) imaging.37 Isotropic sequences such as 3D-T2 or 3D-FLAIR, with reformation perpendicular to the encephalocele, may help confirm the presence of protruded brain. A small calvarial defect, harboring the encephalocele, is best demonstrated by CT. There are several interesting features associated with this condition. These patients present at an older age than most TLE patients (i.e., more than 30 years old for the encephalocele group). There was a mean delay of 9 years after symptom onset to diagnosis. Left-sided encephalocele TLE ictus semiology consists of significant language impairment without confusion or aura (which is unusual for left TLE). Focal resection of the lesion offers a good outcome for seizure cure. Prevalence of encephaloceles may be increasing due to idiopathic intracranial hypertension (IIH), which in turn may be related to the increasing rates of obesity.38 In a recent series of 13 cases, Sandhu et al.39 reported excellent Engel class I outcome in patients who underwent resection surgery with EEG concordat to the ipsilateral TLE. Most of their cases were overweight (mean BMI of 31) with signs of IIH.
Figure 3.

Temporal lobe encephalocele. A 36-year-old female with intractable complex partial seizures since age 28. The left temporal pole encephalocele (arrows) is easy to overlook without using a systematic approach to interpretations (coronal T2W and FLAIR Imaging, (a) and (b), respectively). The patient underwent left temporal pole resection, which confirmed an encephalocele, with pathologic changes of reactive gliosis. The patient has been seizure-free since resection.
Other causes of temporal lobe epilepsy
Temporal lobe epilepsy has been linked with other causes of epilepsy, including isolated amygdala enlargement, temporal plus epilepsy, and autoimmune encephalopathy (in addition to other inflammatory, neoplastic, and vascular disorders).40
Temporal plus epilepsy refers to an epileptogenic focus in the temporal lobe that extends to a network of ipsilateral extra-temporal regions such as the insula, frontal operculum, orbito-frontal cortex, and temporo-parieto-occipital junction. In these patients, the risk of temporal lobe surgery failure was 5 times greater than unilateral temporal lobe epilepsy,41,42 making it incumbent to carefully assess these areas for imaging abnormalities and correlate with scalp EEG.
Autoimmune-mediated encephalopathy (AME) refers to a group of neuro-psychiatric disorders mediated by autoimmune antibodies, the incidence of which has surged over the last decade.43 In adults presenting with new-onset intractable TLE, especially in conjunction with a history of psychosis, it is incumbent to exclude AME. Early diagnosis may lead to early treatment and better outcomes. AME can be classified based on: (a) cellular location of antigens—membrane versus intracellular, (b) paraneoplastic versus non-paraneoplastic autoantibodies, and (3) affected brain location—limbic versus extra-limbic involvement (Figure 4). Intracellular antigens most commonly include Hu, Ma2, and CV2/CRMP5 and are most commonly paraneoplastic and associated with lung cancer, testicular germ cell tumors, and Hodgkin lymphoma. Antibodies targeting cell-surface antigens are the most common cause of AME, particularly antibodies directed against N-methyl-D-aspartate receptor (NMDAR) and the voltage-gated potassium channel, notably leucine-rich glioma inactivated 1 (LGI1) protein. Anti-NMDAR AME is associated with tumors (usually ovarian teratoma) in about 40% of the cases.43 A recent study utilizing structural T1W MRI and DTI in patients with limbic encephalitis due to autoantibodies against glutamic acid decarboxylase 65 (associated with amygdala enlargement) showed altered global network topology as compared to healthy controls and patients with HS.44
Figure 4.

Autoimmune-mediated encephalitis (AME). A 57-year-old female presented with progressive confusion over 3 days, which evolved to visual hallucinations and then complex partial seizures. On coronal images, hippocampi are slightly enlarged and hyperintense bilaterally (arrows) on T2W imaging (a), consistent with limbic encephalitis that was due to voltage-gated potassium channel complex antibodies. Despite immunotherapy and steroids, the patient was left with memory loss and intractable epilepsy. (b). AME classification schemes, using a diagram of a neuron with cell membrane in black and intracellular compartment green. AME can be categorized by (1) cellular location of antigens—membranous versus intracellular, (2) site of brain encephalitis—limbic versus rarely limbic, and (3) association with neoplastic disease—paraneoplastic versus rarely paraneoplastic.
In general, non-paraneoplastic AME demonstrates abnormal signal and variable diffusion restriction in the limbic structures, whereas paraneoplastic forms may additionally include extra-limbic signal abnormalities, leukoencephalopathy, cerebellar degeneration, and brainstem encephalitis.45 Limbic encephalitis has classic clinical and radiology features, consisting of temporal lobe seizures, memory impairment, mood fluctuations, and involvement of the medial temporal lobe.46 Limbic involvement may be unilateral, bilateral symmetric, or bilateral asymmetric; anti-LGI1 voltage-gated potassium channel complex AME frequently involves limbic structures on MRI (Figure 4). The absence of imaging findings does not exclude AME, particularly in the case of anti-NMDAR AME. Imaging differential diagnosis includes viral encephalitis such as herpes simplex virus, human herpes virus 6 and Ebstein-Barr virus encephalitis, infrequent infectious entities such as rabies encephalitis and neurosyphilis, and non-infectious entities such as status epilepticus, tumors, infarct, and trauma.
Malformations of cortical development
Major advances have occurred over the last decade in the imaging, molecular biology, and genetics of MCDs, which are now recognized as the cause of intractable epilepsy in approximately 50% cases. These abnormalities include lesions related to abnormal cell proliferation (hemimegalencephaly and FCD type IIb) or apoptosis, abnormal neuronal migration (lissencephaly, band heterotopia, periventricular nodular heterotopia), and abnormal cortical organization (polymicrogyria, schizencephaly, and FCD type I) (Table 1).47
Table 1.
Malformation of cortical development classification*
| I. Abnormal neuronal and glial proliferation or apoptosis |
| A. Microcephaly |
| B. Megalencephaly |
| C. Cortical dysgenesis with abnormal cell proliferation |
| 1. Diffuse |
| 2. Focal and multifocal |
| a. Hemimegalencephaly |
| b. Focal cortical dysplasia type II |
| c. Tuberous sclerosis |
| D. Cortical dysplasias with abnormal cell proliferation and neoplasia |
| 1. Dysembryoplastic neuroepithelial tumor |
| 2. Ganglioglioma and gangliocytoma |
| II. Abnormal neuronal migration |
| A. Periventricular heterotopia |
| B. Generalized abnormal transmantle migration |
| 1. Anterior or diffuse classic lissencephaly and subcortical band heterotopia |
| 2. Posterior or diffuse classic and without cell-sparse zone lissencephaly and subcortical band heterotopia |
| 3. X-linked lissencephaly |
| 4. Reelin-type lissencephaly |
| 5. Variant lissencephaly |
| C. Localized abnormal late transmantle migration |
| 1. Subcortical heterotopia |
| 2. Sublobar dysplasia |
| D. Abnormal terminal migration and defects in pial limiting membrane (cobblestone malformations) |
| III. Abnormal postmigration development |
| A. Polymicrogyria (including schizencephaly) |
| B. Inborn errors of metabolism |
| C. Focal cortical dysplasias without dysmorphic neurons (types I and III) |
| D. Postmigration microcephaly |
*Modified from Appendix 1, Barkovich (2012).47
Imaging features
Common imaging features of MCDs include alterations in cortical morphology, blurring of the gray–white matter junction, gray matter in abnormal locations (e.g., heterotopia), radial bands (FCD, tuberous sclerosis, hemimegalencephaly), and abnormal white matter signal intensity (e.g., FCD, tuberous sclerosis, and hemimegalencephaly). Alternations of cortical morphology include cortical thickening, hyperintensity of gray matter, disturbing gyral and sulcal patterns, including cortical dimple (FCD and polymicrogyria), paucity or lack of gyri (e.g., lissencephaly and pachygyria), and increased number of gyri (e.g., polymicrogyria).1,48
Abnormal cell proliferation or apoptosis
Abnormal cell proliferation
FCD IIb, tuberous sclerosis, and hemimegalencephaly (also known as dysplastic megalencephaly) have similar histological appearance. FCD IIb, tuberous sclerosis, hemimegalencephaly, and ganglioglioma are all the result of mutations of the mTOR (mammalian target of Rapamycin) pathway for cell growth and share some imaging features—for example, cortical thickening, subcortical white matter hyperintensity on FLAIR, and radial bands that can be found in FCD IIb, tuberous sclerosis, as well as hemimegalencephaly. There is evidence to suggest that these disorders (so-called mTORpathies) may be more similar than previously thought, with some hemimegalencephalies more focal in nature and some FCD IIb being more extensive than typically thought of.1 From an imaging perspective, hemimegalencephaly represents hemispheric overgrowth (or hypertrophy of part of a hemisphere), often associated with dysplastic cortex, heterotopia, or increased signal within the white matter (Figure 5).48 Both in hemimegalencephaly and hemiatrophy, the lateral ventricular enlargement is ipsilateral to the affected side. The cortical tubers of tuberous sclerosis are very similar to FCD both from histologic and imaging perspectives. In contrast to tuberous sclerosis, FCD is a solitary abnormality and not associated with subependymal tubers. A few features have been reported to be helpful in radiological differentiation between FCD subtypes and tuberous sclerosis cortical tubers. FCD typically does not enhance, as opposed to 5% of enhancement rate with cortical tubers49 Cortical tubers may grow larger or reveal cystic or calcific changes over time, as opposed to static appearance of FCD.
Figure 5.

Hemimegalencephaly, partial. Axial T1W image displays an enlarged posterior left hemisphere, with dysplastic hyperintense cortex associated with blurred gray–white junction (white arrows) and periventricular heterotopia (black arrowheads), consistent with partial hemimegalencephaly. Identification is more challenging when hemimegalencephaly involves only a portion of a hemisphere instead of the entire hemisphere.
Focal cortical dysplasia
FCD is circumscribed MCD that results from abnormal neuronal proliferation, migration, and differentiation. Seizure onset is almost always prior to 16 years old, and epilepsy is often pharmacoresistant.50 Only 5%-10% of all epilepsy patients will have FCD, but in children with focal drug-resistant epilepsy, the prevalence of FCD increases to 50%. The epileptogenic zone of FCDs may extend beyond the anatomically defined lesion boundaries on MRI, based on invasive EEG and F-18 FDG-PET/CT imaging.51 While PET/CT hypometabolic activity has a low sensitivity for localizing FCD by visual analysis, this can be significantly increased by combining quantitative analyses of radiotracer uptake with electroclinical data and co-registration of PET with MRI images.52 In cases with no identifiable epileptogenic focus on imaging, invasive EEG remains the gold standard, which can be performed with electrodes placed on brain surface (electrocorticography using subdural grids and strips) or inside the suspected region of brain parenchyma (depth electrodes).7
The ILAE classifies FCD into type 1, mild cortical dyslamination; type 2a, dyslamination plus dysmorphic cells; type 2b, type 2a plus balloon cells; and type 3, FCD associated with another epileptogenic lesion (Table 2).53 Balloon cells have features of both glia and neurons and may represent a progenitor cell. MRI findings may be quite subtle, with type 1 much more difficult to detect as compared to type 253,54; According to the scheme developed by Barkovich et al.47, type 2 is categorized in the abnormal proliferation category, while type 1 is classified as being within the abnormal postmigration development group. Mild malformations of cortical development, including those with oligodendroglial hypertrophy (MOGHE) are recently recognized focal cortical dysplasias.541
Table 2.
Focal cortical dysplasia classification
| Type I: disrupted cortical lamination (isolated) |
| Ia: abnormal radial cortical lamination |
| Ib: abnormal tangential cortical lamination |
| Ic: abnormal radial and tangential cortical lamination |
| Type II: disrupted cortical lamination and cytologic abnormalities (isolated) |
| IIa: dysmorphic neurons |
| IIb: dysmorphic neurons and balloon cells |
| Type III: disrupted cortical lamination associated with a lesion |
| IIIa: hHippocampal sclerosis |
| IIIb: gGlial or glioneuronal tumor |
| IIIc: vascular malformation |
| IIId: early life acquired abnormality (e.g., injury, encephalitis, ischemia) |
The International League Against Epilepsy standardized the classification of focal cortical dysplasia, a heterogeneous group of abnormalities, representing a localized area with disrupted cortical organization and abnormal neurons53.
MRI features of FCD include localized increase in cortical thickness, localized increase in cortical signal without other known cause, ill-defined or irregular cortical-white matter junction, localized subcortical signal located at the bottom of a sulcus, asymmetrical gyral pattern, abnormal depth or widening of the overlying sulcus, abnormal subcortical white matter signal, and associated transmantle signal changes (also known as a radial band) (Figures 6, 7).53,54 A 2019 study found transmantle signal changes to be hyperintense on T1-weighted imaging in a minority of patients with type IIb FCD.49 Five following general themes of FCD have also been described: anterior temporal lobe type gyral malformation predominant theme which is localized to one brain region with thickening or lobularity of the cortex (most commonly frontal lobe), cortical signal predominant theme where there is abnormal increased or decreased cortical T2 signal but without significant gyral abnormalities (most commonly occipital lobe), subcortical predominant theme, which has localized subcortical signal changes localized to a gyrus and usually with blurring of the gray–white matter junction, and transmantle type theme where there is tapering deep white matter signal from the gyrus to ventricle margin (FCD type 2).54 With FCD underlying up to 50% of intractable epilepsy that is potentially curable by surgery, it is imperative that strategies for detection using MRI be optimized, both from protocol and interpretation perspectives. These abnormalities are often very subtle and FCD is too important an entity to fail to detect.
Figure 6.

Focal cortical dysplasia. A 28-year-old female with medically refractory seizures since age 4, consisting of left arm tingling and dystonia; EEG suggested midline central origin. MRI was initially interpreted as normal, but reevaluation after knowledge of semiology and EEG findings revealed minimally thickened, hyperintense gyrus with blurred gray–white interface, in the right paracentral lobule (white arrow) on axial T1W (a) and axial FLAIR (b) images. Very subtle radial band (arrowhead) is present on axial FLAIR (c). This was confirmed on an oblique coronal reformatted image (d), showing subtle subcortical hyperintensity (arrow) with a radial band to the ventricle (arrowheads). F-18 FDG-PET also confirmed this abnormal region. (e). Focal cortical dysplasia type IIb in a different patient with seizure onset at age 15 consisted of episodes of flashing lights. A right parietal lesion was resected and showed both dysmorphic neurons (black arrow) and balloon cells with eccentric nucleus (arrowhead) on photomicrograph (original magnification, 20×; hematoxylin-eosin (H-E) stain). F-18 FDG-PET, F-18-fluorodeoxyglucose positron emission tomography.
Figure 7.

Focal cortical dysplasia (FCD). A 2-year-old boy with intractable right arm and leg clonic seizures with FCD IIa. Axial T1W image (a) demonstrates markedly disorganized perirolandic sulcal pattern (compared to normal right central sulcus), pronounced thickening of the cortex with hyperintensity, and blurring of the cortical-white matter junction (arrows). Intraoperative photograph of brain surface with subdural grid electrodes (b) found marked distortion of brain motor representation, compared to the typical motor homunculus pattern (motor activity represented by electrodes in green; seizure activity represented by electrodes in blue, which were located adjacent to the interhemispheric fissure). Seizure freedom was obtained after functional hemispherectomy.
Tuberous sclerosis complex
Tuberous sclerosis complex (TSC) is a rare, autosomal-dominant neurocutaneous disorder resulting from TSC1 and TSC2 mTOR pathway genes leading to excessive cell proliferation and hamartomatous lesions in various organs and systems.55 CNS findings are characterized by multiple cortical tubers, subependymal nodules, subependymal giant cell astrocytoma (SEGA), and white matter lesions (Figure 8). Less-frequent CNS findings include cerebral or cerebellar malformations, hemimegaloencephaly, and vascular abnormalities. Intellectual disability and intractable seizures are main neurological manifestations. Imaging plays a crucial role in the diagnosis and monitoring of TSC. The patients are primarily of pediatric age group and MRI is the modality of choice, as it possesses no ionizing radiation exposure and has excellent image resolution. In the first years of infancy, tubers might not be appreciated on MRI due to ongoing myelination process but grow in size proportionally to the brain development. Aside from primary diagnosis, MRI has a critical role in monitoring TSC cases for potential SEGA development and temporal changes in the lesions. SEGA, a World Health Organization (WHO) grade I astrocytoma, typically develops in the region of foramen of Monro along the caudothalamic groove, though occasionally it may develop elsewhere along the ventricles or even within the cortical tubers. Imaging is also important to determine which tuber is epileptogenic. Nuclear medicine studies including PET/CT and single photon emission computed tomography (SPECT) are the modalities of choice for this aim, though recent MRI features have also been described that can help identify the epileptogenic tuber. Increased uptake of ictal α-[11C]-methyl-l-tryptophan PET is indicative of a seizure-triggering tuber.56 Similarly, SPECT performed using Tc-99m-HMPAO can demonstrate increased radiotracer uptake on ictal imaging.57 F-18 FDG-PET/CT helps identifying hypometabolic tubers (seizure triggering focus) on interictal imaging.58 Tubers with higher ADC (apparent diffusion coefficient) values may represent epileptogenic foci, as these foci are more likely to undergo internal architectural changes.59 Those with increased relative cerebral blood parameters on perfusion-weighted images using arterial spin labeling are also likely to represent epileptogenic focus.59 Studies utilizing combined EEG-fMRI data have shown a higher BOLD activity surrounding the known epileptogenic zone, which may suggest a larger network activity surrounding a triggering focus in children.60 Although EEG-fMRI studies were not able to pinpoint zones of increased interictal epileptogenic discharges, they provide valuable information.
Figure 8.

Tuberous sclerosis complex. (a) Hyperintense cortical tubers in the subcortical white matter with associated with radial bands (arrows) on coronal FLAIR. (b, c) Different patient with tuberous sclerosis. (b) Subependymal periventricular nodule (note signal void representing calcification on axial SWI [susceptibility weighted image]). (c) Enhancing (left greater than right) subependymal giant cell astrocytomas (arrow points to left SEGA on axial postcontrast T1W MP-RAGE [magnetization-prepared rapid acquisitive gradient echo] image). SEGA, subependymal giant cell astrocytoma.
Abnormal migration
Malformations due to abnormal migration include heterotopia, lissencephaly, and cobblestone malformations.1
Lissencephaly can be divided into classic and variant lissencephaly subgroups. Microtubules and microtubule-associated proteins play a crucial role in the migration of neurons along radial pathways from the ventricular zone to cortical plate and are responsible for heterotopia or classic lissencephaly. Classic lissencephaly has phenotypes ranging from agyria (Figure 9) to pachygyria or subcortical band heterotopia. While the cortex is generally simplified, it may sometimes be polymicrogyria-like. There is generally a subcortical cell-sparse zone. Mutations of the LIS1 gene may cause partial subcortical band heterotopia that may be subtle.61,62 The variant lissencephalies are due to mutations in the ARX (Aristaless-related homebox) or Reeling signaling pathway. These lissencephalies have slightly thickened cortex with anterior to posterior gradient and no cell-sparse zone; the extent of smooth cortex is variable. ARX mutations are associated with a small dysplastic basal ganglia and absent corpus callosum. Reeling mutations are associated with cerebellar hypoplasia. Previously referred to as type II lissencephaly, cobblestone malformations are due to defects in basement membrane.
Figure 9.
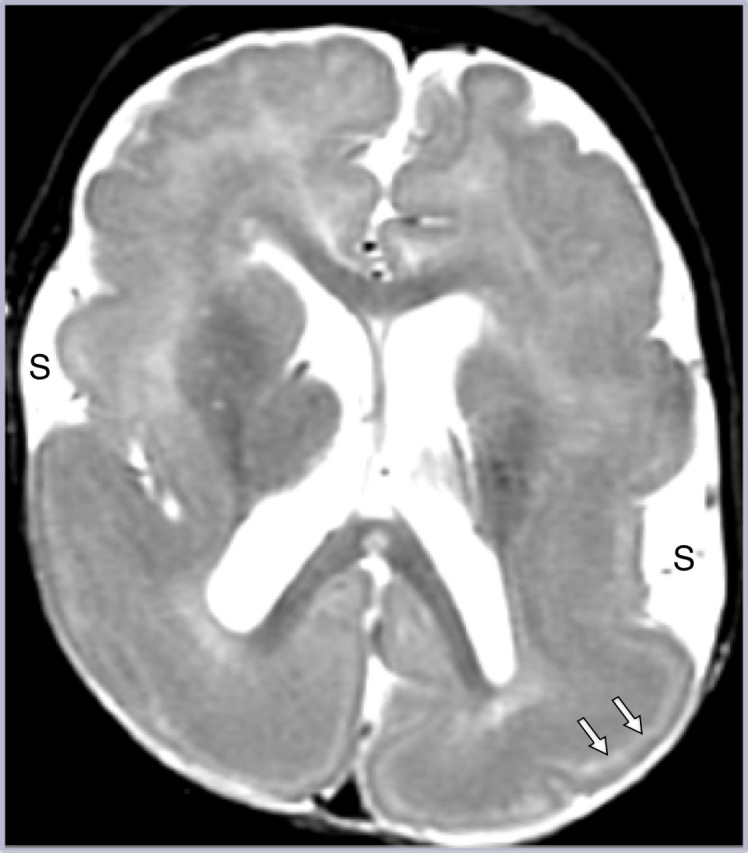
Lissencephaly. There is generalized smooth thickened cortex, with open Sylvian fissures (S) with poor gray–white junction and paucity of white matter on axial T2W imaging, representing classic lissencephaly. Note the hyperintense sparse cell zone with increased water content on T2W imaging (white arrows), a feature of lissencephaly which can sometimes be misinterpreted as indicating double cortex syndrome (band heterotopia).
Heterotopia. Seizures can arise from the heterotopic gray matter, the overlying cortex, or both. Periventricular nodular heterotopia appears to be due to mutations resulting in neuronal migration of the radial scaffolding and/or disruption of the continuity of the neuroependyma leading to inability of the proliferating neurons to adhere to the radial scaffolding.1 Gray matter should never be present lateral to the lateral ventricle and can sometimes be quite small. Subcortical heterotopia can have a varied MR appearance, sometimes extending from ventricle to cortex, and may be mistaken for other disorders.48
Abnormal cortical organization
Polymicrogyria and schizencephaly (with underlying histology of polymicrogyria) are disorders with multiple small gyri and sulci, caused by a wide variety of etiologies (Figure 10).1,48 Polymicrogyria syndromes include bilateral perisylvian, bilateral frontal, and bilateral parieto-occipital. The most common is bilateral perisylvian polymicrogyria syndrome, during which the Sylvian fissure often fuses with the central sulcus. Polymicrogyria is often associated with other malformations, such as schizencephaly or heterotopia. When the microgyria are very closely spaced, the cortex may appear thickened on MR images rather than a collection of small gyri. When such cases occur bilaterally, it may be difficult to distinguish from pachygyria phenotype of lissencephaly, but the more diffuse nature of lissencephaly as opposed to the syndromic locations of polymicrogyria is often a helpful differentiating feature.
Figure 10.

Polymicrogyria. Right polymicrogyria is nicely depicted on sagittal (a) and coronal (b) T1W imaging as numerous small gyri (arrows). The perisylvian location, as seen here, is the most common region affected and often results in fusion of the Sylvian fissure with the central sulcus (arrowheads), as in this case. Findings may be unilateral or bilateral; when bilateral asymmetric, it may be easy to overlook a subtle contralateral abnormality (as in this case, with very subtle thickening and increased nodularity of the contralateral left insula and frontal operculum).
FCD type 1 was discussed previously.
Other entities associated with epilepsy
Overview
A host of abnormalities can precipitate seizures, which develop into epilepsy. These include neoplasms, vascular malformations, infections, trauma, Sturge Weber syndrome, and hypoxic-ischemic insults. However, this section will focus on recent imaging advances and understanding of the following unique and/or subtle abnormalities associated epilepsy—hypothalamic hamartomas, ulegyria, Rasmussen’s encephalitis, and ictal phenomena.
Hypothalamic hamartoma
Hypothalamic hamartoma is a non-neoplastic congenital malformation with intrinsic pacemaker-like activity, composed histologically of glia cells and normally appearing neurons, often the GABAergic interneuron phenotype. Mutations of the sonic hedgehog pathway have been implicated.63 Patients may exhibit seizures, often the gelastic phenotype, precious puberty, developmental delay, and/or behavioral disturbances. Epileptogenic hamartomas vary in MR signal intensity from being isointense to gray matter using conventional spin-echo sequences to being slightly hyperintense on fast spin-echo T2-weighted sequences and slightly hypointense on T1-weighted 3D volume or inversion recovery sequences; the percentage of glial cells may affect the signal characteristics.64 Hamartomas characteristically do not enhance, are usually stable over time, and are often connected to the mammillary body, either as a pedunculated or sessile mass.64,65 Mean size of lesions in most studies is between 1 and 2 cm. These lesions may easily escape visual detection unless one employs a systematic approach that includes the hypothalamus and specifically, the mammillary body (Figure 11). Treatments include radiosurgery, stereotactic radiofrequency ablation, endoscopic resection or disconnection, and open craniotomy.
Figure 11.

Hypothalamic hamartoma. An 8-year-old boy with complex partial seizure. Coronal T1W image demonstrates a hypothalamic mass (arrow) encompassing the mammillary body that was isointense to gray matter on multiple sequences, consistent with a hypothalamic hamartoma. A patterned interpretation approach must include the evaluation of the hypothalamus and mamillary body in patients with epilepsy to detect subtle lesions.
Ulegyria
Full-term infants who experience mild-moderate global hypoxic-ischemic events can have a cortical and subcortical injury pattern, typically in a watershed and parasagittal distribution. It may be unilateral or bilateral and often posterior. Due to relatively increased perfusion to the gyral apex versus base the base of the gyrus in newborns, this injury results in a characteristic mushroom-shaped appearance of the affected gyri on MRI, termed “ulegyria” (Figure 12). Gliosis in underlying subcortical white matter, porencephalic cysts, and deep gray matter involvement may be seen, depending on the severity of initial injury. Symptoms are often manifested by cerebral palsy, mental retardation, and pharmacoresistant complex partial seizures. Mean age at seizure onset is 4 years, with variable semiology often involving visual auras due to their posterior location. In 1 case series of 25 patients, 48% had additional HS.66 It is important to recognize that patients with unilateral, bilateral, and perisylvian ulegyrias may benefit from surgical interventions, as discussed in “Surgical Interventions.”67,68
Figure 12.

Ulegyria. A 11-year-old boy with family history of coagulation disorder had infarcts at 2 weeks of age and perinatal seizures. Coronal FLAIR (a) and T2W imaging (b) demonstrate typical bilateral watershed-territory ulegyria. Note the atrophic gyri with mushroom-like configuration at the dome (black arrow), dilatation of CSF at the depth of the sulci (white arrow), subcortical white matter signal changes, and bilateral parasagittal locations. CSF, cerebrospinal fluid.
Rasmussen’s encephalitis and ictal phenomena
Rasmussen’s encephalitis is an immune-mediated unilateral progressive hemispheric encephalopathy, with characteristic drug-resistant epilepsy and progressive decline, usually in children.69 This rare encephalitis is thought to be mediated by cytotoxic T-cells. There are 3 clinical stages, starting with a prodromal motor seizure stage, followed by an acute/active stage with epilepsia partialis continua and progressive hemiplegia. This ultimately evolves into a chronic residual stage, manifested by seizures and end-stage hemispheric failure.
MRI abnormalities often have focal site of onset and spread across a single hemisphere over time.69 The earliest regions of involvement are often the insula, perisylvian region, caudate head, and putamen. Serial MRI may show fluctuations in imaging appearance with abnormal hyperintensity on FLAIR involving cortical and subcortical regions, which are considered to be related to changes from frequent seizures or status epilepticus (Figure 13). One study noted that one-third of patients demonstrated regression followed by reappearance of high-intensity lesions, which may be considered a diagnostic feature of this disorder.70 Over time, unilateral hemisphere volume loss and long TR hyperintensity from gliosis occur. Treatment is anatomical or functional hemispherectomy. In ictal phenomena, signal changes are located at the epileptogenic focus in the cortex and in structures along the seizure propagation pathway such as the thalamus and basal ganglia. The hippocampus is the most common site of abnormal signal changes (T2 prolongation), particularly in partial seizures.71-73 Patients with status epilepticus are more likely to have only partially reversible signal abnormalities.71-73
Figure 13.

Rasmussen’s encephalitis. A 5-year-old girl with 1-year history of right body twitching that developed into right body motor partial status epilepticus. Left parietal white matter hyperintensity (black arrow) was present on initial axial FLAIR MRI (a), which extended into adjacent white and gray matter as subtle hyperintensity, with loss of gray–white matter junction (white arrows), 1 year later (b). MR imaging findings were compatible with Rasmussen’s progression and ictal changes, with possible concomitant FCD. F-18 FDG PET-CT (not shown) revealed hypometabolism in the left cerebral hemisphere. Biopsy revealed perivascular distribution of CD3/8 positive T-cells and microglial cells (CD68) with type Ib FCD, consistent with Rasmussen encephalitis in the setting of dual pathology. MRI, magnetic resonance imaging; F-18 FDG-PET, F-18-fluorodeoxyglucose positron emission tomography; FCD, focal cortical dysplasia.
Long-term epilepsy-associated tumors
In about 30% of patients with long-term pharmacoresistant epilepsy, neuroepithelial neoplasms such as gangliogliomas are encountered (i.e., long-term epilepsy-associated tumors, LEATs).74 Approximately 70% of LEATs are WHO grade I tumors, most commonly gangliogliomas (57%), followed by pilocytic astrocytomas (23%) and dysembryoplastic neuroepithelial tumors (20%).74 WHO grade II and III tumors are less-frequent, encountered approximately in 29% and 1%, respectively, based on a series of 207 patients with intractable epilepsy.74 Gangliogliomas, characteristically cortically based enhancing cystic nodules on imaging, are associated with cortical disorganization in above 80% of cases.75 Presence of cortical thickening and transmantle sign is important to differentiate FCD (Figure 6) from low-grade tumors. Since MRI features are better appreciated on scanners with higher magnetic fields, imaging should be performed preferably with 3T strength or above.
Surgical interventions
A variety of surgical approaches are available for patients with treatment-resistant intractable epilepsy. These include surgical resection or invasive neuromodulation. In well-defined focal lesions that are concordant with electroclinical data, lesionectomy is the procedure of choice. In patients with extensive burden of lesions and less-favorable clinical outcome, functional lobectomy or tailored hemispherectomy can be performed (such as in Rasmussen encephalitis or hypotonic seizures). If resectable focal lesions are anatomically close to eloquent cortex, such as language or sensorimotor cortices, or if surgery is contraindicated, minimally invasive neuromodulation techniques are preferred. Widely applied neuromodulation applications include deep brain stimulation, vagus nerve stimulation, and responsive neurostimulation, among other investigative techniques that are less-invasive but not yet in clinical use (such as transcranial magnetic stimulation or focused ultrasound).7 In these cases, the primary goal is to disrupt the propagation of epileptogenic activity within a network. One should keep in mind that surgical approach is tailored, and each person may have a different journey of epilepsy treatment, which may include a single or a combination of surgical approaches discussed above.
Conclusion
Over the last couple of decades, HS has declined in incidence at epilepsy surgery, while MCD and other disorders, such as encephaloceles and AME, have increased. Since many epileptogenic abnormalities affect the temporal lobe, it is critical to have coronal long TR images for assessment, in order to arrive at the appropriate diagnosis. Detection of FCD requires thin section imaging with high contrast resolution. Awareness of the subtle and unique abnormalities that cause seizures, and use of a systematic checklist when interpreting MR studies, is critical for successful imaging diagnosis.
Footnotes
Conflict of interest disclosure The authors declared no conflicts of interest.
References
- 1. Barkovich AJ, Dobyns WB, Guerrini R. Malformations of cortical development and epilepsy. Cold Spring Harb Perspect Med. 2015;5(5):a022392. 10.1101/cshperspect.a022392) [DOI] [PMC free article] [PubMed] [Google Scholar]
- 2. Muhlhofer W, Tan YL, Mueller SG, Knowlton R. MRI-negative temporal lobe epilepsy-what do we know? Epilepsia. 2017;58(5):727 742. 10.1111/epi.13699) [DOI] [PubMed] [Google Scholar]
- 3. Jehi L, Friedman D, Carlson C.et al. The evolution of epilepsy surgery between 1991 and 2011 in nine major epilepsy centers across the United States, Germany, and Australia. Epilepsia. 2015;56(10):1526 1533. 10.1111/epi.13116) [DOI] [PMC free article] [PubMed] [Google Scholar]
- 4. Richardson MP. Large scale brain models of epilepsy: dynamics meets connectomics. J Neurol Neurosurg Psychiatry. 2012;83(12):1238 1248. 10.1136/jnnp-2011-301944) [DOI] [PubMed] [Google Scholar]
- 5. Spencer SS. Neural networks in human epilepsy: evidence of and implications for treatment. Epilepsia. 2002;43(3):219 227. 10.1046/j.1528-1157.2002.26901.x) [DOI] [PubMed] [Google Scholar]
- 6. Fiest KM, Sauro KM, Wiebe S.et al. Prevalence and incidence of epilepsy: a systematic review and meta-analysis of international studies. Neurology. 2017;88(3):296 303. 10.1212/WNL.0000000000003509) [DOI] [PMC free article] [PubMed] [Google Scholar]
- 7. Adin ME, Spencer DD, Damisah E, Herlopian A, Gerrard JL, Bronen RA. Imaging of neuromodulation and surgical interventions for epilepsy. AJNR Am J Neuroradiol. 2021;42(10):1742 1750. 10.3174/ajnr.A7222) [DOI] [PMC free article] [PubMed] [Google Scholar]
- 8. Kini LG, Gee JC, Litt B. Computational analysis in epilepsy neuroimaging: a survey of features and methods. NeuroImage Clin. 2016;11:515 529. 10.1016/j.nicl.2016.02.013) [DOI] [PMC free article] [PubMed] [Google Scholar]
- 9. David B, Kröll‐Seger J, Schuch F.et al. External validation of automated focal cortical dysplasia detection using morphometric analysis. Epilepsia. 2021;62(4):1005 1021. 10.1111/epi.16853) [DOI] [PubMed] [Google Scholar]
- 10. Hassankhani A, Stein JM, Haboosheh AG, Vossough A, Loevner LA, Nabavizadeh SA. Anatomical variations, mimics, and pitfalls in imaging of patients with epilepsy. J Neuroimaging. 2021;31(1):20 34. 10.1111/jon.12809) [DOI] [PubMed] [Google Scholar]
- 11. Martinez-Rios C, McAndrews MP, Logan W, Krings T, Lee D, Widjaja E. MRI in the evaluation of localization-related epilepsy. J Magn Reson Imaging. 2016;44(1):12 22. 10.1002/jmri.25269) [DOI] [PubMed] [Google Scholar]
- 12. Von Oertzen J, Urbach H, Jungbluth S.et al. Standard magnetic resonance imaging is inadequate for patients with refractory focal epilepsy. J Neurol Neurosurg Psychiatry. 2002;73(6):643 647. 10.1136/jnnp.73.6.643) [DOI] [PMC free article] [PubMed] [Google Scholar]
- 13. Wellmer J, Quesada CM, Rothe L, Elger CE, Bien CG, Urbach H. Proposal for a magnetic resonance imaging protocol for the detection of epileptogenic lesions at early outpatient stages. Epilepsia. 2013;54(11):1977 1987. 10.1111/epi.12375) [DOI] [PubMed] [Google Scholar]
- 14. Bernasconi A, Cendes F, Theodore WH, et al. Recommendations for the use of structural magnetic resonance imaging in the care of patient with epilepsy: A consensus report from the International League Against Epilepsy Neuroimaging Task Force. 2019;60:1054-1068. [DOI] [PubMed] [Google Scholar]
- 15. Daghistani R, Widjaja E. Role of MRI in patient selection for surgical treatment of intractable epilepsy in infancy. Brain Dev. 2013;35(8):697 705. 10.1016/j.braindev.2013.03.009) [DOI] [PubMed] [Google Scholar]
- 16. Winston GP, Micallef C, Kendell BE.et al. The value of repeat neuroimaging for epilepsy at a tertiary referral centre: 16 years of experience. Epilepsy Res. 2013;105(3):349 355. 10.1016/j.eplepsyres.2013.02.022) [DOI] [PMC free article] [PubMed] [Google Scholar]
- 17. Bronen RA, Knowlton R, Garwood M, Maravilla KR, Jack CR. High‐resolution imaging in epilepsy. Epilepsia. 2002;43:11 18. 10.1046/j.1528-1157.2002.043s1011.x) 12060002 [DOI] [Google Scholar]
- 18. Wang I, Oh S, Blümcke I.et al. Value of 7T MRI and post‐processing in patients with nonlesional 3T MRI undergoing epilepsy presurgical evaluation. Epilepsia. 2020;61(11):2509 2520. 10.1111/epi.16682) [DOI] [PMC free article] [PubMed] [Google Scholar]
- 19. Jackson GD, Connelly A, Duncan JS, Grünewald RA, Gadian DG. Detection of hippocampal pathology in intractable partial epilepsy: increased sensitivity with quantitative magnetic resonance T2 relaxometry. Neurology. 1993;43(9):1793-1799. 10.1212/wnl.43.9.1793) [DOI] [PubMed] [Google Scholar]
- 20. Garbelli R, Milesi G, Medici V.et al. Blurring in patients with temporal lobe epilepsy: clinical, high-field imaging and ultrastructural study. Brain. 2012;135(8):2337 2349. 10.1093/brain/aws149) [DOI] [PubMed] [Google Scholar]
- 21. Labate A, Gambardella A, Aguglia U.et al. Temporal lobe abnormalities on brain MRI in healthy volunteers: a prospective case-control study. Neurology. 2010;74(7):553 557. 10.1212/WNL.0b013e3181cff747) [DOI] [PubMed] [Google Scholar]
- 22. Blümcke I, Thom M, Aronica E.et al. International consensus classification of hippocampal sclerosis in temporal lobe epilepsy: a Task Force report from the ILAE Commission on Diagnostic Methods. Epilepsia. 2013;54(7):1315 1329. 10.1111/epi.12220) [DOI] [PubMed] [Google Scholar]
- 23. Jardim AP, Corso JT, Garcia MTFC.et al. Hippocampal atrophy on MRI is predictive of histopathological patterns and surgical prognosis in mesial temporal lobe epilepsy with hippocampal sclerosis. Epilepsy Res. 2016;128:169 175. 10.1016/j.eplepsyres.2016.10.014) [DOI] [PubMed] [Google Scholar]
- 24. Zhang Y, Lv Y, You H.et al. Study of the hippocampal internal architecture in temporal lobe epilepsy using 7 T and 3 T MRI. Seizure. 2019;71:116 123. 10.1016/j.seizure.2019.06.023) [DOI] [PubMed] [Google Scholar]
- 25. Téllez-Zenteno JF, Hernández Ronquillo L, Moien-Afshari F, Wiebe S. Surgical outcomes in lesional and non-lesional epilepsy: a systematic review and meta-analysis. Epilepsy Res. 2010;89(2-3):310 318. 10.1016/j.eplepsyres.2010.02.007) [DOI] [PubMed] [Google Scholar]
- 26. Coan AC, Kubota B, Bergo FP, Campos BM, Cendes F. 3T MRI quantification of hippocampal volume and signal in mesial temporal lobe epilepsy improves detection of hippocampal sclerosis. AJNR Am J Neuroradiol. 2014;35(1):77 83. 10.3174/ajnr.A3640) [DOI] [PMC free article] [PubMed] [Google Scholar]
- 27. Kim DW, Lee SK, Nam H.et al. Epilepsy with dual pathology: surgical treatment of cortical dysplasia accompanied by hippocampal sclerosis. Epilepsia. 2010;51(8):1429 1435. 10.1111/j.1528-1167.2009.02403.x) [DOI] [PubMed] [Google Scholar]
- 28. Kuchukhidze G, Koppelstaetter F, Unterberger I.et al. Hippocampal abnormalities in malformations of cortical development: MRI study. Neurology. 2010;74(20):1575 1582. 10.1212/WNL.0b013e3181df09b6) [DOI] [PubMed] [Google Scholar]
- 29. Li LM, Cendes F, Andermann F.et al. Surgical outcome in patients with epilepsy and dual pathology. Brain. 1999;122(5):799 805. 10.1093/brain/122.5.799) [DOI] [PubMed] [Google Scholar]
- 30. Bronen RA, Cheung G. MRI of the normal hippocampus. Magn Reson Imaging. 1991;9(4):497 500. 10.1016/0730-725x(91)90035-k) [DOI] [PubMed] [Google Scholar]
- 31. Barsi P, Kenéz J, Solymosi D.et al. Hippocampal malrotation with normal corpus callosum: a new entity? Neuroradiology. 2000;42(5):339 345. 10.1007/s002340050895) [DOI] [PubMed] [Google Scholar]
- 32. Gamss RP, Slasky SE, Bello JA, Miller TS, Shinnar S. Prevalence of hippocampal malrotation in a population without seizures. AJNR Am J Neuroradiol. 2009;30(8):1571 1573. 10.3174/ajnr.A1657) [DOI] [PMC free article] [PubMed] [Google Scholar]
- 33. Leach JL, Awwad R, Greiner HM, Vannest JJ, Miles L, Mangano FT. Mesial temporal lobe morphology in intractable pediatric epilepsy: so-called hippocampal malrotation, associated findings, and relevance to presurgical assessment. J Neurosurg Pediatr. 2016;17(6):683 693. 10.3171/2015.11.PEDS15485) [DOI] [PubMed] [Google Scholar]
- 34. Tsai MH, Vaughan DN, Perchyonok Y.et al. Hippocampal malrotation is an anatomic variant and has no clinical significance in MRI-negative temporal lobe epilepsy. Epilepsia. 2016;57(10):1719 1728. 10.1111/epi.13505) [DOI] [PubMed] [Google Scholar]
- 35. Beker Acay M, Köken R, Ünlü E, Kaçar E, Balçık Ç. Evaluation of hippocampal infolding angle and incomplete hippocampal inversion in pediatric patients with epilepsy and febrile seizures. Diagn Interv Radiol. 2017;23(4):326-330. 10.5152/dir.2017.160077) [DOI] [PMC free article] [PubMed] [Google Scholar]
- 36. Saavalainen T, Jutila L, Mervaala E, Kälviäinen R, Vanninen R, Immonen A. Temporal anteroinferior encephalocele: an underrecognized etiology of temporal lobe epilepsy? Neurology. 2015;85(17):1467 1474. 10.1212/WNL.0000000000002062) [DOI] [PubMed] [Google Scholar]
- 37. Toledano R, Jiménez-Huete A, Campo P.et al. Small temporal pole encephalocele: a hidden cause of “normal” MRI temporal lobe epilepsy. Epilepsia. 2016;57(5):841 851. 10.1111/epi.13371) [DOI] [PubMed] [Google Scholar]
- 38. Alonso RC, de la Peña MJ, Caicoya AG, Rodriguez MR, Moreno EA, de Vega Fernandez VM. Spontaneous skull base meningoencephaloceles and cerebrospinal fluid fistulas. RadioGraphics. 2013;33(2):553 570. 10.1148/rg.332125028) [DOI] [PubMed] [Google Scholar]
- 39. Sandhu MRS, Mandel M, McGrath1 H.et al. Management of patients with medically intractable epilepsy and anterior temporal lobe encephaloceles. J Neurosur. 2021. (In Press) [DOI] [PubMed] [Google Scholar]
- 40. Kimura Y, Sato N, Saito Y.et al. Temporal lobe epilepsy with unilateral amygdala enlargement: morphometric MR analysis with clinical and pathological study. J Neuroimaging. 2015;25(2):175 183. 10.1111/jon.12106) [DOI] [PubMed] [Google Scholar]
- 41. Barba C, Rheims S, Minotti L.et al. Temporal plus epilepsy is a major determinant of temporal lobe surgery failures. Brain. 2016;139(2):444 451. 10.1093/brain/awv372) [DOI] [PubMed] [Google Scholar]
- 42. Reyes A, Thesen T, Kuzniecky R.et al. Amygdala enlargement: temporal lobe epilepsy subtype or nonspecific finding? Epilepsy Res. 2017;132:34 40. 10.1016/j.eplepsyres.2017.02.019) [DOI] [PMC free article] [PubMed] [Google Scholar]
- 43. Leypoldt F, Armangue T, Dalmau J. Autoimmune encephalopathies. Ann N Y Acad Sci. 2015;1338:94 114. 10.1111/nyas.12553) [DOI] [PMC free article] [PubMed] [Google Scholar]
- 44. Bauer T, David B, Ernst L.et al. Structural network topology in limbic encephalitis is associated with amygdala enlargement, memory performance and serostatus. Epilepsia. 2020;61(10):e140 e145. 10.1111/epi.16691) [DOI] [PubMed] [Google Scholar]
- 45. Demaerel P, Van Dessel W, Van Paesschen W, Vandenberghe R, Van Laere K, Linn J. Autoimmune-mediated encephalitis. Neuroradiology. 2011;53(11):837 851. 10.1007/s00234-010-0832-0) [DOI] [PubMed] [Google Scholar]
- 46. Saket RR, Geschwind MD, Josephson SA, Douglas VC, Hess CP. Autoimmune-mediated encephalopathy: classification, evaluation, and MR imaging patterns of disease. Neurographics. 2011;1(1):2 16. 10.3174/ng.1110001) [DOI] [Google Scholar]
- 47. Barkovich AJ, Guerrini R, Kuzniecky RI, Jackson GD, Dobyns WB. A developmental and genetic classification for malformations of cortical development: update 2012. Brain. 2012;135(5):1348 1369. 10.1093/brain/aws019) [DOI] [PMC free article] [PubMed] [Google Scholar]
- 48. Abdel Razek AA, Kandell AY, Elsorogy LG, Elmongy A, Basett AA. Disorders of cortical formation: MR imaging features. AJNR Am J Neuroradiol. 2009;30(1):4 11. 10.3174/ajnr.A1223) [DOI] [PMC free article] [PubMed] [Google Scholar]
- 49. Kimura Y, Shioya A, Saito Y.et al. Radiologic and pathologic features of the transmantle sign in focal cortical dysplasia: the T1 signal is useful for differentiating subtypes. AJNR Am J Neuroradiol. 2019;40(6):1060 1066. 10.3174/ajnr.A6067) [DOI] [PMC free article] [PubMed] [Google Scholar]
- 50. Hauptman JS, Mathern GW. Surgical treatment of epilepsy associated with cortical dysplasia: 2012 update. Epilepsia. 2012;53(suppl 4):98 104. 10.1111/j.1528-1167.2012.03619.x) [DOI] [PubMed] [Google Scholar]
- 51. Cohen-Gadol AA, Ozduman K, Bronen RA, Kim JH, Spencer DD. Long-term outcome after epilepsy surgery for focal cortical dysplasia. J Neurosurg. 2004;101(1):55 65. 10.3171/jns.2004.101.1.0055) [DOI] [PubMed] [Google Scholar]
- 52. Desarnaud S, Mellerio C, Semah F.et al. 18 F-FDG PET in drug-resistant epilepsy due to focal cortical dysplasia type 2: additional value of electroclinical data and coregistration with MRI. Eur J Nucl Med Mol Imaging. 2018;45(8):1449 1460. 10.1007/s00259-018-3994-3) [DOI] [PubMed] [Google Scholar]
- 53. Blümcke I, Thom M, Aronica E.et al. The clinicopathologic spectrum of focal cortical dysplasias: a consensus classification proposed by an ad hoc Task Force of the ILAE Diagnostic Methods Commission. Epilepsia. 2011;52(1):158 174. 10.1111/j.1528-1167.2010.02777.x) [DOI] [PMC free article] [PubMed] [Google Scholar]
- 54. Urbach H, Kellner E, Kremers N, Blumcke I, Dermerath T. MRI of focal cortical dysplasia. Neuroradiology. 2022;64:443 452. [DOI] [PMC free article] [PubMed] [Google Scholar]
- 55. Henske EP, Jóźwiak S, Kingswood JC, Sampson JR, Thiele EA. Tuberous sclerosis complex. Nat Rev Dis Primers. 2016;2(1):16035. 10.1038/nrdp.2016.35) [DOI] [PubMed] [Google Scholar]
- 56. Chugani DC. α-methyl-L-tryptophan: mechanisms for tracer localization of epileptogenic brain regions. Biomark Med. 2011;5(5):567 575. 10.2217/bmm.11.73) [DOI] [PMC free article] [PubMed] [Google Scholar]
- 57. Koh S, Jayakar P, Resnick T, Alvarez L, Liit RE, Duchowny M. The localizing value of ictal SPECT in children with tuberous sclerosis complex and refractory partial epilepsy. Epileptic Disord. 1999;1(1):41 46. [PubMed] [Google Scholar]
- 58. Chandra PS, Salamon N, Huang J.et al. FDG‐PET/MRI coregistration and diffusion‐tensor imaging distinguish epileptogenic tubers and cortex in patients with tuberous sclerosis complex: a preliminary report. Epilepsia. 2006;47(9):1543 1549. 10.1111/j.1528-1167.2006.00627.x) [DOI] [PubMed] [Google Scholar]
- 59. Pollock JM, Whitlow CT, Tan H, Kraft RA, Burdette JH, Maldjian JA. Pulsed arterial spin-labeled MR imaging evaluation of tuberous sclerosis. AJNR Am J Neuroradiol. 2009;30(4):815 820. 10.3174/ajnr.A1428) [DOI] [PMC free article] [PubMed] [Google Scholar]
- 60. Groening K, Brodbeck V, Moeller F.et al. Combination of EEG–fMRI and EEG source analysis improves interpretation of spike-associated activation networks in paediatric pharmacoresistant focal epilepsies. Neuroimage. 2009;46(3):827 833. 10.1016/j.neuroimage.2009.02.026) [DOI] [PubMed] [Google Scholar]
- 61. Huppertz HJ, Wellmer J, Staack AM, Altenmüller DM, Urbach H, Kröll J. Voxel-based 3D MRI analysis helps to detect subtle forms of subcortical band heterotopia. Epilepsia. 2008;49(5):772 785. 10.1111/j.1528-1167.2007.01436.x) [DOI] [PubMed] [Google Scholar]
- 62. Sicca F, Kelemen A, Genton P.et al. Mosaic mutations of the LIS1 gene cause subcortical band heterotopia. Neurology. 2003;61(8):1042 1046. 10.1212/wnl.61.8.1042) [DOI] [PubMed] [Google Scholar]
- 63. Hildebrand MS, Griffin NG, Damiano JA.et al. Mutations of the sonic hedgehog pathway underlie hypothalamic hamartoma with gelastic epilepsy. Am J Hum Genet. 2016;99(2):423 429. 10.1016/j.ajhg.2016.05.031) [DOI] [PMC free article] [PubMed] [Google Scholar]
- 64. Freeman JL, Coleman LT, Wellard RM.et al. MR imaging and spectroscopic study of epileptogenic hypothalamic hamartomas: analysis of 72 cases. AJNR Am J Neuroradiol. 2004;25(3):450 462. [PMC free article] [PubMed] [Google Scholar]
- 65. Parvizi J, Le S, Foster BL.et al. Gelastic epilepsy and hypothalamic hamartomas: neuroanatomical analysis of brain lesions in 100 patients. Brain. 2011;134(10):2960 2968. 10.1093/brain/awr235) [DOI] [PubMed] [Google Scholar]
- 66. Kuchukhidze G, Unterberger I, Dobesberger J.et al. Electroclinical and imaging findings in ulegyria and epilepsy: a study on 25 patients. J Neurol Neurosurg Psychiatry. 2008;79(5):547 552. 10.1136/jnnp.2007.118216) [DOI] [PubMed] [Google Scholar]
- 67. Schilling LP, Kieling RR, Pascoal TA.et al. Bilateral perisylvian ulegyria: an under-recognized, surgically remediable epileptic syndrome. Epilepsia. 2013;54(8):1360 1367. 10.1111/epi.12160) [DOI] [PubMed] [Google Scholar]
- 68. Usui N, Mihara T, Baba K.et al. Posterior cortex epilepsy secondary to ulegyria: is it a surgically remediable syndrome? Epilepsia. 2008;49(12):1998 2007. 10.1111/j.1528-1167.2008.01697.x) [DOI] [PubMed] [Google Scholar]
- 69. Varadkar S, Bien CG, Kruse CA.et al. Rasmussen's encephalitis: clinical features, pathobiology, and treatment advances. Lancet Neurol. 2014;13(2):195 205. 10.1016/S1474-4422(13)70260-6) [DOI] [PMC free article] [PubMed] [Google Scholar]
- 70. Yamazaki E, Takahashi Y, Akasaka N, Fujiwara T, Inoue Y. Temporal changes in brain MRI findings in Rasmussen syndrome. Epileptic Disord. 2011;13(3):229 239. 10.1684/epd.2011.0464) [DOI] [PubMed] [Google Scholar]
- 71. Chan S, Chin SS, Kartha K.et al. Reversible signal abnormalities in the hippocampus and neocortex after prolonged seizures. AJNR Am J Neuroradiol. 1996;17(9):1725 1731. [PMC free article] [PubMed] [Google Scholar]
- 72. Lewis DV, Shinnar S, Hesdorffer DC.et al. Hippocampal sclerosis after febrile status epilepticus: the FEBSTAT study. Ann Neurol. 2014;75(2):178 185. 10.1002/ana.24081) [DOI] [PMC free article] [PubMed] [Google Scholar]
- 73. Bronen RA, Fulbright RK, Kim JH, Spencer SS, Spencer DD. A systematic approach for interpreting MR images of the seizure patient. AJR Am J Roentgenol. 1997;169(1):241 247. 10.2214/ajr.169.1.9207533) [DOI] [PubMed] [Google Scholar]
- 74. Luyken C, Blümcke I, Fimmers R.et al. The spectrum of long‐term epilepsy–associated tumors: long‐term seizure and tumor outcome and neurosurgical aspects. Epilepsia. 2003;44(6):822 830. 10.1046/j.1528-1157.2003.56102.x) [DOI] [PubMed] [Google Scholar]
- 75. Barba C, Coras R, Giordano F.et al. Intrinsic epileptogenicity of gangliogliomas may be independent from co-occurring focal cortical dysplasia. Epilepsy Res. 2011;97(1-2):208 213. 10.1016/j.eplepsyres.2011.07.004) [DOI] [PubMed] [Google Scholar]