

Abstract
This meta-analysis examined the effects on reading comprehension of foundational reading skills and multicomponent reading interventions provided to students with or at risk for reading difficulties or disabilities (students with RDs) in kindergarten through Grade 3. The meta-analysis included studies identified by Wanzek et al. (2016) and Wanzek et al. (2018), with an updated search through August of 2019, for a total of 47 included studies (m = 112; total student N = 7446). The weighted average effect on norm-referenced reading comprehension outcomes was estimated as g = 0.37, indicating that primary-grade interventions have an educationally meaningful effect on reading comprehension for students with RDs. Effects did not differ for interventions focused only on foundational reading skills and those that provided both foundational skills and comprehension instruction. Effects were significantly moderated by the measurement timepoint, with follow-up effect sizes being, on average, 0.16 smaller than immediate posttest effect sizes.
Keywords: Reading instruction, Reading difficulties, meta-analysis, Elementary grades
1. Introduction
The ultimate goal of all reading intervention is to promote students’ comprehension of text. Although instruction may place strong emphasis on word recognition, the objective is not simply to read words, but also to comprehend them. Ultimately, students must be able to understand, recall, organize, summarize, and evaluate information gleaned from text. The simple view of reading (Gough & Tunmer, 1986; Hoover & Gough, 1990) holds that reading comprehension is a product of word recognition and linguistic comprehension, each of which relies on a variety of knowledge sources and cognitive processing capabilities (Kim, 2017; Oakhill & Cain, 2012). According to this theory, reading intervention may be effective if it addresses word reading development, comprehension, or both. Improvement in one factor of the equation may amplify the effects of competencies in the other factor. Thus, an intervention focused on word recognition could be expected to have positive effects on text comprehension if the participating students have at least a minimal level of linguistic comprehension. However, an intervention that focuses on both word recognition and text comprehension might be expected to have an even greater effect on reading comprehension. The purpose of this meta-analysis was to examine the effects of (a) small-group and individual interventions focused on code-oriented foundational reading skills and (b) interventions that provided instruction in both foundational skills and text comprehension on reading comprehension for students in the primary grades with or at risk for reading difficulties or disabilities (hereafter, referred to as students with RDs).
Reading interventions have demonstrated positive effects on the reading comprehension of students with RDs in kindergarten (K) through Grade 3. In a meta-analysis of small-group and whole-class reading interventions provided to students with RDs in pre-K to Grade 7, Suggate (2010) reported mean Cohen’s d effect sizes for reading comprehension (based on both researcher-designed and published measures) of 0.16 for pre-K and K; 0.42 for Grade 1; 0.52 for Grade 2; and 0.46 for Grades 3 and 4. Wanzek et al. (2016), investigating the effects of interventions provided in Grades K-3 for 15 to 99 sessions, reported a mean effect size estimate (Hedge’s g) of 0.38 on standardized language and reading comprehension outcomes.
The first aim of the current meta-analysis was to extend this body of knowledge about the effects of reading interventions on reading comprehension for students with RDs in Grades K-3. Suggate (2010) ended his search in 2010. Wanzek et al. (2016) ended their search in 2013. Our research team extended our search through August of 2019, specifically examining the effects of small-group and individual (i.e., one-on-one) interventions on norm-referenced measures of reading comprehension for students with RDs in Grades K-3. In contrast to Wanzek et al. (2016), we included studies of interventions of any duration or number of sessions as long as they measured reading comprehension outcomes using norm-referenced tests. In other words, we included all of the studies with 99 or fewer intervention sessions and norm-referenced comprehension outcomes meta-analyzed by Wanzek et al. (2016) as well as those published after 2013. We also included all of the studies with 100 or more intervention sessions and norm-referenced comprehension outcomes meta-analyzed by Wanzek et al. (2018) as well as those published after 2015, when their search ended.
1.1. Impact of instructional emphasis
The second aim of this meta-analysis was to investigate whether the effects of these reading interventions on reading comprehension vary depending on the instructional emphasis of the interventions. Most reading interventions for students with RDs in the early grades include instruction in code-oriented reading skills, also known as foundational reading skills (defined here as phonological awareness, alphabet knowledge, graphophonemic knowledge, recognition of orthographic patterns, decoding, spelling, and word recognition). Primary-grade foundational skills interventions typically include the application of word reading skills during connected text reading to promote accurate and fluent reading. Some code-oriented foundational skills interventions do not include comprehension instruction. Others combine foundational skills instruction with instruction that targets text comprehension (hereafter referred to as multicomponent interventions). We aimed to examine the degree to which providing text comprehension instruction “added value” beyond the value of foundational skills instruction alone in interventions for primary-grade students with RDs.
Research supports the provision of both foundational skills instruction (Foorman et al., 2016) and comprehension strategy instruction (Shanahan et al., 2010) in primary-grade reading classrooms. There is little research evidence, however, as to the relative effects of foundational skills and multicomponent interventions on the reading comprehension of primary-grade students with RDs. Wanzek et al. (2016), in their meta-analysis of Tier 2 reading interventions for Grades K-3, investigated whether intervention effects on standardized measures of language and comprehension were moderated by the emphasis of the intervention (i.e., comparing foundational skills-only interventions with multicomponent interventions). The mean effect size for foundational skills interventions (M g = 0.44) was somewhat larger than that for multicomponent interventions (M g = 0.35), although the difference was not statistically significant. Berninger et al. (2003) directly manipulated instructional emphasis in order to investigate differential effects on comprehension outcomes, randomly assigning Grade 2 students with RDs to receive either explicit word recognition intervention, explicit reading comprehension intervention, a combination of the two, or reading-related skill practice with no explicit instruction. The authors reported no significant group differences on a test of reading comprehension. Similarly, Vadasy et al. (2002) reported no significant differences in Grade 2 reading comprehension outcomes for students with RDs who received a phonics intervention in first grade and no tutoring in second grade, compared to a group who received the same first-grade phonics intervention followed by a comprehension intervention in second grade. Thus, there is preliminary evidence that, for students with RDs in Grades 1–2, providing comprehension instruction in addition to explicit word recognition or phonics instruction may not improve reading comprehension outcomes beyond providing word-level instruction alone.
The question of differential effects depending on intervention emphasis is an important one. In typical school settings, little time is available for supplemental reading intervention; students with RDs may receive as little as 30 min of supplemental instruction per week. It may be imperative to maximize intervention time devoted to foundational reading skills, especially for students who struggle to acquire these skills in the early grades. Alternatively, students may receive relatively more benefit from early intervention that devotes some instructional time to the development of students’ text comprehension skills.
1.2. The impact of intervention dosage
In addition to the focus of intervention, we explored the degree to which outcomes for students with RDs were impacted by intervention dosage, a product of the number of intervention sessions provided and the length of those sessions. Practitioners are frequently advised to increase the intensity of reading interventions to make them more effective for students with weak response to less-intensive intervention, typically by decreasing group size and increasing intervention dosage (Denton, 2012; Gersten et al., 2008). However, empirical examinations of the impact of dosage on reading outcomes for primary-grade students with RDs have yielded mixed results. Some studies that directly examined the effects of intervention dosage have reported positive impacts of increased dosage (e.g., Al Otaiba et al., 2005), while others have found no benefit of increased dosage for students with RDs (e.g., Denton et al., 2011; Hatcher et al., 2006). Vaughn et al. (2003) found that students who were more severely impaired readers at pretest required more extensive intervention than those with higher preintervention reading scores to meet pre-established benchmarks. Both Suggate (2010) and Wanzek et al. (2016) reported nonsignificant relations between dosage of instruction and reading outcomes for primary-grade students with RDs.
1.3. The impact of research methodology variables
Finally, we investigated the degree to which aspects of research methodology impacted the effects of interventions on reading comprehension. Specifically, we examined whether study quality, type of reading comprehension measure (i.e., cloze format; passage reading with comprehension questions; sentence comprehension), and measurement timepoint (i.e., immediately following the intervention vs. at follow-up) influenced intervention effects. The study quality variable reflected each study’s use of a norm-referenced outcome measure as well as study research design (i.e., participant randomization), sample size, and measurement and reporting of fidelity of implementation (Slavin & Madden, 2011; Slavin & Smith, 2009; What Works Clearinghouse [WWC], 2020). These variables have been shown to impact treatment effects in previous research, with studies that have larger sample sizes and/or higher overall quality ratings generally being associated with lower effect sizes (Cheung & Slavin, 2012; Hall et al., 2017; Scammacca et al., 2015; Slavin & Smith, 2009).
Student outcomes may also vary depending on how comprehension is measured. Some measures of reading comprehension require students to make sense of only one or two sentences; others require students to read one or more paragraphs and respond to questions about them. There is evidence that measures of reading comprehension typically used in reading intervention studies differ in the extent to which they explain variance in students’ decoding skills versus students’ linguistic comprehension (Cutting & Scarborough, 2009; Keenan et al., 2008). Finally, intervention effects would be expected to be strongest on measures administered immediately after the end of the intervention. Effects on measures administered at follow-up, weeks or months after the last intervention session, would be expected to be diluted somewhat (Suggate, 2010).
1.4. Research questions
This meta-analysis addressed the following questions:
What is the main effect on reading comprehension of small-group and individual reading interventions that provide instruction in code-oriented foundational reading skills, with or without instruction in text comprehension, for students in Grades K-3 with RDs?
Are effects on reading comprehension moderated by the focus of instruction? Specifically, do effects differ for foundational skills-only interventions relative to multicomponent interventions that provide foundational skills instruction combined with instruction in text comprehension?
Are effects on reading comprehension moderated by the dosage of intervention provided or methodological factors (i.e., study quality, whether comprehension was measured at the conclusion of the intervention or at follow-up, how comprehension was measured in the study)?
2. Method
This meta-analysis included studies analyzed by Wanzek et al. (2016) and Wanzek et al. (2018) that met our present criteria for inclusion, as well as studies published after the end date of their searches and before September of 2019. To identify relevant articles published from 1995 through 2013, the first author reviewed the study information reported by Wanzek et al. (2016, 2018) to select studies that reported outcomes on standardized tests of reading comprehension. From those prior meta-analyses, 47 articles were included in the full-text review to ensure that they met our additional inclusion criteria. Fig. 1 outlines the search process.
Fig. 1.
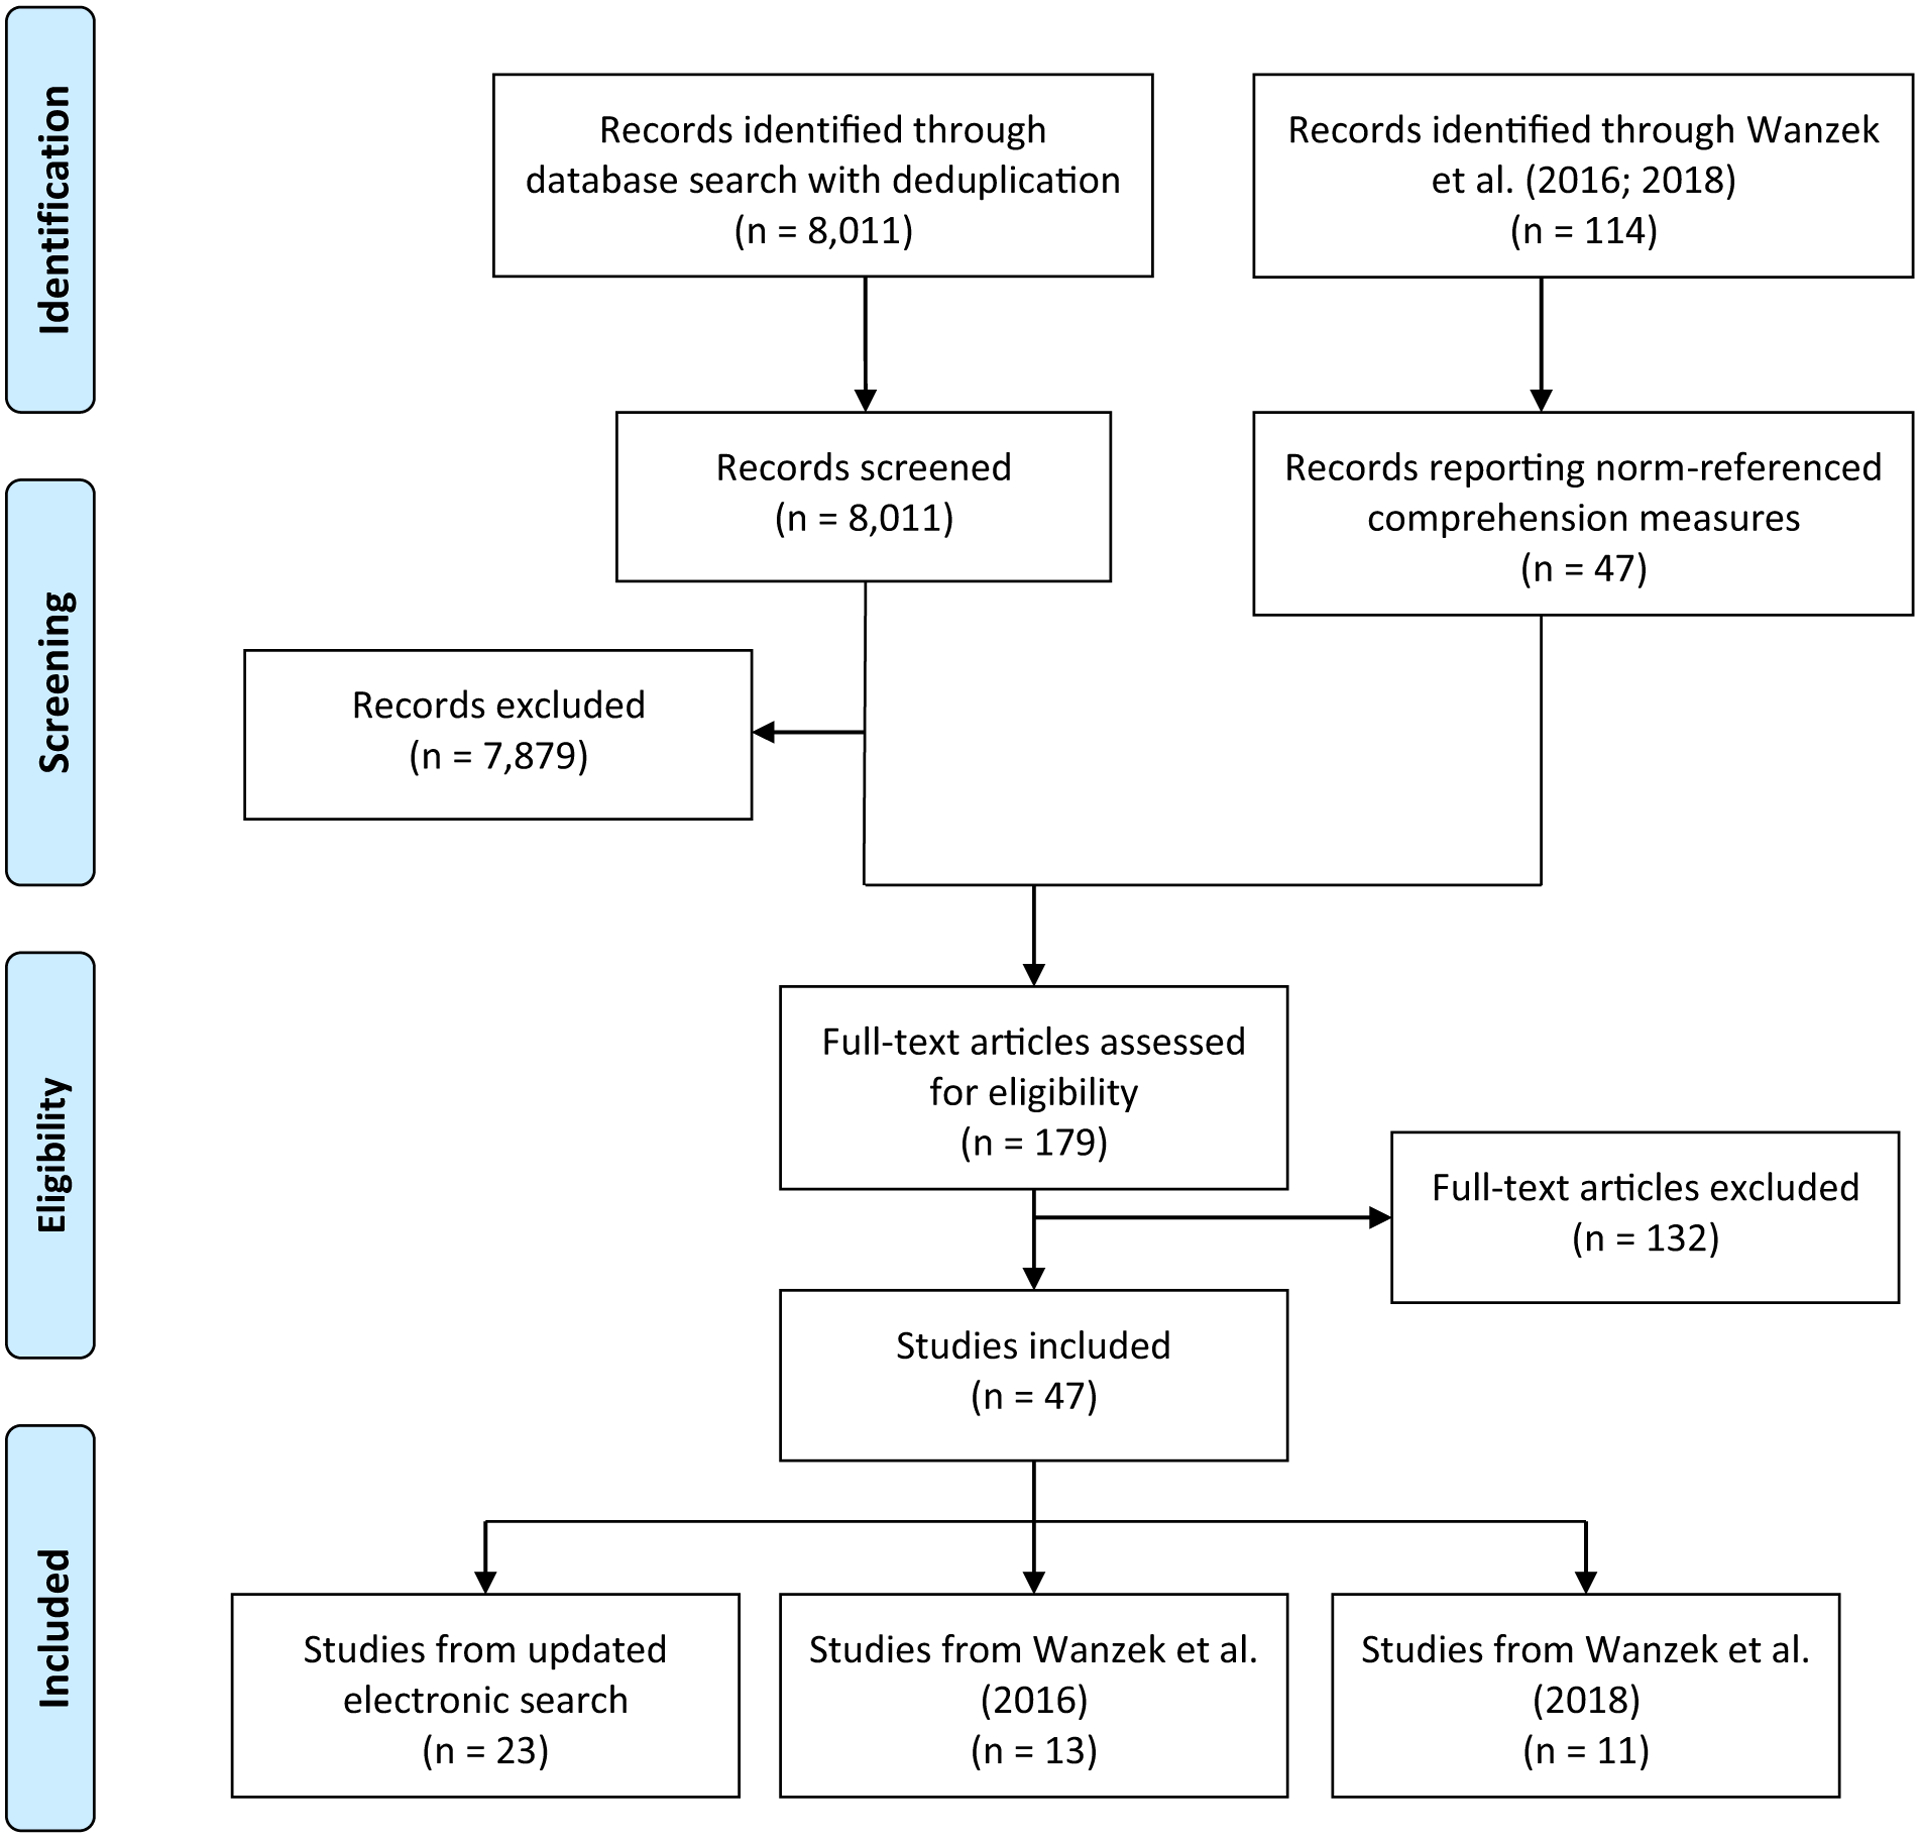
Search Flow Diagram PRISMA 2009 Flow Diagram from: Moher D, Liberati A, Tetzlaff J, Altman DG, The PRISMA Group (2009). Preferred Reporting Items for Systematic Reviews and Meta-Analyses: The PRISMA Statement. PLoS Med 6(7): e1000097. https://doi.org/10.1371/journal.pmed1000097.
2.1. Identification of recent studies
Studies published since the end dates of the prior (Wanzek et al., 2016, 2018) meta-analyses were identified through a comprehensive electronic search of ERIC and PsycINFO. We replicated the Wanzek et al. (2016) electronic search using their search terms (reading difficult*, at-risk, dsylex*) for key population identifiers, cross-referenced with (reading, interven*, phon*, fluency, vocab*, comprehen*) for reading context. We then replicated the electronic search from Wanzek et al. (2018), which used an updated set of terms, and eliminated duplicates between the two resulting sets of abstracts. This second tier of the electronic search identified studies published through August of 2019 using the terms (reading interven*, reading instruction, reading strategies, supplemental instruction, special educ*, phon*, fluency, vocab*, comp*) cross-referenced with (reading difficult*, learning disab*, reading disab*, reading delays, reading disorder*, dyslex*). The combined search identified 8011 abstracts for screening after removing duplicates.
Abstracts and papers were screened by the first, second, and fourth authors. These three readers used the Abstrackr online platform (Wallace et al., 2012) to screen abstracts for inclusion criteria. All three readers first screened a single set of 400 abstracts for reliability purposes, establishing 98% agreement. The remaining abstracts were assigned to one of the three readers for screening. During abstract screening, 7878 records were disqualified based on the inclusion criteria. One other record was found to be duplicated between our electronic search and Wanzek et al. (2018), and the duplicate was eliminated.
Each of the 179 remaining records was assigned to two readers for full-text review of inclusion criteria. Any disagreements were discussed to reach a consensus. After full-text review, 47 studies were included in the meta-analyses.
2.2. Inclusion criteria
In all cases, our inclusion criteria were the same as or narrower than those used by Wanzek et al. (2016) and Wanzek et al. (2018). Following are the criteria applied in the current meta-analysis.
Published in a peer-reviewed journal in English.
At least 50% of participants (in total or in disaggregated data) were identified with a learning disability, reading difficulty, or being at-risk of RDs (i.e., students with low achievement, low phonemic awareness, economic disadvantage, language disorders). We excluded studies in which more than 50% of participants had autism, intellectual disabilities, severe hearing impairment/deafness, or severe vision impairment/blindness.
At least 50% of participants (in total or in disaggregated data) were enrolled in US (or a foreign country’s equivalent of) Grades K-3 (ages 5–9).
Interventions provided instruction and/or practice in foundational reading skills, with or without instruction targeting text comprehension.
Interventions were provided in English and as part of school programming (i.e., not home, clinic, or camp programs). Interventions provided in summer school as part of regular school programming were included.
Interventions were not part of the general education curriculum provided to all students as a part of classroom reading instruction (i. e., Tier 1 interventions).
The research design was experimental or quasi-experimental with a comparison or control group, and sufficient data were provided to calculate effect sizes.
At least one of the dependent variables addressed an outcome in reading comprehension using a standardized, norm-referenced measure (i.e., excluding researcher-developed measures and criterion-referenced tests such as many state-mandated assessments). We excluded studies that only provided data for composite reading outcomes and did not report reading comprehension outcomes separately.
The comparison group received typical school-provided reading instruction (i.e., business-as-usual; BAU) or instruction in a non-literacy subject. We included comparisons with reading activities that did not include structured reading instruction (e.g., read-aloud time). We also included other comparison conditions that were researcher-developed but did not teach reading (e.g., math, study skills). We excluded studies that contrasted two or more researcher-controlled reading interventions (e.g., studies manipulating characteristics of the same reading intervention) but did not contrast them with a BAU comparison or a non-literacy instructional condition.
2.3. Coding procedures
Details of each study were coded on a spreadsheet adapted from Wanzek et al. (2016). Coded data described study participants, research design, study characteristics, intervention conditions, comparison conditions, measures, and results. We added to the Wanzek et al. (2016) coding sheet to include more specific information about the nature of the experimental interventions. To establish coding reliability, the three readers independently coded the same two studies identified in the updated electronic search. Reliability with the first author was evaluated; the mean agreement was 98.97%.
The original coding sheets were available for the studies from the Wanzek et al. (2016) meta-analysis. Codes from Wanzek et al. (2016) were verified by the fourth author, who referred to the full texts of the articles. Differences in coding between this coder and Wanzek et al. (2016) were resolved by the first author. The full texts were also further coded for additional details regarding the intervention content (e.g., systematic instruction). All new codes were reviewed and verified by the first author, with disagreements resolved through discussion. All studies identified from Wanzek et al. (2018) and through the updated electronic search of studies from 2014 through 2019 were independently coded by the first and second authors, who resolved discrepancies through discussion.
Studies were coded as providing foundational skills instruction if they included instruction or practice activities targeting phonological awareness, alphabetic knowledge, graphophonemic knowledge, recognition of orthographic patterns, decoding, spelling, and/or word recognition. Some approaches to instruction were systematic, in that they followed a pre-determined sequence of instructional objectives. Some approaches adhered to explicit instructional models, in which the teacher models and directly teaches skills and strategies and provides purposeful practice with feedback. Other approaches to foundational skills instruction did not follow a pre-determined sequence; lessons were planned by the teacher in response to assessment results or observations of the child’s reading behaviors. Some intervention approaches were inductive, rather than explicit: students were guided to infer content, such as letter-sound relationships. In some interventions, students were taught to utilize a variety of word-identification strategies, including strategies that encouraged students to attend to meaning cues (i.e., to make inferences about word identity based on the context of the text and/or illustrations).
In this meta-analysis, interventions were categorized as multicomponent if they included text comprehension instruction in addition to foundational skills instruction. Some interventions included sequenced instruction in specific comprehension strategies and/or skills (e.g., finding the main idea of a paragraph, generating inferences, summarizing text). Other interventions did not address comprehension skills and strategies in a predetermined order. These included text-based questioning, discussion of text during and after reading, and pre-reading lessons in which students made predictions based on illustrations and prior knowledge, and similar approaches.
Besides coding foundational reading skills and comprehension instruction, we also coded for the presence of text reading, vocabulary instruction, and non-literacy instruction in the interventions. Text reading instruction included reading fluency practice, as well as other activities in which students read connected text. We coded for vocabulary instruction whenever instruction was described as addressing word meanings, even when word meanings appeared to have been discussed only briefly or incidentally. In some studies, interventionists briefly defined words in service of word reading instruction or practice. Thus, the presence of vocabulary instruction in an intervention did not necessarily indicate that text comprehension was a meaningful focus. Non-literacy instruction included components addressing self-regulation and study skills.
For the purpose of conducting moderator analyses, study dosage was treated as a continuous variable. When a study specified the mean hours of intervention actually received by students in the experimental condition, that number was adopted as the dosage of the study. When the actual mean hours received was not provided in a study, dosage was calculated by multiplying the number of intervention sessions provided and the length of those sessions. When the number of sessions was not provided, we followed procedures used by Wanzek et al. (2016), estimating the dosage from the information provided in the study.
Based on WWC standards (WWC, 2020) and study quality recommendations articulated by Slavin and colleagues (Slavin & Madden, 2011; Slavin & Smith, 2009), study quality was assessed according to adherence to four explicit criteria. Each study received a rating of 1, 2, 3, or 4 points, with studies receiving a point for (a) having a norm-referenced measure (all studies met this criterion), (b) having a randomized research design, (c) having a sample size of 250 or greater, and (c) measuring and reporting fidelity of implementation.
Other intervention and study characteristics coded for this meta-analysis were (a) participant grade levels, (b) estimate of socioeconomic status (i.e., whether at least 50% of participants were identified as economically disadvantaged or participants attended schools where 50% or more of the population was economically disadvantaged), c) intervention implementer, and (d) the instructional group size. These were not analyzed as moderator variables; however, the results of our coding were summarized descriptively. It was our intent to analyze grade level as a potential moderator of student outcomes since prior meta-analyses have found that reading intervention outcomes vary by grade level (Suggate, 2010; Wanzek & Vaughn, 2007); however, we were unable to form mutually exclusive categories since many studies provided intervention across multiple grade levels.
2.4. Effect size calculation and meta-analytic procedures
To quantify the effects of early reading intervention on comprehension outcomes, we used standardized mean differences between intervention and control groups estimated with Hedges’ g. We calculated g from reported mean and standard deviation (SD) estimates by group if available; otherwise, we used the reported statistical tests (e.g., F statistics, standard error). In one study (Fien et al., 2015), we used the study-reported Hedges’ g since no other information was available.
2.4.1. Outlier analysis
Prior to synthesizing effect sizes across studies, we examined the distribution of raw effect size estimates to identify outliers. We defined an outlier as a value below the first quartile minus 3 times the interquartile range (−1.06) or above the third quartile plus 3 times the interquartile range (1.74; Tukey, 1977). We identified two outlying effect sizes, one at the low end of the distribution (Chapman et al., 2001; g = −1.42) and another at the high end (Mathes et al., 2005; g = 1.99). These effect sizes were winsorized to the corresponding fence values. To evaluate the impact of outliers, we conducted sensitivity analyses by running the models using raw data (including outliers) and results were nearly identical between the two. Therefore, we present the findings from the analyses of raw data.
2.4.2. Estimation of mean effects
There are several sources of dependencies in our effect size estimates. Many included studies reported intervention effects on multiple measures of comprehension outcomes and/or at multiple timepoints. Additionally, several studies included multiple comparisons as a result of having more than one intervention or control condition. Effect size estimates from a single study are likely to be correlated because they are from the same or a shared sample. Therefore, we used three-level, multivariate random effects analyses, assuming a correlation of 0.70. In addition, we used the robust variance estimation (RVE) method to apply small-sample corrections to standard errors, hypothesis tests, and confidence intervals (Hedges et al., 2010; Tipton, 2015; Tipton & Pustejovsky, 2015). In these analyses, we used study as a clustering unit. This analytic approach estimates the average effect size using all information available and then adjusts the standard errors to account for the inherent clustering of these related effect sizes. The model decomposes the variance of the effect size into three parts. The Level 1 variance is the sampling variance estimated via the traditional variance calculation. The Level 2 variance is the within-study variance. The Level 3 variance is the variance between the studies.
To measure the heterogeneity between studies and within a study, we report the restricted maximum likelihood estimate of the between-study variance (τ2) and within-study variance (ω2). We also report the Q statistics and I2 statistic partitioned to each level, which is a relative measure of the extent to which heterogeneity among true effect sizes contributes to the observed variation in the effect size estimates. We adopt the guideline articulated by Higgins et al. (2003), which holds that I2 of 50% to 75% indicates a moderate amount of heterogeneity, enough to conduct moderator analyses. We also provide a 68% prediction interval, a possible range within which about two-thirds of the effects should fall.
2.4.3. Moderator analyses
First, we examined each moderator separately using meta-regression. The effects of moderators were tested using small-sample adjusted t-test for the moderators with 2 categories. For the moderators with more than 2 categories, we used the Wald test function from the clubSandwich package (Pustejovsky, 2016) that applies small-sample adjusted F tests for the moderators with more than 2 categories. Second, we conducted a multiple meta-regression to model the effects of the moderators simultaneously. This approach allowed us to look at the impact of each moderator while controlling for other potential moderators; it provided us with information as to how moderator effects should be interpreted in the context of other moderators.
We also examined the possibility of publication bias with a modified version of Egger’s regression to account for dependent effect size estimates (Egger et al., 1997; Rodgers & Pustejovsky, 2020). The Egger’s regression test examines the asymmetry in the effect sizes as a function of precision (i.e., by examining standard errors) with an assumption that small sample studies with large effect sizes are more likely to be published than small-sample studies with small effect sizes. Such asymmetry based on precision may indicate publication bias. Following the main effects model, we used a multilevel modeling approach and RVE correction for Egger’s regression, and the standard error of each effect size estimate was used as a predictor. In addition, we performed p-curve analyses (Simonsohn et al., 2014) to detect whether there was extensive data mining (referred to as p hacking) in search of statistically significant results. This is detected by the shape of a p curve, which is the distribution of statistically significant p values across a set of studies. The right-skewed p curve, where a majority of p values reported are much smaller than 0.05, is expected when there is a true underlying effect. If the p curve is flat, due to a similar number of p values across the range of p values between 0 and 0.05, no true effect exists. If the p curve is left-skewed, this is an evidence of p hacking. We used the results of p-curve analysis as a supplement to Egger’s test because p-curve analysis do not account for dependencies in the data.
All analyses were conducted with the metafor package (Viechtbauer, 2010) and the clubSandwich package (Pustejovsky, 2016) for the R statistical computing environment (R Core Team, 2019). We used p-curve function from the dmetar package (Harrer et al., 2019) for the p-curve analysis.
3. Results
3.1. Study features
Table 1 provides the features of the 47 studies that met criteria for inclusion. The total sample size for all studies in the meta-analysis was 7446 students; sample sizes for individual studies ranged from 24 to 881. Eight studies included students in kindergarten, 34 included students in first grade, 16 included second grade, and 9 included Grade 3. Fourteen of these studies included participants in two or more grades. According to our best estimate based on the information provided by the researchers, in 29 of the studies, 50% or more of the participants were economically disadvantaged or attended schools in which 50% or more of the students were economically disadvantaged; in 8 studies, no information about socioeconomic status was provided. There was only one study in which more than 50% of students were served by special education (Mathes & Babyak, 2001); in all other studies, 50% or more of the students were at risk for or experiencing reading difficulties but receiving reading intervention outside of special education, or the special education status of participants was not provided.
Table 1.
Participant and study characteristics.
| Study | Participants | Study characteristics | Mean effects | ||||
|---|---|---|---|---|---|---|---|
| N | Grade | Low SES | Design | Fidelity reported | Measures | ||
| Al Otaiba et al. (2005) | 73 | K | Yes | QE | Yes | WRMT-R PC | 0.54 |
| Apel and Diehm (2013) | 54 | 1–2 | Yes | EXP | Yes | TOSREC | 0.20 |
| Baker et al. (2016) | 78 | 1 | Yes | EXP | Yes | SAT-10 RC | 0.28 |
| Baker et al. (2000) | 84 | 1–2 | Yes | EXP | No | WRMT-R/NU PC | 0.02 |
| Berninger et al. (2006) Study 2 | 93 | 2 | No | EXP | No | GMRT RC | 0.51 |
| Brown et al. (2005) | 81 | 2–3 (2–5)a | No | QE | No | WRMT-R PC | 1.14 |
| Burns et al. (2004) | 236 | 1–3 (K-4)a,b | Yes | QE | No | GORT-4 RC | 0.49 |
| Center et al. (1995) | 55 | 1 | NR | QE | Yes | WRMT-R PC | 0.97 |
| Chapman et al. (2001) | 42 | 1 | NR | QE | No | NARA RC | −0.92 |
| Denton et al. (2010) | 422 | 1 | Yes | EXP | Yes | WJ-III PC | 0.53 |
| Denton et al. (2014) | 206 | 1–2 | Yes | EXP | Yes | GMRT RC, TOSREC, WJ-III PC | 0.16 |
| Duff et al. (2014) | 145 | 1 | NR | QE | Yes | YARC | 0.11 |
| Ehri et al. (2007) | 182 | 1 | Yes | QE | Yes | GMRT RC | 0.53 |
| Fien et al. (2015) | 239 | 1 | No | EXP | Yes | WRMT-R/NU PC | 0.28 |
| Gunn et al. (2000, 2002) | 193 | K-3 | NR | EXP | No | WJ-R PC | 0.27 |
| Hurry and Sylva (2007) | 373 | 1 | No | QE | No | NFER | −0.15 |
| Jenkins et al. (2004) | 99 | 1 | Yes | EXP | Yes | WRMT-R PC | 0.81 |
| Lee et al. (2011) | 881 | 1–3 | Yes | EXP | No | WJ-III PC | 0.09 |
| Lovett et al. (2017) | 97 | 1–3 | Yes | QE | No | GORT-4 RC, SRI-2, WRMT-R PC | 0.94 |
| Mathes and Babyak (2001) | 76 | 1 | No | EXP | Yes | WRMT-R PC | 0.38 |
| Mathes et al. (2003) | 89 | 1 | No | QE | Yes | WRMT-R PC | 0.57 |
| Mathes et al. (2005) | 245 | 1 | No | EXP | Yes | WJ-III PC | 1.10 |
| Miller (2003) | 112 | 1 | Yes | QE | No | MAT RC | 0.60 |
| Morris et al. (2000) | 86 | 1 | Yes | QE | No | GORT-3 RC, WRMT-R PC | 0.38 |
| Morris et al. (2012) | 279 | 2–3 | No | EXP | Yes | WRMT-R PC | 0.74 |
| O’Connor et al. (2014) | 172 | K | Yes | QE | Yes | WRMT-R/NU PC | 0.31 |
| O’Shaughnessy and Swanson (2000) | 45 | 2 | Yes | EXP | Yes | WRMT-R PC | 0.71 |
| Rashotte et al. (2001) | 47 | 1–2 (1–6)c | Yes | EXP | No | GORT-3 RC, WDRB PC | 0.97 |
| Ryder et al. (2008) | 24 | 1–2 | NR | EXP | No | NARA RC | 1.06 |
| Santa and Høien (1999) | 41 | 1 | NR | QE | No | WRMT-R PC | 0.99 |
| Schwartz (2005) | 74 | 1 | Yes | EXP | No | DRP | 0.14 |
| Simmons et al. (2011) | 206 | K | Yes | EXP | Yes | WRMT-R/NU PC | −0.12 |
| Smith et al. (2016) | 749 | 1 | No | EXP | Yes | SAT-10 SR | 0.01 |
| Solari et al. (2018) | 90 | 1 | Yes | EXP | Yes | WJ-III PC | 0.44 |
| Torgesen et al. (1999) | 138 | K-2 | NR | EXP | No | GORT-3 RC, WRMT-R PC | 0.30 |
| Torgesen et al. (2010) | 108 | 1 | No | EXP | No | GORT-3 RC, WRMT-R PC | 0.33 |
| Toste et al. (2017) | 58 | 3 (3–4) | Yes | EXP | Yes | WRAT-IV SC | 0.31 |
| Vadasy and Sanders (2008a) | 86 | K | Yes | QE | Yes | WRMT-R/NU PC | 0.43 |
| Vadasy and Sanders (2008b) | 162 | 2–3 | Yes | EXP | Yes | GORT-4 RC | −0.01 |
| Vadasy and Sanders (2009) | 202 | 2–3 | Yes | EXP | Yes | GORT-4 RC, WRMT-R/NU PC | 0.20 |
| Vadasy and Sanders (2010) | 148 | K | Yes | EXP | Yes | WRMT-R/NU PC | 0.62 |
| Vadasy and Sanders (2011, 2013) | 187 | 1 | Yes | EXP | Yes | WRMT-R/NU PC | 0.14 |
| Vadasy et al. (2005) | 57 | 1 | NR | QE | Yes | WRMT-R/NU PC | 0.72 |
| Vadasy et al. (2006) | 67 | K | Yes | EXP | Yes | WRMT-R/NU PC | 0.24 |
| Vaughn et al. (2006) | 40 | 1 | Yes | QE | Yes | WLPB-R PC | 1.09 |
| Wang and Algozzine (2008) | 139 | 1 | Yes | QE | Yes | WRMT-R PC | 0.35 |
| Wanzek and Vaughn (2008) | 86 | 1 | Yes | EXP | Yes | WRMT-R PC | −0.36 |
Note. Low SES = >50% of participants were economically disadvantaged or participants attended schools with populations that were >50% economically disadvantaged; K = Kindergarten; NR = Not Reported; EXP = Experimental (i.e., randomized design); QE = Quasi-Experimental (i.e., non-randomized or randomization seriously compromised); DRP = Degrees of Reading Power; GMRT = Gates MacGinitie Reading Test; GORT = Gray Oral Reading Test; MAT = Metropolitan Achievement Test; NARA = Neale Analysis of Reading Ability; NFER = National Foundation for Educational Research Reading Tests; SAT = Stanford Achievement Test; SRI = Standardized Reading Inventory; TOSREC = Test of Sentence Reading Efficiency and Comprehension; WDRB = Woodcock Diagnostic Reading Battery; WIAT = Wechsler Individual Achievement Test; WJ = Woodcock-Johnson Tests of Achievement; WJ-R = Woodcock-Johnson Tests of Achievement-Revised; WLPB = Woodcock Language Proficiency Battery; WRAT = Wide Range Achievement Test; WRMT-R/NU = Woodcock Reading Mastery Test-Revised/Normative Update; WRMT-R = Woodcock Reading Mastery Test-Revised; YARC = York Assessment of Reading for Comprehension; PC = Passage Comprehension Subtest; RC = Reading Comprehension Subtest; SC = Sentence Comprehension Subtest.
>50% of participants were in Grades K-3.
Comprehension measure was not given in K.
Disagregated data for Grades 1–2 were utilized.
The 47 studies provided effect sizes associated with 68 intervention treatment conditions. By design, all intervention conditions included foundational skills instruction. Thirty-nine also included instruction in comprehension. Sixty-one included text reading instruction or practice, which may have included practice designed to increase oral reading fluency. Twenty included vocabulary instruction of some kind. The six studies that included a vocabulary instruction component without also including a comprehension component only taught word meanings incidentally, in the service of word study or text reading instruction. Five interventions included non-literacy instructional components.
All of the qualifying studies had designs that compared treatment groups to comparison or control groups; 29 had experimental designs with randomized assignment to research conditions, while 18 were quasi-experimental. In 30 of the studies, researchers described the collection of data on fidelity of implementation and reported the results in the paper. To measure comprehension, 18 studies used measures that required the student to read multiple sentences or paragraphs and answer questions about them (e.g., GORT-3 RC; GMRT RC); 4 studies used sentence comprehension measures (e.g., TOSREC, WRAT-4 SC); and 33 studies utilized measures that had a cloze format in which students supplied words omitted from phrases, sentences, or brief passages (e.g. WRMT-R PC; WJ III PC).
Table 2 describes intervention features and effect sizes calculated for each contrast. Across studies, intervention was provided for an average of 57.19 h (SD = 35.19; range = 7 to 149). In two studies, insufficient information was provided to calculate intervention dosage (Ehri et al., 2007; Miller, 2003). It should be noted that the effect sizes reported in Table 2 often differ from those reported by the studies’ authors. Researchers frequently report effect sizes based on covariate-adjusted posttest scores. We calculated effect sizes based on covariate-adjusted scores when they were provided; however, most studies only reported unadjusted posttest scores.
Table 2.
Intervention characteristics.
| Study | Treatment group | Instructional elements | Instructional emphasis | Implementer | Group size | Mean hoursa | Effects at post-test | Effects at follow-up |
|---|---|---|---|---|---|---|---|---|
| Al Otaiba et al. (2005) | TX 1 | FS, TR, C, V | FS + C | RES | 1 | 56.00 | 0.72b | |
| TX 2 | FS, TR, C, V | FS + C | RES | 1 | 28.00 | 0.37b | ||
| Apel and Diehm (2013) | FS, V | FS | RES | 4–5 | 13.33 | 0.14d | ||
| 0.26d | ||||||||
| Baker et al. (2000) | FS, TR, C | FS + C | SCH | 1 | 37.00 | 0.28b | ||
| Baker et al. (2016) | FS, TR, C, V | FS + C | SCH | NR | 30.00 | 0.02c | ||
| Berninger et al. (2006) Study 2 | FS, TR | FS | RES | NR | 42.00 | 0.51c | ||
| Brown et al. (2005) | FS, TR, C | FS + C | SCH | 1 | 39.75 | 1.14b | ||
| Burns et al. (2004) | FS, TR, C, V, N | FS + C | SCH | 1 | 40.00 | 0.49c | ||
| Center et al. (1995) | FS, TR, C | FS + C | SCH | 1 | 37.50 | 0.97b | ||
| Chapman et al. (2001) | TX 1 | FS, TR, C | FS + C | SCH | 1 | 46.67 | −0.41c | |
| TX 2 | FS, TR, C | FS + C | SCH | 1 | 46.67 | −1.14c | ||
| Denton et al. (2010) | FS, TR, C | FS + C | SCH | 3–4 | 62.16 | 0.53b | ||
| Denton et al. (2014) | TX 1 | FS, TR, C | FS + C | RES | 2–4 | 59.00 | 0.03c | |
| 0.05d | ||||||||
| 0.10b | ||||||||
| TX 2 | FS, TR, C, V | FS + C | RES | 2–4 | 59.00 | 0.08c | ||
| 0.24d | ||||||||
| 0.42b | ||||||||
| Duff et al. (2014) | FS, TR, C, V | FS + C | SCH | 1–4 | 14.47 | 0.11c | ||
| Ehri et al. (2007) | FS, TR, C, V | FS + C | SCH | 1 | NR | 0.48c | ||
| 0.58c | ||||||||
| Fien et al. (2015) | FS, TR | FS | SCH | 3–5 | 65.00 | 0.28b | ||
| Gunn et al. (2000, 2002) | FS, TR, C, N | FS + C | RES | 1–3 | 130.50 | 0.28b | 0.26b | |
| Hurry and Sylva (2007) | TX 1 | FS | FS | RES | 1 | 6.70 | −0.21c | |
| −0.14c | ||||||||
| TX 2 | FS, TR, C | FS + C | SCH | 1 | 38.50 | −0.15c | ||
| −0.09c | ||||||||
| Jenkins et al. (2004) | TX 1 | FS, TR | FS | SCH | 1 | 50.00 | 0.86b | |
| TX 2 | FS, TR | FS | SCH | 1 | 50.00 | 0.76b | ||
| Lee et al. (2011) | FS, TR, C, V | FS + C | SCH | 1 | 27.00 | 0.09b | ||
| Lovett et al. (2017) | FS, TR, C, V | FS + C | RES | 4 | 118.44 | 0.40c | ||
| 1.02c | ||||||||
| 0.68c | ||||||||
| 0.69c | ||||||||
| 1.10c | ||||||||
| 0.51c | ||||||||
| 1.15b | ||||||||
| 1.51b | ||||||||
| 1.41b | ||||||||
| Mathes and Babyak (2001) | TX 1 | FS, TR, C | FS + C | SCH | 3 | 25.00 | 0.27b | |
| TX 2 | FS, TR, C | FS + C | SCH | 3 | 37.00 | 0.49b | ||
| Mathes et al. (2003) | TX 1 | FS, TR, C | FS + C | SCH | 2 | 28.00 | 0.42b | |
| TX 2 | FS, TR, C | FS + C | SCH | 4–5 | 24.00 | 0.71b | ||
| Mathes et al. (2005) | TX 1 | FS, TR, C | FS + C | RES | 3 | 106.67 | 0.20b | |
| TX 2 | FS, TR, C, V | FS + C | RES | 3 | 106.67 | 1.73b | ||
| Miller (2003) | TX 1 | FS, TR, C | FS + C | SCH | 1 | 149.33 | 0.76c | |
| TX 2 | FS, TR, C | FS + C | SCH | 1 | NR | 0.44c | ||
| Morris et al. (2000) | FS, TR, V | FS | SCH | 1 | 45.50 | 0.74b | ||
| Morris et al. (2012) | TX 1 | FS | FS | RES | 4 | 70.00 | 0.51b | |
| 0.26c | ||||||||
| TX 2 | FS, TR, C, V | FS + C | RES | 4 | 70.00 | 0.46b | ||
| 0.55c | ||||||||
| TX 3 | FS, N | FS | RES | 4 | 70.00 | 0.25b | ||
| 0.25c | ||||||||
| O’Connor et al. (2014) | FS | FS | RES | 2–3 | 10.85 | 0.31b | ||
| O’Shaughnessy and Swanson (2000) | TX 1 | FS | FS | SCH | 5 | 9.00 | 0.67b | |
| TX 2 | FS, TR | FS | SCH | 5 | 9.00 | 0.76b | ||
| Rashotte et al. (2001) | FS, TR, C | FS + C | SCH | 3–5 | 116.70 | 1.34c | ||
| 0.61b | ||||||||
| Ryder et al. (2008) | FS, TR, C | FS + C | SCH | 3 | 32.00 | 1.06c | ||
| Santa and Høien (1999) | FS, TR, V | FS | SCH | 1 | 90.00 | 0.99b | ||
| Schwartz (2005) | FS, TR, C | FS + C | SCH | 1 | 40.00 | 0.14c | ||
| Simmons et al. (2011) | FS, TR | FS | SCH | 3–5 | 80.00 | −0.12b | ||
| Smith et al. (2016) | FS, TR | FS | SCH | 3–5 | 90.00 | 0.01d | ||
| Solari et al. (2018) | FS, TR, C, V | FS + C | SCH | 4–5 | 21.00 | 0.44b | ||
| Torgesen et al. (1999) | TX 1 | FS, TR, C | FS + C | RES | 1 | 90.00 | 0.30c | |
| 0.44c | ||||||||
| 0.41b | ||||||||
| 0.44b | ||||||||
| TX 2 | FS, TR, C | FS + C | RES | 1 | 87.00 | 0.30c | ||
| 0.44c | ||||||||
| 0.02b | ||||||||
| 0.06b | ||||||||
| Torgesen et al. (2010) | TX 1 | FS, TR, N | FS | RES | 3 | 80.40 | 0.38b | 0.28b |
| 0.06c | ||||||||
| TX 2 | FS, TR | FS | RES | 3 | 84.30 | 0.54b | 0.47b | |
| 0.25c | ||||||||
| Toste et al. (2017) | TX 1 | FS, TR, V | FS | RES | 2–3 | 16.00 | 0.19d | |
| TX 2 | FS, TR, V, N | FS | RES | 2–3 | 16.00 | 0.44d | ||
| Vadasy and Sanders (2008a) | TX 1 | FS, TR | FS | SCH | 1 | 29.21 | 0.39b | |
| TX 2 | FS, TR | FS | SCH | 2 | 28.64 | 0.47b | ||
| Vadasy and Sanders (2008b) | FS, TR, C | FS + C | SCH | 2 | 25.00 | −0.01c | ||
| Vadasy and Sanders (2009) | TX 1 | FS, TR, C | FS + C | SCH | 2 | 25.50 | 0.22c | |
| 0.10c | ||||||||
| 0.29b | ||||||||
| TX 2 | FS, TR, C | FS + C | SCH | 2 | 25.50 | 0.26c | ||
| 0.18c | ||||||||
| 0.18b | ||||||||
| Vadasy and Sanders (2010) | TX 1 | FS, TR, V | FS | SCH | 1 | 27.68 | 0.47b | |
| TX 2 | FS, TR | FS | SCH | 1 | 27.68 | 0.77b | ||
| Vadasy and Sanders (2011, 2013) | TX 1 | FS, TR, V | FS | SCH | 1 | 33.15 | 0.10b | 0.33b |
| 0.16b | ||||||||
| −0.03b | ||||||||
| 0.16b | ||||||||
| TX 2 | FS, TR | FS | SCH | 1 | 33.15 | 0.29b | 0.13b | |
| 0.21b | ||||||||
| −0.06b | ||||||||
| 0.06b | ||||||||
| Vadasy et al. (2005) | TX 1 | FS, TR | FS | SCH | 1 | 44.20 | 0.81b | |
| TX 2 | FS | FS | SCH | 1 | 44.00 | 0.63b | ||
| Vadasy et al. (2006) | FS, TR | FS | SCH | 1 | 27.40 | 0.28b | 0.20b | |
| Vaughn et al. (2006) | FS, TR, C, V | FS + C | RES | 3–5 | 96.55 | 1.09b | ||
| Wang and Algozzine (2008) | FS, TR | FS | RES | NR | 34.67 | 0.35b | ||
| Wanzek and Vaughn (2008) | TX 1 | FS, TR, C | FS + C | RES | 4–5 | 25.00 | −0.07b | |
| TX 2 | FS, TR, C | FS + C | RES | 4–5 | 50.00 | −0.64b |
Note. TX = Experimental treatment group; FS = Code-based foundational reading skills instruction; TR = Text reading instruction and practice, including fluency practice; C = Comprehension instruction; V = Vocabulary instruction; N = Non-literacy instruction (i.e., self-regulation, study skills); SCH = Implementors were school personnel or community volunteers; RES = Implementors were part of the research team; Com = Computer-administered intervention; NR = Not reported.
Mean hours intervention was received, either reported in the study or estimated from description in the study.
Cloze format measure.
Measure requires passage reading and responding to questions.
Sentence comprehension measure.
3.2. Meta-analytic findings
3.2.1. Main effects
The meta-analysis included 47 studies encompassing 112 comparisons (1–12 per study) and a combined sample of 7446 students. The weighted average effect on comprehension outcomes was estimated as g = 0.37 (95% CI [0.27, 0.47], p < .01). As expected, there was substantial heterogeneity across effect sizes (Q = 416.57, df = 111, p < .01) with between-study variance of τ2 = 0.03 and within-study variance of ω2 =0.04 with a total I2 of = 66.64% (Level 2 = 37.73% and Level 3 = 28.91). The 68% prediction interval was 0.09 to 0.65.
3.3. Moderator analyses
We report estimates of average effect size disaggregated by the levels of each moderator in Table 3. We note that there were few contrasts in certain categories within moderators, which influences the degrees of freedom; analyses of these moderators are statistically underpowered, and a failure to demonstrate statistically significant differences in these cases may be the result of Type 2 error.
Table 3.
Single meta-regression moderator analysis results.
| Moderator | k | m | Effect size (beta) | SE | Df | P | 95% CI | Tau 2 | Omega 2 | % variance explaineda | F | df | p |
|---|---|---|---|---|---|---|---|---|---|---|---|---|---|
| Instructional emphasis | 0.035 | 0.045 | 0 | 0.94 | 14.60 | .35 | |||||||
| Multi-component | 29 | 66 | 0.40 | 0.06 | 25.00 | .00 | [0.27, 0.52] | ||||||
| Foundational skills | 20 | 46 | 0.33 | 0.06 | 15.81 | .00 | [0.21, 0.45] | ||||||
| Dosage | 46 | 109 | 0.029 | 0.047 | 7.96 | 4.20 | 13.80 | .06 | |||||
| Intercept | 0.38 | 0.05 | 35.59 | .00 | [0.28, 0.48] | ||||||||
| Dosage | 0.003 | 0.001 | 13.78 | .06 | [0.00, 0.01] | ||||||||
| Measurement time | 0.032 | 0.045 | 1.95 | −1.38 | 7.23 | .21 | |||||||
| Immediate posttest | 39 | 85 | 0.39 | 0.05 | 36.19 | .00 | [0.30, 0.49] | ||||||
| Follow-up | 12 | 27 | 0.29 | 0.08 | 8.33 | .01 | [0.10, 0.47] | ||||||
| Measurement type | 0.025 | 0.044 | 12.91 | 2.91 | 4.50 | .16 | |||||||
| Passage | 18 | 39 | 0.27 | 0.06 | 16.86 | .00 | [0.13, 0.41] | ||||||
| Cloze | 33 | 66 | 0.43 | 0.06 | 32.36 | .00 | [0.32, 0.56] | ||||||
| Sentence | 4 | 7 | 0.22 | 0.08 | 2.43 | .10 | [−0.08, 0.5] | ||||||
| Study quality | 0.030 | 0.044 | 6.21 | 1.12 | 3.68 | .45 | |||||||
| 1 | 7 | 17 | 0.63 | 0.14 | 5.56 | .01 | [0.27, 0.99] | ||||||
| 2 | 19 | 41 | 0.39 | 0.07 | 16.14 | .00 | [0.25, 0.55] | ||||||
| 3 | 19 | 47 | 0.29 | 0.07 | 16.49 | .00 | [0.14, 0.45] | ||||||
| 4 | 2 | 7 | 0.22 | 0.19 | 1 | .45 | [−2.14, 2.58] |
Note. Dosage variable was mean-centered, intercept represents effect size for studies with mean dosage, beta value represents the amount of increase in effect size per 1 additional hour of treatment; Passage = measures in which students read paragraphs or passages and respond to questions; Cloze = measures in which students supply missing words in phrases, sentences, or brief passages; Sentence = measures in which students demonstrate sentence comprehension; Study quality ratings range from 1 to 4, with 4 being the highest quality studies.
Variance in effect sizes explained by the variable.
3.3.1. Impact of instructional emphasis
To determine the effects of instructional emphasis, we examined moderation with two categories: foundational reading skills instruction only and multicomponent instruction (i.e., both foundational reading skills and comprehension). The mean effect of multicomponent interventions on reading comprehension did not differ from that of foundational reading skills-only interventions (F = 0.94, df = 14.60, p = .35) and instructional emphasis did not explain any of the variance in effect sizes.
3.3.2. Impact of dosage
Dosage was defined as the number of instructional hours and modeled as a continuous variable. The effect of intervention with an average dosage (57.19 h) was 0.38, and dosage predicted effect size positively (β = 0.003), suggesting that, with each additional hour of instructional time, the effect size increases by 0.003. Dosage explained 7.96% of the variance in effect sizes; however, the effect of dosage was not statistically significant (F = 4.20, df = 13.80, p = .06).
3.3.3. Study quality
Study quality explained 6.21% of the variance in effect sizes but was not a significant moderator as a whole in an omibus test (F = 1.12, df = 3.68, p = .45). Descriptively speaking, higher-quality studies tended to have smaller effects than the lowest-quality studies (M gs = 0.63, 0.39, 0.29, and 0.22 for studies rated “1” [lowest quality], “2,” “3,” and “4” [highest quality], respectively); however, only two studies earned the highest “4” rating, which at least partially explains why the standard error was large and the p-value was nonsignificant when comparing lowest-quality studies and highest-quality studies.
3.3.4. Type of comprehension measure
Although comprehension measure type was not a significant moderator as a whole (F = 2.91, df = 4.50, p = .16), it explained 12.91% of the variance in effect sizes. Cloze reading comprehension assessments tended to be associated with larger effect sizes (M g = 0.43) than passage reading or sentence comprehension assessments (M gs = 0.27 and 0.22, respectively).
3.3.5. Measurement timepoint
Measurement timepoint (posttest, follow-up) was not a significant moderator of intervention effects (F = −1.38, df = 7.23, p = .21) and it explained 1.95% of the variance in effect sizes, although effect sizes tended to be somewhat smaller at follow-up (M gs = 0.39 vs. 0.29).
3.3.6. Multiple meta-regression analysis
To better understand each moderator’s effect in the presence of other moderators, we conducted a multiple meta-regression analysis. Results from the omnibus Wald test indicated that moderators included in the multiple meta-regression were not significant as a whole (F = 2.52, df = 6.08, p = .14). The covariates included in the multiple moderator analysis explained 36.96% of the variance in effect sizes (τ2 = 0.005; ω2 = 0.047). As demonstrated in Table 4, results of the Wald test of each moderator, controlling for other moderators in the model, indicated that only measurement timepoint was a significant moderator (F = 7.35, df = 7.48, p = .03), with the mean effect size at follow-up being smaller by 0.17 (p = .03) than the mean effect size at immediate posttest. In addition, while measurement type was not a significant moderator as a whole (F = 3.28, df = 4.45, p = .13), the mean effect size on cloze format measures was larger by 0.20 (p = .04) than the mean effect size on passage reading measures. Similarly, study quality was not a significant moderator as a whole (F = 2.11, df = 5.23, p = .21), but studies with the highest quality rating (note that there were only two studies with this rating) had a mean effect size that was smaller by 0.48 than studies with the lowest quality rating; studies with the second-highest quality rating (n = 19) had a mean effect size that was smaller by 0.43 than studies with the lowest quality rating.
Table 4.
Multiple meta-regression moderator analysis results.
| Moderator | beta | SE | df | P | F | df | P |
|---|---|---|---|---|---|---|---|
| Model | 2.52 | 6.08 | .14 | ||||
| Intercept | 0.61 | 0.16 | 10.53 | .00 | |||
| Instructional emphasis | 0.002 | 15.8 | .97 | ||||
| Foundational | 0.003 | 0.08 | 15.81 | .97 | |||
| Dosage | 0.002 | 0.002 | 13.51 | .41 | 1.11 | 14.2 | .31 |
| DV timepoint | 7.35 | 7.48 | .03 | ||||
| Follow-up | −0.17 | 0.06 | 7.48 | .03 | |||
| DV type | 3.28 | 4.45 | .13 | ||||
| Cloze format | 0.20 | 0.09 | 10.66 | .04 | |||
| Sentence reading | 0.01 | 0.11 | 2.85 | .95 | |||
| Study quality | 2.11 | 5.23 | .21 | ||||
| 2 | −0.32 | 0.14 | 8.83 | .06 | |||
| 3 | −0.43 | 0.16 | 8.76 | .03 | |||
| 4 | −0.48 | 0.23 | 3.19 | .12 |
Note: Dosage = Hours of intervention provided; DV = Dependent variable; Reference groups: Instructional Emphasis = Multicomponent; DV Timepoint = Immediate posttest; DV Type = Passage reading; Study Quality = 1; Study quality ratings range from 1 to 4, with 4 being the highest quality studies.
3.3.7. Publication bias
The modified Egger’s regression test result indicated that standard errors of effect size estimates did not predict effect size estimates across the studies ( = 1.46, t(19.8) = 1.88, p = .08). Findings from the p-curve analysis confirm the results of the Egger’s test. Right-skewness test of the p curve was significant (binomial = 0.00, p < .001) while the flatness test was not significant (binomial = 0.96, p > .009), suggesting that evidential value is present and there is a true effect size behind our findings such that they are not the result of p hacking.
4. Discussion
This meta-analysis investigated the effects of small-group or individual reading interventions on the reading comprehension of primary-grade students with RDs. A total of 47 studies met criteria for inclusion. An overall mean weighted effect size of 0.37 (m = 112) on norm-referenced reading comprehension outcomes indicates that small-group or individually-administered reading interventions have an educationally meaningful effect on reading comprehension for primary-grade students with RDs. Wanzek et al. (2016) reported a mean effect size of 0.38 on standardized measures of language and comprehension (including vocabulary measures) for reading interventions provided for less than 100 h. Suggate (2010) reported similar mean effects on standardized and unstandardized comprehension outcomes for small- and large-group reading interventions in preschool through Grade 4 (M ds ranging from 0.16 to 0.52). These converging findings increase the confidence with which we can state that reading interventions can be expected to result in reading comprehension gains for students with RDs in Grades K-3.
Because this meta-analysis revealed significant variance in reading comprehension outcomes, we also explored the effects of potential moderators (see Tables 3 and 4). First, we examined the degree to which instructional emphasis (i.e., emphasis on code-oriented foundational reading skills or on a combination of foundational reading skills and comprehension) moderated intervention effects for primary-grade students with RDs. We found there were no statistically significant differences in the magnitude of effects for foundational skills-only and multicomponent interventions. The descriptive effect size information associated with the instructional emphasis moderator variable suggested that foundational skills instruction and multicomponent instruction had similarly positive impacts on reading comprehension outcomes (M g = 0.40 and M g = 0.33, respectively), and the Instructional Emphasis variable did not explain any variance in intervention effect sizes.
The fact that instruction focused exclusively on code-oriented foundational reading skills and instruction that had a combined emphasis on foundational skills and text comprehension did not differ in their impacts on reading comprehension for primary-grade students with RDs is noteworthy. This finding supports hypotheses based on the simple view of reading (Gough & Tunmer, 1986; Hoover & Gough, 1990) that, since reading comprehension is a product of word identification and linguistic comprehension skill, improvement in word identification would be expected to result in improvement in reading comprehension. Nevertheless, one might expect that instruction focused on both word identification and text comprehension would produce greater gains in reading comprehension than instruction focused on word identification instruction alone.
Wanzek et al. (2016) conducted a similar moderator analysis in their meta-analysis of the effects of Tier 2 interventions (i.e., interventions with less than 100 sessions). Specifically, they investigated the degree to which effects on standardized language and comprehension outcomes (including vocabulary measures) varied depending on intervention emphasis on foundational skills or multiple components. The findings of their moderator analysis were similar to ours: instructional emphasis did not explain a significant amount of the variance in language and comprehension outcomes (M g = 0.44 for foundational skills interventions; M g = 0.35 for multicomponent interventions). Wanzek et al. were cautious about over-interpreting their findings and noted that more studies of multicomponent interventions were needed at Grades 2 and 3. In the present instructional emphasis moderator analysis, we were able to include more studies than were included by Wanzek et al. (2016). In addition to identifying 20 studies (m = 46) that investigated the effects of foundational skills-only instruction, we identified 29 studies that investigated the impact of multicomponent reading instruction (m = 66); 13 of these multicomponent studies included participants in second and/or third grades. Our findings still suggest that including comprehension as a component alongside of foundational skills instruction may not produce meaningfully different gains than providing foundational skills instruction alone when it comes to effects on comprehension outcomes for students with RDs in the primary grades.
Like Wanzek et al. (2016), we interpret this finding with caution. It may be that for young students with RDs who are still learning to read words, it is just as beneficial for reading comprehension to devote all of students’ precious intervention time to foundational skills and text reading (i.e., as in the interventions we coded as providing foundational skills instruction alone) as it is to devote some time to foundational skills and some time to building the knowledge and skills that aid in text comprehension (i.e., as in the interventions we coded as providing multicomponent instruction). Emergent readers with RDs may have minimal knowledge of letter-sound correspondences and very little word reading proficiency; for these students, concentrated instruction in code-emphasis foundational skills may result in a level of reading accuracy and fluency that makes reading comprehension possible. It is important to acknowledge that students receiving a foundational skills-focused intervention were likely also receiving some type of language/text comprehension instruction during their Tier 1 or general education reading instruction. Students receiving foundational skills-focused interventions are not receiving foundational skills instruction alone, but rather intensive, small-group foundational skills-focused intervention combined with Tier 1 instruction that doubtless includes a focus on language/text comprehension.
Long-term effects of comprehension instruction must also be considered. Cross-sectional research demonstrates that, while word reading tends to make a larger contribution to reading comprehension for younger readers than it does for older readers (e.g., Catts et al., 2005; García & Cain, 2014; Keenan et al., 2008), linguistic comprehension (e.g., vocabulary knowledge, background knowledge, inference/reasoning skill) takes on increased importance when readers progress beyond the primary grades (e.g., Tighe & Schatschneider, 2014). The word and world knowledge that is crucial for students’ comprehension in the upper elementary and secondary grades must be built across time. Primary-grade instructional components emphasizing language comprehension may yield benefits that are realized in later grades. In addition, some of the meta-analyzed studies that included a reading comprehension component emphasized comprehension skills and strategies without simultaneously building language/background knowledge, something that theories of reading (Compton et al., 2014) and cross-sectional and longitudinal studies of the contributors to reading comprehension (e.g., Hwang, 2020) suggest to be important, and perhaps more important to the development of reading comprehension than the mastery of reading strategies. For all of these reasons, we do not interpret the results of our instructional emphasis moderator analyses as indicating that teachers of students in the primary grades should focus exclusively on foundational reading skills and omit instruction that builds vocabulary knowledge, background knowledge, inferential reasoning skill, and other elements of linguistic comprehension that contribute to reading comprehension.
Effects of reading interventions on reading comprehension were not significantly moderated by intervention dosage. In the multiple moderator analysis, the effect of dosage was small (M g = 0.002) and not significant (p = .31). This result differs from prior meta-analyses that have reported counterintuitive negative associations between intervention dosage and intervention effects (e.g., Hall et al., 2017; Scammacca et al., 2015; Tran et al., 2011; Wanzek et al., 2013). Scammacca et al. (2015) noted that study quality and dosage tend to covary, with higher-quality studies usually delivering larger dosages of instruction. The finding that higher-quality studies are generally associated with smaller effect sizes (Scammacca et al., 2015; see discussion below) combined with the tendency for higher-quality studies to deliver larger intervention dosages may be one explanation for the negative association between dosage and effect size. It is noteworthy that in our multiple moderator analysis that controlled for the effects of other moderators, we did not see this negative association. Instead, there was a slightly positive if statistically nonsignificant relation between intervention dosage and student outcomes.
Our findings suggest that methodological factors are important considerations when investigating the effects of reading interventions on comprehension outcomes. In the multiple meta-regression analysis, timepoint of testing was a significant moderator of the effects on comprehension outcomes. Measures collected weeks or months after the conclusion of intervention had weaker outcomes than those administered immediately following intervention; follow-up effect sizes were, on average, 0.17 smaller than effect sizes for immediate posttest measures. It is perhaps unsurprising that the effects of interventions fade somewhat over time; however, it is noteworthy that there appear to be lasting, educationally meaningful effects of early interventions on students’ reading comprehension.
Study quality (a variable reflecting outcome measure standardization, employment of a randomized research design, sample size, and measurement and reporting of implementation fidelity; Slavin & Madden, 2011; Slavin & Smith, 2009; WWC, 2020) was not a statistically significant moderator of effects. It is important to note that all studies were of relatively high quality due to the inclusion criterion requiring that studies employ a norm-referenced measure of reading comprehension. Even so, descriptively speaking, higher-quality studies tended to have smaller effects (M gs = 0.22 and 0.29 for studies that received ratings of “4” or “3,” respectively [i.e., the highest quality ratings]) than the lowest-quality studies (M g = 0.63 for studies that received ratings of “1”). Study quality variables have been shown to impact treatment effects in previous research, with larger sample sizes and/or more rigorous research designs typically associated with smaller effect sizes (e.g., Cheung & Slavin, 2012; Hall et al., 2017; Scammacca et al., 2015; Slavin & Smith, 2009). Superrealization bias is one possible explanation (Cheung & Slavin, 2012; Slavin & Smith, 2009); higher-quality studies (i.e., ones with larger samples and/or more rigorous research designs) may tend to be conducted in less controlled settings in which experimenters are unable provide the same degree of support to implementers and/or to ensure highest-quality intervention implementation. Studies conducted in more tightly-controlled experimental conditions can rarely be replicated at a large scale, but are more likely to yield large effects. In addition, publication bias may explain the association between higher-quality studies and smaller effects: not only do smaller-sample studies need to achieve much larger differences between groups in order to achieve statistically significant findings (which are too often a prerequisite for publication), but journal editors are also more likely to publish high-quality studies with small or null effects than they are to publish lower-quality studies reporting small or null effects. All of these factors may explain why studies with the two highest quality ratings (all of which had randomized research designs) tended to yield smaller effect sizes.
In addition, it appears to be important to consider study findings in light of the measures they use to assess reading comprehension. Comprehension measure type was not a significant moderator. Still, descriptively speaking, effects on cloze-format reading comprehension assessments tended to be larger (M g = 0.43) than effects on passage reading (M g = 0.27) or sentence reading (M g = 0.22) comprehension assessments. When controlling for other theoretically important moderators in the multiple moderator analysis, cloze reading comprehension measures had effect sizes that were larger than passage-level reading comprehension measures by 0.20 on average. Measures of reading comprehension used in reading intervention studies have been found to differ in the extent to which they tap into students’ decoding skills or their linguistic comprehension (Cutting & Scarborough, 2006; Keenan et al., 2008). Keenan et al. (2008) found that decoding ability, rather than linguistic comprehension, accounted for most of the variance in students’ scores on a cloze-format reading comprehension test and a test of sentence comprehension, while linguistic comprehension accounted for substantial variance in scores on measures that required students to read and respond to passages. This effect was larger for younger students (M age 9.1 years) than for older students.
4.1. Limitations
Relative to other meta-analyses on the topic of reading interventions (e.g., Wanzek et al., 2016, 2018), this meta-analysis had a large sample of studies (k = 47) that were of relatively high quality, with experimental or quasi-experimental research designs and standardized, norm-referenced comprehension measures. However, findings are limited by the fact that we did not include results from the so-called “grey literature” (i.e., master’s theses, doctoral dissertations, conference presentations, and other research reports that are not published in academic journals). We view the exclusion of grey literature as a significant limitation, as it increases the risk of a publication bias confound. There is a need for future research to replicate this meta-analysis while including both peer-reviewed studies and studies that appear in the grey literature. A future meta-analysis of this type would provide a more robust estimate of the effects of foundational skills and multicomponent reading interventions on reading comprehension for students with reading difficulties.
This meta-analysis was also limited by the information provided in the individual studies that were included. For example, researchers frequently failed to describe the comparison or control condition in any level of detail. It had originally been our intent to examine whether effects on comprehension were moderated by the nature of the comparison condition, such as whether students were removed from their regular reading classes to receive the experimental intervention and what proportion of the comparison students received an alternate supplemental reading intervention provided by their schools outside of the researcher’s control. Due to insufficient description of these factors in the included studies, analysis of their impacts on comprehension outcomes was not possible. Additionally, some researchers failed to report the numbers of participants who provided data for each comprehension measure administered at post-test or follow-up data collection points. The rigor of meta-analytic results would be increased with more precise information about sample sizes for each outcome.
Finally, it is conventional for meta-analysis to rely on posttest means and standard deviations for the calculation of individual study effect sizes, as these descriptive statistics are reliably reported in published papers on intervention studies. However, in a large number of studies included in this meta-analysis, researchers provided posttest means unadjusted for pretest scores on the variables of interest (something that subsequent study analyses accounted for). Thus, differences between groups at pretest could not be accounted for in our meta-analysis.
4.2. Implications for research and practice
The findings of this meta-analysis confirm that small-group or individual interventions that include a foundational reading skills component, when provided to students with RDs in Grades K-3, are likely to positively impact these students’ reading comprehension ability. While it is not clear that there is “added value” for interventions that, in addition to supporting fluent and accurate word/text reading, devote time to teaching reading comprehension skills or strategies, it is possible that interventions that target reading comprehension in the primary grades might impact later (e.g., upper-elementary-grade) reading comprehension skill. This may be especially true when considering the cumulative effects of three or more years of instruction targeting text comprehension (Quinn et al., 2015). The proportions of instructional time devoted to code-oriented instruction and meaning-focused instruction are likely best determined by the use of diagnostic reading assessments to tailor instruction to the needs of the learner (Connor et al., 2013).
Our findings also have implications for researchers. When studying the effects of early intervention on reading comprehension, it may be important to acknowledge that effects can be expected to differ for cloze-format measures of reading comprehension compared with measures that that require students to read sentences or passages. Future meta-analyses will yield more accurate effect size estimates if they can account for the nature of comparison conditions. Researchers should be encouraged to report details related to instructional content and methods of delivery in the comparison condition, as well as in the treatment condition. The precision of analyses of the impact of intervention dosage, or time in intervention, would be greatly enhanced if researchers reported the average numbers of hours for which intervention was provided in each study. Finally, we suggest that researchers publish post-test means that are adjusted for pretest and other covariates, so that meta-analyses can better account for pretest differences on the variables of interest.
Author note.
The research reported here was supported by grant R305A180094 from the Institute of Education Sciences, U.S. Department of Education and by grant 5P50 HD052117-12 from the Eunice Kennedy Shriver National Institute of Child Health and Human Development. The content is solely the responsibility of the authors and does not necessarily represent the official views of the Institute of Education Sciences, the U.S. Department of Education, the Eunice Kennedy Shriver National Institute of Child Health and Human Development, or the National Institutes of Health.
Footnotes
The authors declare they have no conflict of interest.
Studies preceded by an asterisk were included in the meta-analysis.
References1
- *.Al Otaiba S, Schatschneider C, & Silverman E (2005). Tutor-assisted intensive learning strategies in kindergarten: How much is enough? Exceptionality, 13(4), 195–208. 10.1207/s15327035ex1304_2. [DOI] [Google Scholar]
- *.Apel K, & Diehm E (2013). Morphological awareness intervention with kindergarteners and first and second grade students from low SES homes: A small efficacy study. Journal of Learning Disabilities, 47(1), 65–75. 10.1177/0022219413509964. [DOI] [PubMed] [Google Scholar]
- *.Baker DL, Burns D, Kame’enui EJ, Smolkowski K, & Baker SK (2016). Does supplemental instruction support the transition from Spanish to English reading instruction for first-grade English learners at risk of reading difficulties? Learning Disability Quarterly, 39(4), 226–239. 10.1177/0731948715616757. [DOI] [Google Scholar]
- *.Baker S, Gersten R, & Keating T (2000). When less may be more: A 2-year longitudinal evaluation of a volunteer tutoring program requiring minimal training. Reading Research Quarterly, 35(4), 494–519. Retrieved from https://www.jstor.org/stable/748095. [Google Scholar]
- *.Berninger VW, Abbott RD, Vermeulen K, & Fulton CM (2006). Paths to reading comprehension in at-risk second-grade readers. Journal of Learning Disabilities, 39(4), 334–351. 10.1177/00222194060390040701. [DOI] [PubMed] [Google Scholar]
- Berninger VW, Vermeulen K, Abbott RD, McCutchen D, Cotton S, Cude J, …Sharon T (2003). Comparison of three approaches to supplementary reading instruction for low-achieving second-grade readers. Language, Speech, and Hearing Services in Schools, 34(2), 101–116. 10.1044/0161-1461(2003/009. [DOI] [PubMed] [Google Scholar]
- *.Brown KJ, Morris D, & Fields M (2005). Intervention after grade 1: Serving increased numbers of struggling readers effectively. Journal of Literacy Research, 37 (1), 61–94. 10.1207/s15548430jlr3701_3. [DOI] [Google Scholar]
- *.Burns MK, Senesac BV, & Symington T (2004). The effectiveness of the HOSTS program in improving the reading achievement of children at-risk for reading failure. Reading Research and Instruction, 43(2), 87–104. 10.1080/19388070409558406. [DOI] [Google Scholar]
- Catts HW, Hogan TP, & Adlof SM (2005). Developmental changes in reading and reading disabilities. In The connections between language and reading disabilities (pp. 25–40). Lawrence Erlbaum Associates Publishers. [Google Scholar]
- *.Center Y, Wheldall K, Freeman L, Outhred L, & McNaught M (1995). An evaluation of Reading Recovery. Reading Research Quarterly, 30(2), 240–263. Retrieved from https://www.jstor.org/stable/748034. [Google Scholar]
- *.Chapman JW, Tunmer WE, & Prochnow JE (2001). Does success in the Reading Recovery program depend on developing proficiency in phonological-processing skills? A longitudinal study in a whole language instructional context. Scientific Studies of Reading, 5(2), 141–176. 10.1207/S1532799Xssr0502_2. [DOI] [Google Scholar]
- Cheung AC, & Slavin RE (2012). How features of educational technology applications affect student reading outcomes: A meta-analysis. Educational Research Review, 7(3), 198–215. [Google Scholar]
- Compton DL, Miller AC, Elleman AM, & Steacy LM (2014). Have we forsaken reading theory in the name of “quick fix” interventions for children with reading disability? Scientific Studies of Reading, 18(1), 55–73. [Google Scholar]
- Connor CM, Morrison FJ, Fishman B, Crowe EC, Al Otaiba S, & Schatschneider C (2013). A longitudinal cluster-randomized controlled study on the accumulating effects of individualized literacy instruction on students’ reading from first through third grade. Psychological Science, 24(8), 1408–1419. [DOI] [PMC free article] [PubMed] [Google Scholar]
- Cutting LE, & Scarborough HS (2006). Prediction of reading comprehension: Relative contributions of word recognition, language proficiency, and other cognitive skills can depend on how comprehension is measured. Scientific Studies of Reading, 10(3), 277–299. 10.1207/s1532799xssr1003_5. [DOI] [Google Scholar]
- Cutting LE, & Scarborough HS (2009). Prediction of reading comprehension: Relative contributions of word recognition, language proficiency, and other cognitive skills can depend on how comprehension is measured. Scientific Studies of Reading, 10(3), 277–299. [Google Scholar]
- Denton CA (2012). Response to intervention for reading difficulties in the primary grades: Some answers and lingering questions. Journal of Learning Disabilities, 45, 232–243. [DOI] [PMC free article] [PubMed] [Google Scholar]
- Denton CA, Cirino PT, Barth AE, Romain M, Vaughn S, Wexler J, …Fletcher JM (2011). An experimental study of scheduling and duration of “tier 2” first grade reading intervention. Journal of Research on Educational Effectiveness, 4, 208–230. [DOI] [PMC free article] [PubMed] [Google Scholar]
- *.Denton CA, Fletcher JM, Taylor WP, Barth AE, & Vaughn S (2014). An experimental evaluation of guided reading and explicit interventions for primary-grade students at-risk for reading difficulties. Journal of Research on Educational Effectiveness, 7(3), 268–293. 10.1080/19345747.2014.906010. [DOI] [PMC free article] [PubMed] [Google Scholar]
- *.Denton CA, Nimon K, Mathes PG, Swanson EA, Kethley C, Kurz TB, &Shih M (2010). Effectiveness of a supplemental early reading intervention scaled up in multiple schools. Exceptional Children, 76(4), 394–416. 10.1177/001440291007600402. [DOI] [Google Scholar]
- *.Duff FJ, Hulme C, Grainger K, Hardwick SJ, Miles JNV, & Snowling MJ(2014). Reading and language intervention for children at risk of dyslexia: A randomised controlled trial. Journal of Child Psychology and Psychiatry, 55(11), 1234–1243. 10.1111/jcpp.12257. [DOI] [PMC free article] [PubMed] [Google Scholar]
- Egger M, Smith GD, Schneider M, & Minder C (1997). Bias in meta-analysis detected by a simple, graphical test. BMJ, 315(7109), 629–634. [DOI] [PMC free article] [PubMed] [Google Scholar]
- *.Ehri LC, Dreyer LG, Flugman B, & Gross A (2007). Reading Rescue: An effective tutoring intervention model for language-minority students who are struggling readers in first grade. American Educational Research Journal, 44(2), 414–448. 10.3102/0002831207302175. [DOI] [Google Scholar]
- *.Fien H, Smith JLM, Smolkowski K, Baker SK, Nelson NJ, & Chaparro E(2015). An examination of the efficacy of a multitiered intervention on early reading outcomes for first grade students at risk for reading difficulties. Journal of Learning Disabilities, 48(6), 602–621. 10.1177/0022219414521664. [DOI] [PubMed] [Google Scholar]
- Foorman B, Beyler N, Borradaile K, Coyne M, Denton CA, Dimino J, … Wissel S(2016). Foundational skills to support reading for understanding in kindergarten through 3rd grade (NCEE 2016–4008). Washington, DC: National Center for Education Evaluation and Regional Assistance (NCEE), Institute of Education Sciences, U.S. Department of Education. Retrieved from the NCEE website: http://whatworks.ed.gov. [Google Scholar]
- García JR, & Cain K (2014). Decoding and reading comprehension: A meta-analysis to identify which reader and assessment characteristics influence the strength of the relationship in English. Review of Educational Research, 84(1), 74–111. 10.3102/0034654313499616. [DOI] [Google Scholar]
- Gersten R, Compton D, Connor CM, Dimino J, Santoro L, Linan-Thompson S, & Tilly WD (2008). Assisting students struggling with reading: Response to intervention and multitier intervention for reading in the primary grades. A practice guide (NCEE 2009–4045) Washington, DC: U.S. Department of Education, National Center for Education Evaluation and Regional Assistance, Institute of Education Sciences. Retrieved from http://ies.ed.gov/ncee/wwc/publications/practiceguides/. [Google Scholar]
- Gough PB, & Tunmer WE (1986). Decoding, reading, and reading disability. RASE: Remedial & Special Education, 7(1), 6–10. 10.1177/074193258600700104. [DOI] [Google Scholar]
- *.Gunn B, Biglan A, Smolkowski K, & Ary D (2000). The efficacy of supplemental instruction in decoding skills for Hispanic and non-Hispanic students in early elementary school. The Journal of Special Education, 34(2), 90–103. 10.1177/002246690003400204. [DOI] [PMC free article] [PubMed] [Google Scholar]
- *.Gunn B, Biglan A, Smolkowski K, & Black C (2002). Supplemental instruction in decoding skills for Hispanic and non-Hispanic students in early elementary school: A follow-up. The Journal of Special Education, 36(2), 69–79. 10.1177/00224669020360020201. [DOI] [PMC free article] [PubMed] [Google Scholar]
- Hall C, Roberts GJ, Cho E, McCulley LV, Carroll M, & Vaughn S (2017). Reading instruction for English learners in the middle grades: A meta-analysis. Educational Psychology Review, 29(4), 763–794. [Google Scholar]
- Harrer M, Cuijpers P, Furukawa T, & Ebert DD (2019). dmetar: Companion R package for the guide ‘Doing meta-analysis in R’. R package version 0.0.9000 URL http://dmetar.protectlab.org/.
- Hatcher PJ, Hulme C, Miles JNV, Carroll JM, Hatcher J, Gibbs S, et al. (2006). Efficacyof small group reading intervention for beginning readers with reading-delay: A randomisedcontrolled trial. Journal of Child Psychology and Psychiatry, 47, 820–827. [DOI] [PubMed] [Google Scholar]
- Hedges LV, Tipton E, & Johnson MC (2010). Robust variance estimation in meta-regression with dependent effect size estimates. Research Synthesis Methods, 1(1), 39–65. 10.1002/jrsm.5. [DOI] [PubMed] [Google Scholar]
- Higgins JPT, Thompson SG, Deeks JJ, & Altman DG (2003). Measuring inconsistency in meta-analyses. BMJ (Clinical Research Ed.), 327(7414), 557–560. 10.1136/bmj.327.7414.557. [DOI] [PMC free article] [PubMed] [Google Scholar]
- Hoover WA, & Gough PB (1990). The simple view of reading. Reading and Writing: An Interdisciplinary Journal, 2(2), 127–160. 10.1007/BF00401799. [DOI] [Google Scholar]
- *.Hurry J, & Sylva K (2007). Long-term outcomes of early reading intervention. Journal of Research in Reading, 30(3), 227–248. 10.1111/j.1467-9817.2007.00338.x. [DOI] [Google Scholar]
- Hwang H (2020). Early general knowledge predicts English reading growth in bilingual and monolingual students throughout the elementary years. The Elementary School Journal, 121(1), 154–178. [Google Scholar]
- *.Jenkins JR, Peyton JA, Sanders EA, & Vadasy PF (2004). Effects of reading decodable texts in supplemental first-grade tutoring. Scientific Studies of Reading, 8 (1), 53–85. 10.1207/s1532799xssr0801_4. [DOI] [Google Scholar]
- Keenan JM, Betjemann RS, & Olson RK (2008). Reading comprehension tests vary in the skills they assess: Differential dependence on decoding and oral comprehension. Scientific Studies of Reading, 12(3), 281–300. 10.1080/10888430802132279. [DOI] [Google Scholar]
- Kim YG (2017). Why the simple view of reading is not simplistic: Unpacking component skills of reading using a direct and indirect effect model of reading (DIER). Scientific Studies of Reading, 21(4), 310–333. 10.1080/10888438.2017.1291643. [DOI] [Google Scholar]
- *.Lee YS, Morrow-Howell N, Jonson-Reid M, & McCrary S (2011). The effects of the Experience Corps® program on student reading outcomes. Education and Urban Society, 44(1), 97–118. 10.1177/0013124510381262. [DOI] [Google Scholar]
- *.Lovett MW, Frijters JC, Wolf M, Steinbach KA, Sevcik RA, & Morris RD (2017). Early intervention for children at risk for reading disabilities: The impact of grade at intervention and individual differences on intervention outcomes. Journal of Educational Psychology, 109(7), 889–914. 10.1037/edu0000181. [DOI] [PMC free article] [PubMed] [Google Scholar]
- *.Mathes PG, & Babyak AE (2001). The effects of peer-assisted literacy strategies for first-grade readers with and without additional mini-skills lessons. Learning Disabilities Research & Practice, 16(1), 28–44. 10.1111/0938-8982.00004. [DOI] [Google Scholar]
- *.Mathes PG, Denton CA, Fletcher JM, Anthony JL, Francis DJ, &Schatschneider C (2005). The effects of theoretically different instruction and student characteristics on the skills of struggling readers. Reading Research Quarterly, 40(2), 148–182. 10.1598/RRQ.40.2.2. [DOI] [Google Scholar]
- *.Mathes RG, Torgesen JK, Clancy-Menchetti J, Santi K, Nicholas KR,Robinson C, & Grek M (2003). A comparison of teacher-directed versus peer-assisted instruction to struggling first-grade readers. The Elementary School Journal, 103(5), 459–479. Retrieved from https://www.jstor.org/stable/1002113. [Google Scholar]
- *.Miller SD (2003). Partners-in-Reading: Using classroom assistants to provide tutorial assistance to struggling first-grade readers. Journal of Education for Students Placed at Risk, 8(3), 333–349. 10.1207/S15327671ESPR0803_3. [DOI] [Google Scholar]
- *.Morris D, Tyner B, & Perney J (2000). Early steps: Replicating the effect of a first-grade reading intervention program. Journal of Educational Psychology, 92(4), 681–693. 10.1037//0022-0663.92.4.681. [DOI] [Google Scholar]
- *.Morris RD, Lovett MW, Wolf M, Sevcik RA, Steinbach KA, Frijters JC, &Shapiro MB (2012). Multiple-component remediation for developmental reading disabilities: IQ, socioeconomic status, and race as factors in remedial outcome. Journal of Learning Disabilities, 45(2), 99–127. 10.1177/0022219409355472. [DOI] [PMC free article] [PubMed] [Google Scholar]
- Oakhill JV, & Cain K (2012). The precursors of reading ability in young readers:Evidence from a four-year longitudinal study. Scientific Studies of Reading, 16(2), 91–121. 10.1080/10888438.2010.529219. [DOI] [Google Scholar]
- *.O’Connor RE, Bocian KM, Sanchez V, & Beach KD (2014). Access to a responsiveness to intervention model: Does beginning intervention in kindergarten matter? Journal of Learning Disabilities, 47(4), 307–328. 10.1177/0022219412459354. [DOI] [PubMed] [Google Scholar]
- *.O’Shaughnessy TE, & Swanson HL (2000). A comparison of two reading interventions for children with reading disabilities. Journal of Learning Disabilities, 33 (3), 257–277. 10.1177/002221940003300304. [DOI] [PubMed] [Google Scholar]
- Pustejovsky JE (2016). scdhlm: A web-based calculator for between-case standardized mean differences (version 0.3.1) [Web application] Retrieved from: https://jepusto.shinyapps.io/scdhlm.
- Quinn JM, Wagner RK, Petscher Y, & Lopez D (2015). Developmental relations between vocabulary knowledge and reading comprehension: a latent change score modeling study. Child Development, 86(1), 159–175. [DOI] [PMC free article] [PubMed] [Google Scholar]
- R Core Team. (2019). R: A language and environment for statistical computing. URL. R Foundation for Statistical Computing, Vienna, Austria. https://www.R-project.org. [Google Scholar]
- *.Rashotte CA, MacPhee K, & Torgesen JK (2001). The effectiveness of a group reading instruction program with poor readers in multiple grades. Learning Disability Quarterly, 24, 119–134. 10.2307/1511068. [DOI] [Google Scholar]
- Rodgers MA, & Pustejovsky JE (2020). Evaluating meta-analytic methods to detect selective reporting in the presence of dependent effect sizes. Psychological Methods, 141–160. Advance online publication 10.1037/met0000300. [DOI] [PubMed] [Google Scholar]
- *.Ryder JF, Tunmer WE, & Greaney KT (2008). Explicit instruction in phonemic awareness and phonemically based decoding skills as an intervention strategy for struggling readers in whole language classrooms. Reading and Writing: An Interdisciplinary Journal, 21(4), 349–369. 10.1007/s11145-007-9080-z. [DOI] [Google Scholar]
- *.Santa CM, & Høien T (1999). An assessment of Early Steps: A program for early intervention of reading problems. Reading Research Quarterly, 34(1), 54–79. Retrieved from https://www.jstor.org/stable/748269. [Google Scholar]
- Scammacca NK, Roberts G, Vaughn S, & Stuebing KK (2015). A meta-analysis of interventions for struggling readers in grades 4–12: 1980–2011. Journal of Learning Disabilities, 48(4), 369–390. [DOI] [PMC free article] [PubMed] [Google Scholar]
- *.Schwartz RM (2005). Literacy learning of at-risk first-grade students in the Reading Recovery early intervention. Journal of Educational Psychology, 97(2), 257–267. 10.1037/0022-0663.97.2.257. [DOI] [Google Scholar]
- Shanahan T, Callison K, Carriere C, Duke NK, Pearson PD, Schatschneider C, & Torgesen J (2010). Improving reading comprehension in kindergarten through 3rd grade: A practice guide (NCEE 2010–4038). Washington, DC: National Center for Education Evaluation and Regional Assistance, Institute of Education Sciences, U.S. Department of Education. Retrieved from https://whatworks.ed.gov/publications/practiceguides. [Google Scholar]
- *.Simmons DC, Coyne MD, Hagan-Burke S, Kwok O, Simmons L, Johnson C, …Crevecoeur YC (2011). Effects of supplemental reading interventions in authentic contexts: A comparison of kindergarteners’ response. Exceptional Children, 77(2), 207–228. 10.1177/001440291107700204. [DOI] [Google Scholar]
- Simonsohn U, Nelson LD, & Simmons JP (2014). p-Curve and effect size: Correcting for publication bias using only significant results. Perspectives on Psychological Science, 9(6), 666–681. [DOI] [PubMed] [Google Scholar]
- Slavin RE, & Madden NA (2011). Measures inherent to treatments in program effectiveness reviews. Journal of Research on Educational Effectiveness, 4, 370–380. [Google Scholar]
- Slavin RE, & Smith D (2009). The relationship between sample sizes and effect sizes in systematic review in education. Educational Evaluation and Policy Analysis, 31(4), 500–506. [Google Scholar]
- *.Smith JLM, Nelson NJ, Smolkowski K, Baker SK, Fien H, & Kosty D (2016). Examining the efficacy of a multitiered intervention for at-risk readers in grade 1. The Elementary School Journal, 116(4), 549–573. 10.1086/686249. [DOI] [Google Scholar]
- *.Solari EJ, Denton CA, Petscher Y, & Haring C (2018). Examining the effects and feasibility of a teacher-implemented Tier 1 and Tier 2 intervention in word reading, fluency, and comprehension. Journal of Research on Educational Effectiveness, 11(2), 163–191. 10.1080/19345747.2017.1375582. [DOI] [Google Scholar]
- Suggate SP (2010). Why what we teach depends on when: Grade and reading intervention modality moderate effect size. Developmental Psychology, 46(6), 1556–1579. 10.1037/a0020612. [DOI] [PubMed] [Google Scholar]
- Tighe EL, & Schatschneider C (2014). A dominance analysis approach to determining predictor importance in third, seventh, and tenth grade reading comprehension skills. Reading and Writing, 27(1), 101–127. [DOI] [PMC free article] [PubMed] [Google Scholar]
- Tipton E (2015). Small sample adjustments for robust variance estimation with meta-regression. Psychological Methods, 20(3), 375–393. 10.1037/met0000011. [DOI] [PubMed] [Google Scholar]
- Tipton E, & Pustejovsky JE (2015). Small-sample adjustments for tests of moderators and model fit using robust variance estimation in meta-regression. Journal of Educational and Behavioral Statistics, 40(6), 604–634. 10.3102/1076998615606099. [DOI] [Google Scholar]
- *.Torgesen JK, Wagner RK, Rashotte CA, Herron J, & Lindamood P (2010). Computer-assisted instruction to prevent early reading difficulties in students at risk for dyslexia: Outcomes from two instructional approaches. Annals of Dyslexia, 60, 40–56. 10.1007/s11881-009-0032-y. [DOI] [PMC free article] [PubMed] [Google Scholar]
- *.Torgesen JK, Wagner RK, Rashotte CA, Rose E, Lindamood P, Conway T, &Garvan C (1999). Preventing reading failure in young children with phonological processing disabilities: Group and individual responses to instruction. Journal of Educational Psychology, 91(4), 579–593. 10.1037/0022-0663.91.4.579. [DOI] [Google Scholar]
- *.Toste JR, Capin P, Vaughn S, Roberts GJ, & Kearns DM (2017). Multisyllabic word-reading instruction with and without motivational beliefs training for struggling readers in the upper elementary grades: A pilot investigation. The Elementary School Journal, 117(4), 593–615. 10.1086/691684. [DOI] [Google Scholar]
- Tran L, Sanchez T, Arellano B, & Lee Swanson H (2011). A meta-analysis of the RTI literature for children at risk for reading disabilities. Journal of Learning Disabilities, 44(3), 283–295. [DOI] [PubMed] [Google Scholar]
- Tukey JW (1977). Exploratory data analysis (Vol. 2). [Google Scholar]
- *.Vadasy PF, & Sanders EA (2008a). Code-oriented instruction for kindergarten students at risk for reading difficulties: A replication and comparison of instructional groupings. Reading and Writing: An Interdisciplinary Journal, 21, 929–963. 10.1007/s11145-008-9119-9. [DOI] [Google Scholar]
- *.Vadasy PF, & Sanders EA (2008b). Repeated reading intervention: Outcomes and interactions with readers’ skills and classroom instruction. Journal of Educational Psychology, 100(2), 272–290. 10.1037/0022-0663.100.2.272. [DOI] [Google Scholar]
- *.Vadasy PF, & Sanders EA (2009). Supplemental fluency intervention and determinants of reading outcomes. Scientific Studies of Reading, 13(5), 383–425. 10.1080/10888430903162894. [DOI] [Google Scholar]
- *.Vadasy PF, & Sanders EA (2010). Efficacy of supplemental phonics-based instruction for low-skilled kindergarteners in the context of language minority status and classroom phonics instruction. Journal of Educational Psychology, 102(4), 786–803. 10.1037/a0019639. [DOI] [Google Scholar]
- *.Vadasy PF, & Sanders EA (2011). Efficacy of supplemental phonics-based instruction for low-skilled first graders: How language minority status and pretest characteristics moderate treatment response. Scientific Studies of Reading, 15(6), 471–497. 10.1080/10888438.2010.501091. [DOI] [Google Scholar]
- *.Vadasy PF, & Sanders EA (2013). Two-year follow-up of a code-oriented intervention for lower-skilled first-graders: The influence of language status and word reading skills on third-grade literacy outcomes. Reading and Writing: An Interdisciplinary Journal, 26, 821–843. 10.1007/s11145-012-9393-4. [DOI] [Google Scholar]
- *.Vadasy PF, Sanders EA, & Peyton JA (2005). Relative effectiveness of reading practice or word-level instruction in supplemental tutoring: How text matters. Journal of Learning Disabilities, 38(4), 364–380. 10.1177/00222194050380041401. [DOI] [PubMed] [Google Scholar]
- *.Vadasy PF, Sanders EA, & Peyton JA (2006). Code-oriented instruction for kindergarten students at risk for reading difficulties: A randomized field trial with paraeducator implementers. Journal of Educational Psychology, 98(3), 508–528. 10.1037/0022-0663.98.3.508. [DOI] [Google Scholar]
- Vadasy PF, Sanders EA, Peyton JA, & Jenkins JR (2002). Timing and intensity of tutoring: A closer look at the conditions for effective early literacy tutoring. Learning Disabilities Research & Practice, 17(4), 227–241. 10.1111/1540-5826.00048. [DOI] [Google Scholar]
- Vaughn S, Linan-Thompson S, & Hickman P (2003). Response to instruction as a means of identifying students with reading/learning disabilities. Exceptional Children, 69(4), 391–409. [Google Scholar]
- *.Vaughn S, Mathes P, Linan-Thompson S, Cirino P, Carlson C, Pollard-Durodola S, … Francis D (2006). Effectiveness of an English intervention for first-grade English language learners at risk for reading problems. The Elementary School Journal, 107 (2), 153–180. 10.1086/510653. [DOI] [Google Scholar]
- Viechtbauer W (2010). Conducting meta-analyses in R with the metaphor package. Journal of Statistical Software, 36(3), 1–48. https://www.jstatsoft.org/v36/i03/. [Google Scholar]
- Wallace BC, Small K, Brodley CE, Lau J, & Trikalinos TA (2012). Deploying an interactive machine learning system in an Evidence-Based Practice Center: Abstrackr. IHI’12 - Proceedings of the 2nd ACM SIGHIT International Health Informatics Symposium (pp. 819–823). 10.1145/2110363.2110464. [DOI] [Google Scholar]
- *.Wang C, & Algozzine B (2008). Effects of targeted intervention on early literacy skills of at-risk students. Journal of Research in Childhood Education, 22(4), 425–439. 10.1080/02568540809594637. [DOI] [Google Scholar]
- Wanzek J, Stevens EA, Williams KJ, Scammacca N, Vaughn S, & Sargent K (2018). Current evidence on the effects of intensive early reading interventions. Journal of Learning Disabilities, 51(6), 612–624. 10.1177/00222194187751. [DOI] [PMC free article] [PubMed] [Google Scholar]
- Wanzek J, & Vaughn S (2007). Research-based implications from extensive early reading interventions. School Psychology Review, 36(4), 541–561. Retrieved from https://www.meadowscenter.org/files/news/Wanzek_Vaughn_2007.pdf. [Google Scholar]
- *.Wanzek J, & Vaughn S (2008). Response to varying amounts of time in reading intervention for students with low response to intervention. Journal of Learning Disabilities, 41(2), 126–142. 10.1177/0022219407313426. [DOI] [PMC free article] [PubMed] [Google Scholar]
- Wanzek J, Vaughn S, Scammacca N, Gatlin B, Walker MA, & Capin P (2016). Meta-analyses of the effects of Tier 2 type reading interventions in grades K–3. Educational Psychology Review, 28, 551–576. 10.1007/s10648-015-9321-7. [DOI] [PMC free article] [PubMed] [Google Scholar]
- Wanzek J, Vaughn S, Scammacca N, Metz K, Murray C, Roberts G, & Danielson L (2013). Extensive reading interventions for students with reading difficulties after grade 3. Review of Educational Research, 83(2), 163–195. 10.3102/0034654313477212. [DOI] [Google Scholar]
- What Works Clearinghouse. (2020). Procedures and standards handbook (version 4.1) Retrieved from https://ies.ed.gov/ncee/wwc/Docs/referenceresources/WWC-Standards-Handbook-v4-1-508.pdf.