

Abstract
Background
Socioeconomic status (SES) impacts clinical outcomes associated with severe congenital heart disease (sCHD). We examined the impact of SES and remoteness of residence (RoR) on congenital heart disease (CHD) outcomes in Canada, a jurisdiction with universal health insurance.
Methods and Results
All infants born in Canada (excluding Quebec) from 2008 to 2018 and hospitalized with CHD requiring intervention in the first year were identified. Neighborhood level SES income quintiles were calculated, and RoR was categorized as residing <100 km, 100 to 299 km, or >300 km from the closest of 7 cardiac surgical programs. In‐hospital mortality at <1 year was the primary outcome, adjusted for preterm birth, low birth weight, and extracardiac pathology. Among 7711 infants, 4485 (58.2%) had moderate CHD (mCHD) and 3226 (41.8%) had sCHD. Overall mortality rate was 10.5%, with higher rates in sCHD than mCHD (13.3% versus 8.5%, respectively). More CHD infants were in the lowest compared with the highest SES category (27.1% versus 15.0%, respectively). The distribution of CHD across RoR categories was 52.3%, 21.3%, and 26.4% for <100 km, 100 to 299 km, and >300 km, respectively. Although SES and RoR had no impact on sCHD mortality, infants with mCHD living >300 km had a higher risk of mortality relative to those living <100 km (adjusted odds ratio [aOR], 1.43 [95% CI, 1.11–1.84]). Infants with mCHD within the lowest SES quintile and living farthest away had the highest risk for mortality (aOR, 1.74 [95% CI, 1.08–2.81]).
Conclusions
In Canada, neither RoR nor SES had an impact on outcomes of infants with sCHD. Greater RoR, however, may contribute to higher risk of mortality among infants with mCHD.
Keywords: clinical outcomes, congenital heart disease, population, remoteness of residence, socioeconomic status
Subject Categories: Disparities, Health Equity, Mortality/Survival
Nonstandard Abbreviations and Acronyms
- ECA
extracardiac anomalie
- PTB
preterm birth
- RoR
remoteness of residence
Clinical Perspective.
What Is New?
Increasing evidence suggests socioeconomic status impacts clinical outcomes associated with major congenital heart disease (CHD).
The current investigation, which uses administrative population data, represents one of the only studies to explore this relationship in a jurisdiction of universal health insurance, Canada, and one of a few to examine the impact of remoteness of residence on CHD outcomes.
What Are the Clinical Implications?
We found in Canada, which has universal health insurance, neither socioeconomic status nor remoteness of residence impacts hospital mortality for severe, including critical, CHD; however, greater remoteness of residence increases the risk of mortality for moderate complexity CHD, which could relate to delayed diagnosis and referral for intervention and/or inadequate surveillance.
Universal insurance may perform better for the most vulnerable infants (low socioeconomic status and severe complexity) with CHD.
Congenital heart disease (CHD) is the most common birth defect, found in 0.8% to 1.3% of livebirths, and accounts for 28% of major congenital anomalies. 1 , 2 , 3 Although most affected children live to adulthood because of enhancements in surgical and medical care, CHD still remains the leading cause of childhood death among congenital anomalies. 4 Several factors contribute to the mortality and morbidity of affected children, including more severe CHD, low birth weight and prematurity, timing of diagnosis, associated genetic abnormalities, and other comorbidities. 5
Sociodemographic factors are increasingly recognized as important contributors to CHD outcomes, with most of the supportive data from the United States. 6 Greater remoteness of residence (RoR) may also impact access to health services 7 ; however, its impact on CHD outcomes has received less attention. In a recent North American Fetal Heart Society initiative, although greater RoR was shown to be associated with reduced rates of prenatal detection of critical CHD in both the United States and Canada, 8 which could contribute to worse outcomes, 9 , 10 lower socioeconomic status (SES) was associated with reduced prenatal detection only in the United States. This could suggest different health care models may better facilitate prenatal services for more socially disadvantaged patients. In so doing, this could potentially reduce inequities in neonatal CHD outcomes.
Canada has a universal health care system that offers health coverage for all its citizens and permanent residents regardless of race or ethnicity, SES, and RoR. Currently, however, it is unclear whether this results in comparable clinical outcomes for patients with pediatric CHD across SES and RoR spectrums. Therefore, we sought to examine the relationships between SES and RoR, defined as distance from centralized pediatric cardiac centers, and in‐hospital mortality at 1 year, a period previously found to be most impacted by SES particularly for major CHD. 6 We also examined the association between SES and RoR and secondary outcomes of interest including time from first hospitalization to first cardiac intervention, length of stay at first intervention, and number of hospitalizations in the first year.
METHODS
The data underlying this article were provided by the Canadian Institutes of Health Information under the terms of a research agreement. Inquiries with respect to accessing the data acquired for this research can be made to help@cihi.ca.
Population
Infants born in Canada (excluding Quebec) from January 2008 to December 2018, diagnosed between 0 and 12 months of age and hospitalized with CHD, were identified by International Statistical Classification of Diseases and Related Health Problems, Tenth Revision, Canada (ICD‐10‐CA) codes within the CIHI‐DAD (Canadian Institute for Health Information–Discharge Abstract Database) (Table S1). Major CHD was defined as CHD requiring an intervention in the first year. Infants were included in the study if their first hospitalization with a CHD diagnosis was in the first year. CHD subtypes were classified as moderate CHD (mCHD) or severe CHD (sCHD) complexity according to the Bethesda task force. 11 For specific CHD subtypes with variable severity spectrum (eg, septal defects, Ebstein anomaly, coarctation, valve stenosis), infants were excluded if they survived the first year without an intervention. This was done to account for less‐severe lesions not distinguishable by ICD‐10‐CA codes. Infants were also excluded if income quintile, RoR, or sex was missing, or if they had lethal aneuploidy (eg, trisomies 13 and 18).
Demographic, Clinical, and Outcomes Data
Data collected included CHD diagnoses, sex, preterm birth (PTB; gestational age at birth <36 weeks), low birthweight (LBW; <2500 g), major extracardiac anomalies (ECAs; eg, diaphragmatic hernia, omphalocele) or associations (eg, VACTRL), and nonlethal genetic abnormalities (eg, trisomy 21, 22q11.2 deletion). In‐hospital mortality (any in‐hospital mortality in the first year), age and length of hospital stay at first intervention, and frequency of hospitalizations in the first year were examined. Any hospitalizations that occurred within 1 day were considered to be transfers and counted as a single hospitalization.
Socioeconomic Status
Our SES measure consisted of income quintiles using 2016 Canadian census data adjusted for urban/rural residence and household size. These were linked at the postal code level by the Canadian Institute for Health Information. 12 Quintile 1 represented the lowest and 5 the highest SES groups.
Remoteness of Residence
A direct‐line distance from the centroid of the postal code address to the nearest cardiac care center (1 of 7 surgical or 1 of 11 pediatric cardiology±surgical service centers) was used. Based on previous research, distance categories of <100 km, 100 to 299 km, and ≥300 km were chosen a priori. 13
Statistical Analysis
Analyses were done by lesion complexity (mCHD or sCHD), including a subset of critical CHD: hypoplastic left heart syndrome, interrupted aortic arch, pulmonary atresia/intact ventricular septum, and transposition of the great arteries. Baseline characteristics across SES and RoR groups were examined. Among secondary outcomes, continuous variables were summarized as median (interquartile range) and compared using Kruskal‐Wallis tests. Categorical variables are presented as percentages and compared using Pearson χ2 tests. Univariate logistic regression was used to examine the association between SES and RoR and mortality with results presented as odds ratios (ORs) with 95% CIs.
Separate multivariable logistic regression models examined relationships between SES and RoR and mortality adjusted for PTB, LBW, and the presence of 1 or more ECA (collectively, noncardiac mediators). The latter variables were chosen given their known contribution to worse outcomes in CHD, 5 and the findings of differences among SES and RoR categories in our population. In addition, we constructed a multivariable model to assess mortality among those residing in the extremes of RoR and SES with 5 categories: highest SES and nearest RoR (reference), highest SES and farthest RoR, lowest SES and nearest RoR, lowest SES and farthest RoR, and the remainder of the cohort.
We examined relationships between SES and RoR with the time from the first hospitalization to the first cardiac surgical or catheter intervention (Table S2) with Cox proportional hazards models, adjusting for noncardiac mediators. The proportional hazards assumption was visually assessed for all variables using hazard functions and Schoenfeld residuals. When the proportional hazards assumption was not met, a time‐dependent coefficient at <120 days and then ≥120 days provided adequate fit. Modeling length of stay at first intervention and hospitalization counts in the first year were performed using negative binomial regression adjusting for the noncardiac mediators.
Statistical analyses were performed using SAS 9.4 (SAS Institute, Cary, NC).
This study was approved by the University of Alberta Research Ethics Board (Pro00040008). Given the nature of the study, with deidentified administrative data provided through the Canadian Institute for Health Information, individual patient consent was not deemed necessary by the board.
RESULTS
Cohort Description
There was a total of 54 272 patients newly diagnosed with CHD in the CIHI‐DAD from 2008 to 2018. Of the 7711 infants who met inclusion criteria (Figure 1), 4485 (58.2%) had mCHD and 3226 (41.8%) sCHD, 55.4% were boys, 18.9% had PTB, 18.0% had LBW, 18.4% had major ECAs, and 12.2% had a coded genetic anomaly (Table 1). A larger proportion of infants were in the lowest (27.1%) compared with the highest (15.0%) SES category. A higher proportion of infants in the lowest SES category (30.9%) lived ≥300 km from the closest cardiac surgical center than in the highest SES (25.5%).
Figure 1. Population of infants with CHD included in the analyses.
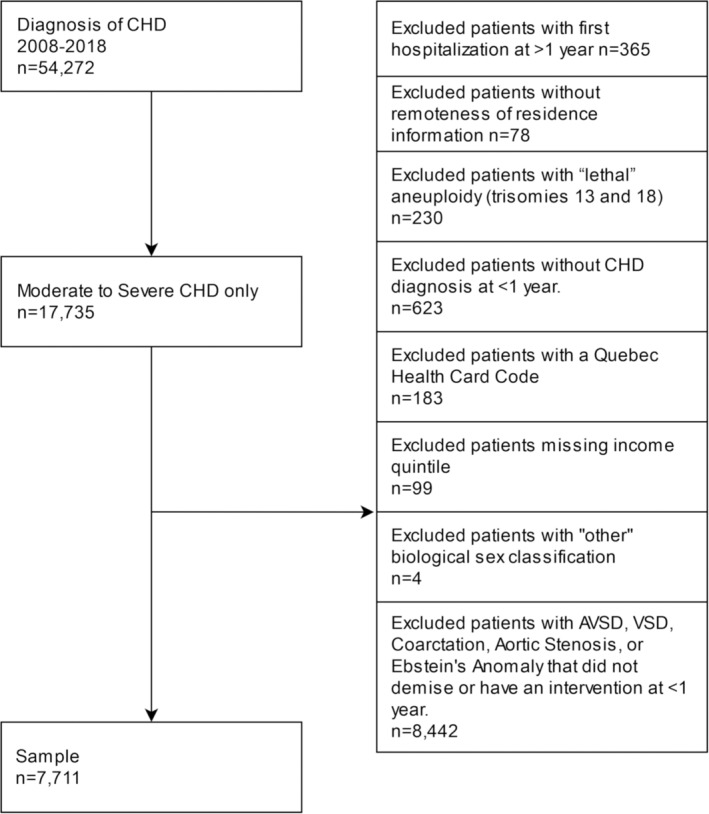
AVSD indicates atrioventricular septal defect; CHD, congenital heart disease; and VSD, ventricular septal defect.
Table 1.
Patient Characteristics by SES Quintiles
| SES quintiles | |||||||
|---|---|---|---|---|---|---|---|
| Characteristic | 1, lowest | 2 | 3 | 4 | 5, highest | Totals, % | P value* |
| Patients, n (%) | 2088 (27.1) | 1548 (20.1) | 1478 (19.2) | 1437 (18.6) | 1160 (15.0) | 7711 | |
| CHD complexity, n (%) | |||||||
| Moderate | 1194 (57.2) | 913 (59.0) | 862 (58.3) | 833 (58.0) | 683 (58.9) | 4485 (58.2) | 0.82 |
| Severe | 894 (42.8) | 635 (41.0) | 616 (41.7) | 604 (42.0) | 477 (41.1) | 3226 (41.8) | |
| Male sex | 1123 (53.8) | 849 (54.8) | 826 (55.8) | 811 (56.4) | 665 (57.3) | 4274 (55.4) | 0.30 |
| Distance to closest cardiac surgical center, n (%) | |||||||
| <100 km | 1034 (49.5) | 791 (51.1) | 819 (55.4) | 782 (54.4) | 611 (52.7) | 4037 (52.3) | <0.0001 |
| 100–299 km | 408 (19.5) | 358 (23.1) | 333 (22.5) | 289 (20.1) | 253 (21.8) | 1641 (21.3) | |
| ≥300 km | 646 (30.9) | 399 (25.8) | 326 (22.1) | 366 (25.5) | 296 (25.5) | 2033 (26.4) | |
| Birth data, n (%) | |||||||
| Preterm birth | 431 (20.6) | 321 (20.7) | 265 (17.8) | 239 (16.6) | 197 (17.0) | 1453 (18.8) | 0.005 |
| Low birth weight | 379 (18.2) | 307 (19.8) | 251 (17.0) | 245 (17.1) | 208 (17.9) | 1390 (18.0) | 0.24 |
| Nonlethal genetic syndrome | 236 (11.3) | 203 (13.1) | 173 (11.7) | 181 (12.6) | 147 (12.7) | 940 (12.2) | 0.57 |
| Extracardiac lesion | 416 (19.9) | 296 (17.7) | 242 (16.4) | 217 (15.1) | 167 (14.4) | 1338 (17.4) | 0.02 |
Values in parentheses represent percent for each SES quintile or under the totals column (% of the total). CHD indicates congenital heart disease; and SES, socioeconomic status.
χ2 test comparing proportions across SES quintiles.
When infants were categorized according to RoR, we found 52.3% lived within 100 km, 21.3% between 100 and 299 km, and 26.4% ≥300 km from a cardiac surgical center (Table 2). The mCHD and sCHD distribution differed significantly across RoR categories; among infants living closest (<100 km), 60.8% had mCHD and 39.2% had sCHD compared with 53.7% with mCHD and 46.3% with sCHD among infants living most remotely (≥300 kms). There was a decreasing trend in proportions with PTB and LBW with greater RoR, with lowest rates among infants residing ≥300 km. The greatest proportion with ECAs lived within 100 to 299 km. These findings were similar when RoR was calculated from pediatric cardiology programs (±surgical services), the only difference being that a larger proportion of infants (70.1%) lived within 100 km of a center (Table S3).
Table 2.
Patient Characteristics by RoR From the Nearest Pediatric Cardiac Surgical Center
| RoR categories | |||||
|---|---|---|---|---|---|
| Characteristic | <100 km | 100–299 km | ≥300 km | Totals, % | P value* |
| Patients, n (%) | 4037 (52.4) | 1641 (21.3) | 2033 (26.4) | 7711 | |
| CHD complexity, n (%) | |||||
| Moderate | 2453 (60.8) | 940 (57.3) | 1092 (53.7) | 4485 (58.2) | <0.0001 |
| Severe | 1584 (39.2) | 701 (42.7) | 941 (46.3) | 3226 (41.8) | |
| Male sex | 2218 (54.9) | 928 (56.6) | 1128 (55.5) | 4274 (55.4) | 0.54 |
| SES quintile, n (%) | |||||
| 1 | 1034 (25.6) | 408 (24.9) | 646 (31.8) | 2088 (27.1) | |
| 2 | 791 (19.6) | 358 (21.8) | 399 (19.6) | 1548 (20.1) | |
| 3 | 819 (20.3) | 333 (20.3) | 326 (16.0) | 1478 (19.2) | |
| 4 | 782 (19.4) | 289 (17.6) | 366 (18.0) | 1437 (18.6) | |
| 5 | 611 (15.1) | 253 (15.4) | 296 (14.6) | 1160 (15.0) | |
| Birth data, n (%) | |||||
| Preterm birth | 805 (19.9) | 315 (19.2) | 337 (16.6) | 1457 (18.9) | 0.006 |
| Low birth weight | 807 (20.0) | 307 (19.0) | 269 (13.4) | 1383 (17.9) | <0.0001 |
| Nonlethal genetic syndrome, n (%) | 498 (12.3) | 212 (12.9) | 230 (11.3) | 940 (12.2) | 0.23 |
| Extracardiac lesion, n (%) | 643 (15.9) | 381 (23.2) | 397 (19.5) | 1421 (18.4) | <0.0001 |
Values in parentheses represent percent for each RoR category or under the totals column (% of the total). CHD indicates congenital heart disease; RoR, remoteness of residence; and SES, socioeconomic status.
χ2 test comparing proportions across RoR categories.
Mortality
Overall, 812/7711 (10.5%) infants died in‐hospital within the first year, 53.0% with sCHD and 47.0% with mCHD. Mortality occurred before intervention in 446 infants, 263 (60.0%) of whom had at least 1 comorbidity (PTB, LBW, ECA, and/or a genetic syndrome). Crude mortality among infants with mCHD ranged from 10.3% in the lowest to 8.6% in the highest SES quintile (Figure 2; P=0.034), but did not differ among infants with sCHD between SES categories. Similarly, among infants with mCHD, mortality was 7.6%, 9.0%, and 10.1% across RoR categories <100 km, 100 to 299 km, and ≥300 km, respectively (P=0.044). Mortality among infants with sCHD mortality did not differ across ROR categories.
Figure 2. Mortality by SES and RoR categories among infants with moderate and severe congenital heart disease.
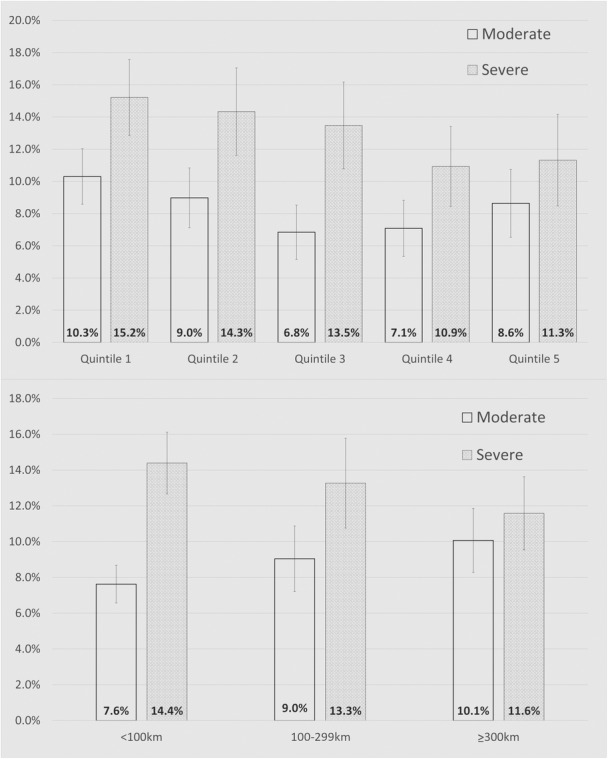
Unadjusted proportions in mortality by SES quintile (top) and RoR category (bottom). For moderate congenital heart disease, SES (P=0.034) and RoR (P=0.044) were associated with mortality, a finding not true for severe congenital heart disease (P=0.092 and P=0.13, respectively). RoR indicates remoteness of residence; and SES, socioeconomic status.
On multivariate analysis, after controlling for mediators, RoR remained associated with mortality for mCHD, where risk increased with greater remoteness (OR, 1.18 for 100–299 km; OR, 1.43 for ≥300 km; P=0.022) (Figure 3). Examining the extremes of SES and ROR (Table S4), multivariable analysis revealed greater mortality for the lowest SES patients with mCHD residing at ≥300 km (OR, 1.74; P=0.003) (Figure 4). Among those with sCHD, no differences were observed when examining extremes (P=0.22). Finally, neither SES nor RoR demonstrated an association with mortality for 1585 cases of critical CHD, or cases of hypoplastic left heart syndrome in isolation (not reported). The findings were comparable to those of sCHD.
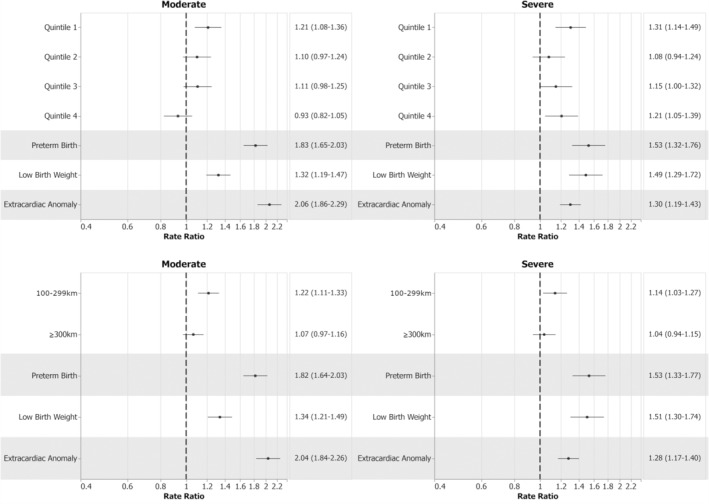
Figure 3. Multivariable analyses of the separate effects of SES and RoR on mortality.
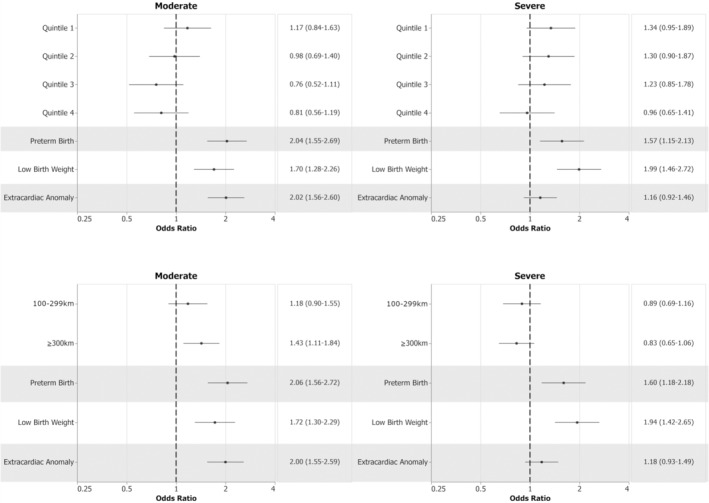
References: Quintile 5 for SES and <100 km for RoR category. Mortality was associated with covariates (preterm birth, low birth weight, extracardiac anomalies) in SES and RoR models. Mortality was associated with increasing RoR for moderate CHD (P=0.022) but not for severe CHD (P=0.31) or with SES for either complexity group (moderate CHD, P=0.066; severe CHD, P=0.18). Dotted lines indicate odds ratio and solid lines indicate 95% confidence intervals. CHD indicates congenital heart disease; RoR, remoteness of residence; and SES, socioeconomic status.
Figure 4. Multivariable model of SES quintile and RoR extremes on mortality.
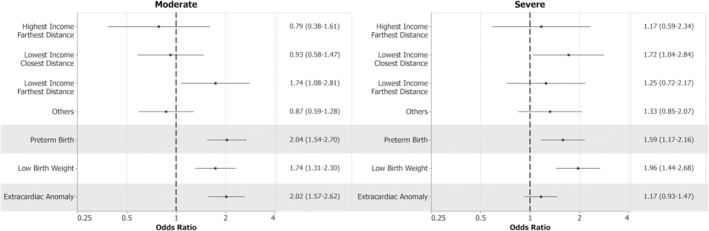
References: Quintile 5 for SES and <100 km for RoR category. Mortality was associated with the interaction of distance and income in moderate (P=0.003) but not severe congenital heart disease (P=0.22). Dotted lines indicate odds ratio and solid lines indicate 95% confidence intervals. RoR indicates remoteness of residence; and SES, socioeconomic status.
Secondary Outcomes
In univariate analysis, mCHD showed no association between SES and age at first intervention (P=0.52), whereas for sCHD, lower SES was associated with later age at first intervention (P=0.006; Table 3). On multivariable analysis for mCHD and sCHD, lower SES (adjusted hazard ratio <1) was associated with later age at first intervention (P=0.005 and P=0.004, respectively; Table 4).
Table 3.
Unadjusted Secondary Outcomes and Their Association With SES and RoR
| SES quintiles | RoR | |||||||||
|---|---|---|---|---|---|---|---|---|---|---|
| Variables | 1, lowest | 2 | 3 | 4 | 5, highest | P value* | <100 km | 100–299 km | ≥300 km | P value* |
| Moderate CHD, median (IQR) | ||||||||||
| Time to first intervention, d | 99 (16–160) | 102 (15–167) | 97 (12–158) | 104 (17–164) | 86 (11–161) | 0.52 | 113 (22–168) | 97 (16–121) | 64 (5–124) | <0.0001 |
| First hospitalization LOS, d | 10 (5–28) | 8 (5–24) | 9 (5–22) | 8 (5–19) | 9 (5–21) | 0.02 | 8 (5–19) | 11 (5–29) | 9 (5–24) | <0.0001 |
| Hospital counts | 2 (2–3) | 2 (2–3) | 2 (2–3) | 2 (2–3) | 2 (1–3) | 0.21 | 2 (2–3) | 2 (1.5–3) | 2 (1–3) | <0.0001 |
| Severe CHD, median (IQR) | ||||||||||
| Time to first intervention, d | 8 (2–35) | 7 (3–30) | 7 (2–30) | 7 (2–40) | 6 (1–18) | 0.006 | 6 (2–33) | 7 (3–30) | 7 (2–8.5) | 0.29 |
| First hospitalization LOS, d | 23 (12–46) | 20 (11–40) | 20 (11–41) | 20 (11–39) | 20 (12–34) | 0.03 | 19 (11–38) | 24 (14–44) | 20 (10–40) | <0.0001 |
| Hospital counts | 2 (1–3) | 2 (103) | 2 (1–3) | 2 (1–3) | 2 (1–3) | 0.28 | 2 (1–3) | 2 (1–3) | 2 (1–3) | 0.94 |
Hospital counts are the number of hospitalizations within the first year. CHD indicates congenital heart disease; IQR, interquartile range; LOS, length of stay; RoR, remoteness of residence; and SES, socioeconomic status.
Comparisons made across SES quintiles and RoR categories using Kruskal‐Wallis tests.
Table 4.
Proportional Hazards* Regression for the Impact of SES and RoR on Time to First Intervention
| Model | Effect | Category | Moderate | Severe | ||
|---|---|---|---|---|---|---|
| aHR (95% CI) | P value† | aHR (95% CI) | P value† | |||
| SES model | Income quintile | Quintile 1, lowest | 0.91 (0.82–1.00) | 0.005 | 0.81 (0.72–0.92) | 0.004 |
| Quintile 2 | 0.91 (0.82–1.01) | 0.90 (0.79–1.03) | ||||
| Quintile 3 | 1.06 (0.95–1.18) | 0.99 (0.87–1.13) | ||||
| Quintile 4 | 0.98 (0.88–1.09) | 0.91 (0.79–1.03) | ||||
| Quintile 5, highest | 1.00 (ref) | 1.00 (ref) | ||||
| Preterm birth | <36 wk | 0.88 (0.80–0.96) | 0.006 | 0.76 (0.66–0.88) | 0.0001 | |
| Low birth weight, <120 d | <2500 g | 0.81 (0.72–0.91) | 0.84 | 0.88 (0.76–1.02) | 0.12 | |
| Low birth weight, ≥120 d | <2500 g | 0.99 (0.87–1.12) | 0.01 | 1.06 (0.75–1.50) | ||
| Extracardiac anomaly | 1.22 (1.12–1.34) | <0.0001 | 0.93 (0.85–1.02) | 0.12 | ||
| RoR model | RoR, <120 d | <100 km | 1.00 (ref) | <0.0001 | 1.00 (ref) | <0.0001 |
| 100–299 km | 1.09 (0.98–1.22) | 1.05 (0.95–1.16) | ||||
| ≥300 km | 1.21 (1.18–1.44) | 0.71 (0.64–0.79) | ||||
| RoR, ≥120 d) | <100 km | 1.00 (ref) | <0.0001 | 1.00 (ref) | <0.0001 | |
| 100–299 km | 0.96 (0.85–1.08) | 1.00 (0.74–1.35) | ||||
| ≥300 km | 0.56 (0.49–0.63) | 0.36 (0.27–0.48) | ||||
| Preterm birth | <36 wk | 0.87 (0.79–0.96) | 0.004 | 0.77 (0.67–0.88) | 0.0002 | |
| Low birth weight | <2500 g | 0.88 (0.80–0.96) | 0.006 | 0.83 (0.72–0.96) | 0.01 | |
| Extracardiac anomaly | … | 1.21 (1.11–1.33) | <0.0001 | 0.94 (0.86–1.03) | 0.19 | |
aHR indicates adjusted hazard ratio; ref, reference; RoR, remoteness of residence; and SES, socioeconomic status.
The interpretation of the aHRs is as follows: a higher (eg, >1) aHR implies a higher likelihood at any time of receiving the intervention, meaning a shorter time to intervention; conversely, a lower aHR (<1) implies a lower likelihood at any time of receiving the intervention, meaning a longer time to intervention.
P values for income quintile and RoR represent the overall test that all categories of income quintile/RoR are the same (H0: Q1=Q2=Q3=Q4=Q5). This was chosen because we had no prior information on which categories would have significant effects in which direction.
In univariate analysis of RoR and age at first intervention, mCHD had an association of earlier age at first intervention with greater RoR (P<0.001; Table 3), whereas sCHD did not (P=0.29; Table 3). On multivariable analysis, RoR did not meet the proportionality assumption, so adjusted hazard ratios before and after 120 days were reported. In mCHD, at <120 days, increasing RoR was associated with progressively shorter times to intervention (P<0.0001), whereas for ≥120 days, those residing at ≥300 km had longer times to first intervention (P<0.0001). Among sCHD, RoR was associated with longer times to intervention in and after the first 120 days (P<0.0001 for both; Table 4).
In univariate analysis, stay at first intervention was found to be longer at lower SES in both mCHD and sCHD (P=0.02 and P=0.03, respectively), whereas RoR 100 to 299 km was associated with longer stays at first intervention (P<0.0001 for both; Table 3). After adjusting for mediators, shorter hospital stay at first intervention was associated with increasing SES in mCHD (P<0.0001), but less consistent in sCHD (P=0.0007). RoR 100 to 299 km was associated with longer stays in both mCHD (P=0.0001) and sCHD (P=0.047; Figure 5).
Figure 5. Impact of SES and RoR on hospital length of stay at first intervention.
References: Quintile 5 for SES and <100 km for RoR category. SES quintile (moderate CHD, P<0.0001; severe CHD, P<0.0007) and RoR category (moderate CHD, P=0.0001; severe CHD P=0.047) were associated with differences in length of stay at first intervention after adjusting for mediators. Dotted lines indicate rate ratio and solid lines indicate 95% confidence intervals. CHD indicates congenital heart disease; RoR, remoteness of residence; and SES, socioeconomic status.
In univariate analysis the number of hospitalizations in the first year was not associated with SES in either mCHD or sCHD (P=0.21 and P=0.28, respectively), or RoR in sCHD (P=0.94), but was associated for RoR in mCHD (P<0.0001; Table 3) After adjusting for covariates, the number of hospitalizations were fewer with increasing RoR for mCHD infants (P=0.0004; Figure 6). There were no other associations between RoR or SES and number of hospitalizations.
Figure 6. Impact of SES and RoR on hospital counts in the first year.
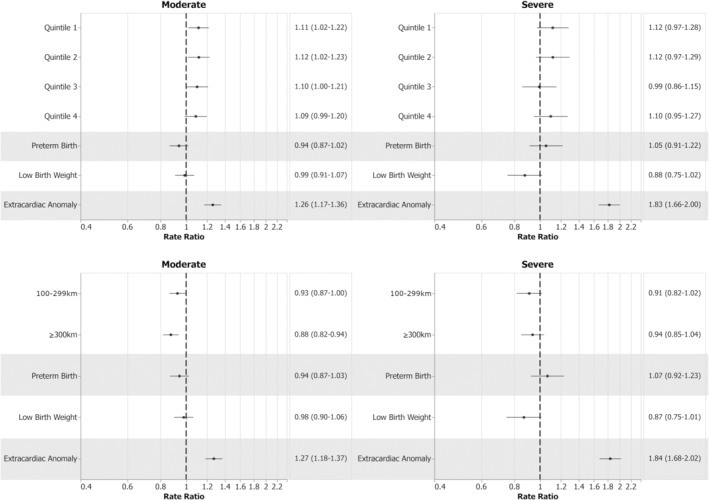
References: Quintile 5 for SES and <100 km for RoR category. RoR was associated with fewer hospital counts in the first year (P=0.0004). No other associations reached statistical significance. Dotted lines indicate rate ratio and solid lines indicate 95% confidence intervals. RoR indicates remoteness of residence; and SES, socioeconomic status.
DISCUSSION
Canada is geographically the second largest country, with a population of ≈38 million, just less than California and 56% of that of the United Kingdom. Pediatric cardiac care is provided through a hub‐and‐spoke system of care with nearly a dozen larger pediatric cardiac centers as well as smaller individual practices and 7 centralized surgical programs. We found 52.3% of the infants with major CHD reside near a centralized surgical program and 70% to a pediatric cardiac center with or without surgical services. Although Canada provides universal health care, we found disparities in clinical outcomes, especially for patients with mCHD, that likely reflect, at least in part, the challenges of having a large proportion of patients residing remotely from centralized services.
Consistent with previous reports, our study found that the association between SES and RoR and mortality was impacted by adverse birth outcomes and comorbidities including PTB, LBW, and ECAs. 14 , 15 , 16 , 17 , 18 , 19 , 20 , 21 When these were adjusted for, in general, low SES did not impact mortality. Only lower SES patients with mCHD living most remotely had higher risk of worse clinical outcomes.
Past studies have examined the impact of sociodemographic factors in CHD and shown worse outcomes in more vulnerable populations. In a systematic review and meta‐analysis of 28 publications, including 22 from the United States, increased in‐hospital, intraoperative, neonatal, postdischarge, infant, and longer‐term mortality was observed among more disadvantaged populations. 6 There was a greater effect of SES in early (neonate and infant) compared with later mortality and more so for sCHD. This has been further corroborated by the recent work of Peyvandi et al, which suggested poor socioeconomic circumstances drove increased mortality and/or unexpected hospital readmission among infants of Hispanic ethnicity with hypoplastic left heart syndrome and transposition of the great arteries residing in California. 22 In the present study, we did not find differences in mortality related to SES or RoR among infants with sCHD. This finding persisted when examining >1500 infants with certain critical CHD. Our data suggest that for infants with sCHD in the Canadian health care system, hospital mortality is not impacted negatively by lower SES or greater RoR.
Lack of mortality differences for Canadian infants with sCHD could be attributed to less discrepant rates of prenatal diagnosis for CHD among SES quintiles. In the multicenter study of Krishnan et al 8 and other investigations, 23 , 24 , 25 lower rates of prenatal diagnosis were observed among socioeconomically disadvantaged populations in the United States. In contrast, this has not been observed among Canadians. 8 , 13 In Canada, once in the cardiac health care system, whether identified prenatally or as newborns, and following hospital discharge, infants with sCHD would have frequent outpatient surveillance, most often in centralized pediatric cardiac centers or affiliated outreach clinics. More remotely residing patients might even be relocated to temporarily reside in closer proximity to central cardiac services until they are not of such high acuity and can return to their home community. Because we could only examine in‐hospital mortality, selection bias could have occurred with lack of inclusion of infants who died before a CHD diagnosis. However, studies incorporating data from provincial registries and medical examiner files suggest the latter to be rare and not likely to have significantly impacted our findings. 26 , 27 , 28 Furthermore, recent data for CHD across Alberta from 2005 to 2017 suggest out‐of‐hospital deaths in the first year to represent ≈7% of all deaths in this population (unpublished data), and thus, in‐hospital mortality should capture the majority.
We found patients with mCHD who lived the furthest from centralized surgical institutions had higher mortality. Differences in findings for mCHD compared with sCHD could be explained, at least in part, by discrepant prenatal detection between CHD subgroups. The majority of 4‐chamber view abnormalities (eg, hypoplastic left heart syndrome, single ventricles 29 , 30 , 31 ), and more recently certain outlet lesions 32 detected at obstetrical ultrasound, are diagnosed prenatally. However, isolated ventricular septal defects and aortic coarctation without more complex left heart obstruction, representing >50% of moderate CHDs, are among the more challenging to detect prenatally. 33 , 34 , 35 Without prenatal detection, diagnoses may be delayed, especially if more remotely residing families cannot easily access pediatric care. Although most of the centralized cardiology services across Canada have outreach clinics to service remote communities, these clinics, which support between 10% and 30% of our patients residing >100 km from the centers, are not likely available with the same frequency for new consultations and surveillance as clinics within the centers themselves. Some patients in the ≥ 300 km group live much farther away as well. Such patients are often dependent on air travel from small northern communities to access outreach clinics, and face significant hurdles in travel to surgical centers even when clinical deterioration occurs. For centers without surgical or interventional services, an additional delay in referral for intervention could increase risks related to the CHD. Our findings could also reflect delays in referral and scheduling of patients with lower acuity CHD for elective intervention, which may be more prevalent in a system with publicly funded centralized interventional/surgical resources. Those of lowest SES residing most remotely may be a particularly vulnerable population, because they would have fewer personal resources to ensure sufficient surveillance. These findings could prompt changes in our surveillance practice and intervention timing for patients with lower acuity mCHD residing more remotely.
We investigated other measures of care and morbidity to elucidate differences not reflected by mortality. When adjusted for comorbidities, time to first intervention was inversely related to SES and was greater for those with sCHD living most remotely. For mCHD, earlier intervention at <120 days was associated with increased RoR, whereas at ≥120 days, interventions occurred later in the most remote group. This could be explained by the broad spectrum of disease acuity represented among mCHD. The more severe end of disease (eg, severe tetralogy of Fallot or critical coarctation of the aorta including other left heart obstruction) may be more likely diagnosed earlier, even prenatally, and referred more efficiently for intervention. Some may also have associated genetic or extracardiac diagnoses facilitating earlier diagnoses with prioritized referrals from remote communities. In contrast, the less severe spectrum (eg, large ventricular septal defect, isolated coarctation) and those without associated extracardiac disease may be among the patients with delays in diagnosis or represent lower acuity cases, where less frequent surveillance and delays in scheduling and rescheduling are most common in our practice. There are many potential contributors to delays in time to first intervention, including delays in diagnosis and referral, comorbidities and prenatal exposures not examined, family/parental decisions, and system issues, that could result in those of higher SES and residing less remotely receiving intervention sooner. In Canada, many patients with CHD are referred for surgery from nonsurgical centers ≥300 km away, potentially contributing to later interventions associated with interprovincial and interhospital transfers. Lengthier hospital stays, observed in lower SES quintiles and patients living more remotely, may also reflect later referrals among patients from outside centers, worse condition at presentation, or strategies to reduce readmissions for such patients once returning to their communities. Finally, we found the number of hospitalizations in the first year to not differ when adjusted across SES for both CHD groups, a finding supported by previous Canadian work across a larger CHD spectrum, 36 but in contrast with findings in US regions. 22 Interestingly, greater RoR was associated with fewer hospitalizations for mCHD, a finding that could reflect differences in access to care and resource availability for such patients, and may have contributed to discrepant mortality. Further work is necessary to understand the nature of these discrepancies to ensure equity in care across our population.
Strengths and Limitations
This population study has provided insight into the potential strengths of universal health care for socioeconomically and geographically challenged populations with CHD requiring intervention in infancy. It has also elucidated areas requiring further exploration and the development of strategies to reduce outcome discrepancies.
While providing population data, this investigation had several limitations. The CIHI‐DAD does not provide data for patients cared for in Quebec, representing ≈24% of the Canadian population. We were unable to examine out‐of‐hospital deaths and could have, as such, underestimated overall mortality; however, as alluded to previously, out‐of‐hospital mortality likely represents a small proportion of cases. We were also unable to examine cause of death; therefore, death may not have been consistently attributable to the cardiac diagnosis. Our use of classifications of moderate and severe, applied previously in adult CHD populations, may not have captured all CHD appropriately. For instance, neonatal Ebstein anomaly represents a more severe spectrum than encountered in adults; however, the small numbers were not likely to have impacted our findings. The CIHI‐DAD could not decipher critical versus noncritical lesions among CHD subtypes such as tetralogy of Fallot and coarctation of the aorta. We had no access to exact timing of diagnosis, which would have provided further clarity on the lack of findings for sCHD. Reliance on discharge diagnoses may have resulted in lack of capture of the true proportion with genetic syndromes. SES was measured at a neighborhood level using household income, not accounting for other aspects of social deprivation; however, in a recent study in Manitoba examining SES score performance across 20 pediatric outcome measures, income quintile performed comparably to more comprehensive scores of social vulnerability including the Pampalon Index and Socioeconomic Factor Index‐Version 2. 37 Finally, RoR was measured using an “as the crow flies approach,” which does not account for modes of or access to public transportation, and was not examined as a continuous variable.
CONCLUSIONS
In Canada, mortality for CHD requiring intervention in infancy is most impacted by PTB, LBW, and ECAs. When adjusted for, however, mortality is higher only among patients with mCHD living remotely from centralized pediatric cardiac services. In contrast, SES has less of an impact on mortality for infant CHD, even for those with more severe pathology, except for the population of lowest SES with mCHD who reside most remotely from cardiac services. For both mCHD and sCHD, we observed later time to first intervention and lengthier hospital stays among lower SES and modest RoR categories, suggesting these factors do impact care provided and resources used. Future work at a provincial level and/or in other jurisdictions with universal health care is required to confirm these findings and elucidate modifiable factors contributing to mortality, particularly among infants with mCHD residing most remotely. Furthermore, geo‐mapping of hot spots of regions with higher rates of CHD mortality may provide targets for further exploration of contributing factors and lead to strategies to improve care and consequently clinical outcomes.
Sources of Funding
The study was funded as part of Dr Kaul's Heart and Stroke Foundation Chair. The foundation had no input into the design, analysis, or interpretation.
Disclosures
None.
Supporting information
Tables S1–S4
Acknowledgments
Parts of this material are based on data and information provided by the Canadian Institute for Health Information. However, the analyses, conclusions, opinions, and statements expressed herein are those of the authors and not those of the Canadian Institute for Health Information. Dr Kaul holds a Canadian Institutes of Health Research Sex and Gender Science Chair and a Heart and Stroke Foundation Chair in Cardiovascular Research.
O. Olugbuyi and C. Smith contributed equally as co–first authors.
For Sources of Funding and Disclosures, see page 12.
REFERENCES
- 1. Irvine B, Luo W, León JA. Congenital anomalies in Canada 2013: a perinatal health surveillance report by the Public Health Agency of Canada's Canadian perinatal surveillance system. Health Promot Chronic Dis Prev Can. 2015;35:21–22. doi: 10.24095/hpcdp.35.1.04 [DOI] [PMC free article] [PubMed] [Google Scholar]
- 2. Dolk H, Loane M, Garne E. Congenital heart defects in Europe: prevalence and perinatal mortality, 2000 to 2005. Circulation. 2011;123:841–849. doi: 10.1161/CIRCULATIONAHA.110.958405 [DOI] [PubMed] [Google Scholar]
- 3. Liu Y, Chen S, Zuhike L, Black GC, Choy M‐K, Li N, Keavney BD. Global birth prevalence of congenital heart defects 1970‐2017: updated systematic review and meta‐analysis of 260 studies. Int J Epidemiol. 2019;48:455–463. doi: 10.1093/ije/dyz009 [DOI] [PMC free article] [PubMed] [Google Scholar]
- 4. Zimmerman MS, Smith AGC, Sable CA, Echko MM, Wilner LB, Olsen HE, Atalay HT, Awasthi A, Bhutta ZA, Boucher JL, et al. Global, regional, and national burden of congenital heart disease, 1990–2017: a systematic analysis for the global burden of disease study 2017. Lancet Child Adolesc Heal. 2020;4:185–200. doi: 10.1016/S2352-4642(19)30402-X [DOI] [PMC free article] [PubMed] [Google Scholar]
- 5. Kucik JE, Nembhard WN, Donohue P, Devine O, Wang Y, Minkovitz CS, Burke T. Community socioeconomic disadvantage and the survival of infants with congenital heart defects. Am J Public Health. 2014;104:e150–e157. doi: 10.2105/AJPH.2014.302099 [DOI] [PMC free article] [PubMed] [Google Scholar]
- 6. Best KE, Vieira R, Glinianaia SV, Rankin J. Socio‐economic inequalities in mortality in children with congenital heart disease: a systematic review and meta‐analysis. Paediatr Perinat Epidemiol. 2019;33:291–309. doi: 10.1111/ppe.12564 [DOI] [PubMed] [Google Scholar]
- 7. Rickets T. Institute of medicine (US) Committee on guidance for designing a national healthcare disparities report. In: Swift EK, ed. Guidance for the National Healthcare Disparities Report. National Academies Press (US); 2002. https://www.ncbi.nlm.nih.gov/books/NBK221046/ [PubMed] [Google Scholar]
- 8. Krishnan A, Jacobs MB, Morris SA, Peyvandi S, Bhat A, Chelliah A, Chiu J, Cuneo B, Freire G, Hornberger LK, et al. Impact of socioeconomic status, race and ethnicity, and geography on prenatal detection of hypoplastic left heart syndrome and transposition of the great arteries. Circulation. 2021;143:2049–2060. doi: 10.1161/CIRCULATIONAHA.120.053062 [DOI] [PMC free article] [PubMed] [Google Scholar]
- 9. Eckersley L, Sadler L, Parry E, Finucane K, Gentles T. Timing of diagnosis affects mortality in critical congenital heart disease. Arch Dis Child. 2016;101:516–520. doi: 10.1136/archdischild-2014-307691 [DOI] [PubMed] [Google Scholar]
- 10. Fixler DE, Xu P, Nembhard WN, Ethen MK, Canfield MA. Age at referral and mortality from critical congenital heart disease. Pediatrics. 2014;134:e98–e105. doi: 10.1542/peds.2013-2895 [DOI] [PubMed] [Google Scholar]
- 11. Webb GD, Williams RG. 32nd Bethesda conference: care of the adult with congenital heart disease. J Am Coll Cardiol. 2001;37:1162–1165. doi: 10.1016/S0735-1097(01)01279-7 [DOI] [PubMed] [Google Scholar]
- 12. Statistics Canada . Table 36‐10‐0101‐01 Distributions of household economic accounts, number of households, by income quintile and by socio‐demographic characteristic. doi: 10.25318/3610010101-eng [DOI]
- 13. Kaur A, Hornberger LK, Fruitman D, Ngwezi D, Eckersley LG. Impact of location of residence and socioeconomic status impacts rate and timing of prenatal detection of major congenital heart disease in a jurisdiction of universal health coverage. Ultrasound Obstetr Gynecol. 2022, in press. doi: 10.1002/uog.26030 [DOI] [PubMed] [Google Scholar]
- 14. Best KE, Tennant PWG, Rankin J. Survival, by birth weight and gestational age, in individuals with congenital heart disease: a population‐based study. J Am Heart Assoc. 2017;6:e005213. doi: 10.1161/JAHA.116.005213 [DOI] [PMC free article] [PubMed] [Google Scholar]
- 15. Costello JM, Pasquali SK, Jacobs JP, He X, Hill KD, Cooper DS, Backer CL, Jacobs ML. Gestational age at birth and outcomes after neonatal cardiac surgery: an analysis of the society of thoracic surgeons congenital heart surgery database. Circulation. 2014;129:2511–2517. doi: 10.1161/CIRCULATIONAHA.113.005864 [DOI] [PMC free article] [PubMed] [Google Scholar]
- 16. Costello JM, Polito A, Brown DW, McElrath TF, Graham DA, Thiagarajan RR, Bacha EA, Allan CK, Cohen JN, Laussen PC. Birth before 39 weeks' gestation is associated with worse outcomes in neonates with heart disease. Pediatrics. 2010;126:277–284. doi: 10.1542/peds.2009-3640 [DOI] [PubMed] [Google Scholar]
- 17. Słodki M, Soroka M, Rizzo G, Respondek‐Liberska M, International prenatal cardiology collaboration group . Prenatal atrioventricular septal defect (AVSD) as a planned congenital heart disease with different outcome depending on the presence of the coexisting extracardiac abnormalities (ECA) and/or malformations (ECM). J Matern Fetal Neonatal Med. 2020;33:2635–2641. doi: 10.1080/14767058.2018.1556254 [DOI] [PubMed] [Google Scholar]
- 18. Sochet AA, Ayers M, Quezada E, Braley K, Leshko J, Amankwah EK, Quintessenza JA, Jacobs JP, Dadlani G. The importance of small for gestational age in the risk assessment of infants with critical congenital heart disease. Cardiol Young. 2013;23:896–904. doi: 10.1017/S1047951113001960 [DOI] [PMC free article] [PubMed] [Google Scholar]
- 19. Gaynor JW, Parry S, Moldenhauer JS, Simmons RA, Rychik J, Ittenbach RF, Russell WW, Zullo E, Ward JL, Nicolson SC, et al. The impact of the maternal‐foetal environment on outcomes of surgery for congenital heart disease in neonates. Eur J Cardiothorac Surg. 2018;54:348–353. doi: 10.1093/ejcts/ezy015 [DOI] [PMC free article] [PubMed] [Google Scholar]
- 20. Lin AE, Pber BR, Adatia I. Congenital diaphragmatic hernia and associated cardiovascular malformations: type, frequency and impact on management. Am J Med Genet C Semin Med Genet. 2007;145:201–216. doi: 10.1002/ajmg.c.30131 [DOI] [PMC free article] [PubMed] [Google Scholar]
- 21. Norman M, Håkansson S, Kusuda S, Vento M, Lehtonen L, Reichman B, Darlow BA, Adams M, Bassler D, Isayama T, et al. International network for evaluation of outcomes in neonates (iNeo) investigators neonatal outcomes in very preterm infants with severe congenital heart defects: an international cohort study. J Am Heart Assoc 2020;9:e015369, doi: 10.1161/JAHA.119.015369. [DOI] [PMC free article] [PubMed] [Google Scholar]
- 22. Peyvandi S, Baer RJ, Moon‐Grady AJ, Oltman SP, Chambera CD, Norton ME, Rajagopal S, Ryckman KK, Jelliffe‐Pawlowski LL, Steurer MA. Socioeconomic mediators of racial and ethnic disparities in congenital heart disease outcomes: a population‐based study in California. J Am Heart Assoc. 2018;7:e010342. doi: 10.1161/JAHA.118.010342 [DOI] [PMC free article] [PubMed] [Google Scholar]
- 23. Peiris V, Singh TP, Tworetzky W, Chong EC, Gauvreau K, Brown DW. Association of socioeconomic position and medical insurance with fetal diagnosis of critical congenital heart disease. Circ Cardiovasc Qual Outcomes. 2009;2:354–360. doi: 10.1161/CIRCOUTCOMES.108.802868 [DOI] [PubMed] [Google Scholar]
- 24. Hill GD, Block JR, Tanem JB, Frommelt MA. Disparities in the prenatal detection of critical congenital heart disease. Prenat Diagn. 2015;35:859–863. doi: 10.1002/pd.4622 [DOI] [PMC free article] [PubMed] [Google Scholar]
- 25. Quartermain MD, Pasquali SK, Hill KD, Goldberg DJ, Huhta JC, Jacobs JP, Jacobs ML, Kim S, Ungerleider RM. Variation in prenatal diagnosis of congenital heart disease in infants. Pediatrics. 2015;136:e378–e385. doi: 10.1542/peds.2014-3783 [DOI] [PMC free article] [PubMed] [Google Scholar]
- 26. Nagata H, Glick L, Lougheed L, Grattan M, Mondal T, Thakur V, Schwartz SM, Jaeggi E. Prenatal diagnosis of transposition of the great arteries reduces postnatal mortality: a population‐based study. Can J Cardiol. 2020;36:1592–1597. doi: 10.1016/j.cjca.2020.01.010 [DOI] [PubMed] [Google Scholar]
- 27. Houshmandi MM, Eckersley L, Fruitman D, Mills L, Hornberger LK. Fetal diagnosis is associated with improved perioperative condition of neonates requiring surgical intervention for coarctation. Pediatr Cardiol. 2021;42:1504–1511. doi: 10.1007/s00246-021-02634-w [DOI] [PubMed] [Google Scholar]
- 28. Mukerji A, Shafey A, Jain A, Cohen E, Shah PS, Sander B, Shah V. Pulse oximetry screening for critical congenital heart defects in Ontario, Canada: a cost‐effectiveness analysis. Can J Public Health. 2020;111:804–811. doi: 10.17269/s41997-019-00280-7 [DOI] [PMC free article] [PubMed] [Google Scholar]
- 29. Trines J, Fruitman D, Zuo KJ, Smallhorn JS, Hornberger LK, Mackie AS. Effectiveness of prenatal screening for congenital heart disease: assessment in a jurisdiction with universal access to health care. Can J Cardiol. 2013;29:879–885. doi: 10.1016/j.cjca.2013.04.028 [DOI] [PubMed] [Google Scholar]
- 30. Lytzen R, Vejlstrup N, Bjerre J, Petersen OB, Leenskjold S, Dodd JK, Jorgensen FS, Sondergaard L. Live‐born major congenital heart disease in Denmark: incidence, detection rate, and termination of pregnancy rate from 1996 to 2013. JAMA Cardiol. 2018;3:829–837. doi: 10.1001/jamacardio.2018.2009 [DOI] [PMC free article] [PubMed] [Google Scholar]
- 31. Evans W, Castillo Rollins R, Luna C, Kip K, Ludwick J, Madan N, Ciccolo M, Galindo A, Rothman A, et al. Moving towards universal prenatal detection of critical congenital heart disease in southern Nevada: a community‐wide program. Pediatr Cardiol. 2015;36:281–288. doi: 10.1007/s00246-014-0996-1 [DOI] [PubMed] [Google Scholar]
- 32. Ravi P, Mills L, Fruitman D, Savard W, Colen T, Khoo NS, Serrano‐Lomelin J, Hornberger LK. Population trends in prenatal detection of transposition of great arteries: impact of obstetric screening ultrasound guidelines. Ultrasound Obstet Gynecol. 2018;51:659–664. doi: 10.1002/uog.17496 [DOI] [PubMed] [Google Scholar]
- 33. Durand I, Deverriere G, Thill C, Lety AS, Parrod C, David N, Barre E, Hazelzet T. Prenatal detection of coarctation of the aorta in a non‐selected population: a prospective analysis of 10 years of experience. Pediatr Cardiol. 2015;36:1248–1254. doi: 10.1007/s00246-015-1153-1 [DOI] [PubMed] [Google Scholar]
- 34. Hornberger LK, Eckersley LG. Aortic coarctation: the fetal cardiologist's achilles heel. Circ Cardiovasc Imaging. 2021;14:e012877. doi: 10.1161/CIRCIMAGING.121.012877 [DOI] [PubMed] [Google Scholar]
- 35. van Nisselrooij AEL, Teunissen AKK, Clur SA, Rozendaal L, Pajkrt E, Linskens IH, Rammeloo L, van Lith JMM, Blom NA, Haak MC. Why are congenital heart defects being missed? Ultrasound Obstet Gynecol. 2020;55:747–757. doi: 10.1002/uog.20358 [DOI] [PMC free article] [PubMed] [Google Scholar]
- 36. Islam S, Yasui Y, Kaul P, Mackie AS. Hospital readmission of patients with congenital heart disease in Canada. Can J Cardiol. 2016;32(987):e7–e14. doi: 10.1016/j.cjca.2015.12.018 [DOI] [PubMed] [Google Scholar]
- 37. Sharma AK, Kroeker K, Chateau D, Bronwell M, Rodd CJ. Assessing childhood health outcome inequalities with area‐based socioeconomic measures: a retrospective cross‐sectional study using Manitoba population data. Pediatr Res. 2020;88:496–502. doi: 10.1038/s41390-020-0755-3 [DOI] [PubMed] [Google Scholar]
Associated Data
This section collects any data citations, data availability statements, or supplementary materials included in this article.
Supplementary Materials
Tables S1–S4