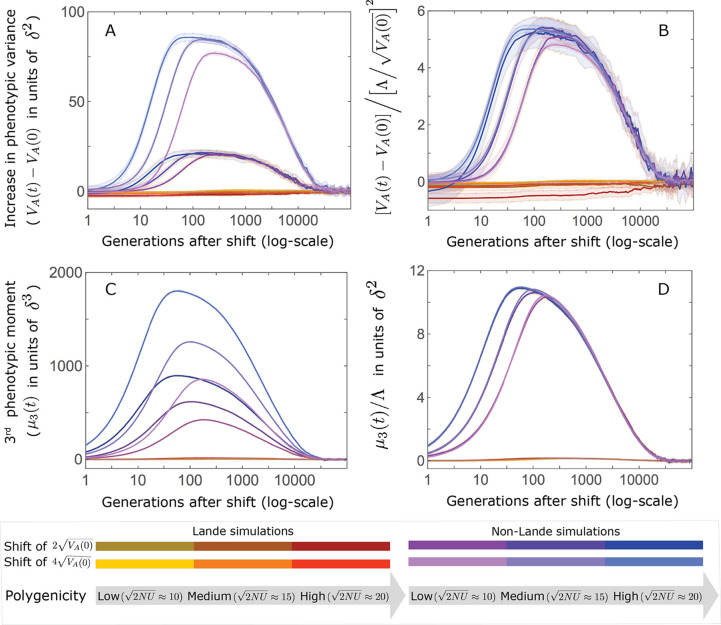
Appendix 3—figure 27. The increase in the 2nd and 3rd central moments of the phenotypic distribution.
(A and C) The increase is largely driven by alleles with large effects. Specifically, there are substantial increases only in the non-Lande cases, that is, those with an abundance of new mutations with . (B and D) We conjecture that the compound parameters that largely determine the increase in moments are: for the 2nd central moment (B) and for the 3rd. Note that the slight differences among curves in the non-Lande case are short-lived (time is measured on a log-scale). The simulation results were generated using the all allele simulation, as described in Section 2.1.

