Abstract
Objective.
Subretinal prostheses electrically stimulate the residual inner retinal neurons to partially restore vision. We investigated the changes in neurosensory macular structures and it’s thickness associated with subretinal implantation in geographic atrophy (GA) secondary to age-related macular degeneration (AMD).
Approach.
Using optical coherence tomography, changes in distance between electrodes and retinal inner nuclear layer as well as alterations in thickness of retinal layers were measured over time above and near the subretinal chip implanted within the atrophic area. Retinal thickness was quantified across the implant surface and edges as well as outside the implant zone to compare with the natural macular changes following subretinal surgery, and the natural course of dry AMD.
Main results.
GA was defined based on complete retinal pigment epithelium and outer retinal atrophy (cRORA). Based on the analysis of 3 patients with subretinal implantation, we found that the distance between the implant and the target cells was stable over the long-term follow-up. Total retinal thickness above the implant decreased on average, by 39 ±12μm during 3 months post-implantation, but no significant changes were observed after that, up to 36 months of the follow-up. Retinal thickness also changed near the temporal entry point areas outside the implantation zone following the surgical trauma of retinal detachment. There was no change in the macula cRORA nasal to the implanted zone, where there was no surgical trauma or manipulation.
Significance.
The surgical delivery of the photovoltaic subretinal implant causes minor retinal thickness changes that settle after 3 months, and then remain stable over long-term with no adverse structural or functional effects. Distance between the implant and the inner nuclear layer remains stable up to 36 months of the follow-up.
Keywords: subretinal, prosthesis, age-related macular degeneration, optical coherence tomography, retinal thickness
1. Introduction
Age-related macular degeneration (AMD) is a leading cause of irreversible vision loss, affecting more than 8.7% of the population worldwide [1]. Late-stage manifestations of AMD (neovascularization and geographic atrophy) are associated with severe visual impairment, and their prevalence dramatically increases with age [2]. Geographic atrophy, which occurs at an advanced stage of the disease, results in gradual loss of photoreceptors, retinal pigment epithelial cells and the choriocapillaris layer in the central macula and severely impairs reading and face recognition. Low-resolution peripheral vision is retained in this condition, necessitating the use of eccentric fixation. Therefore, the goal of any treatment strategy should be to provide functional central vision without jeopardizing the surrounding retina. Although photoreceptors in retinal degeneration are lost, the inner retinal neurons survive to a large extent [3–5]. Electronic retinal prostheses are designed to reintroduce visual information into the degenerate retina by electrical stimulation of the remaining neurons.
We developed a wireless prosthesis in which photovoltaic pixels directly convert projected light patterns into local electric current [6,7]. It is 2 by 2 mm in width (corresponding to approximately 7 degrees of the visual angle in a human eye), 30 μm in thickness, with 378 pixels, each of which is 100 μm in diameter (PRIMA [Pixium Vision, Paris, France]; figure 1).
Figure 1:
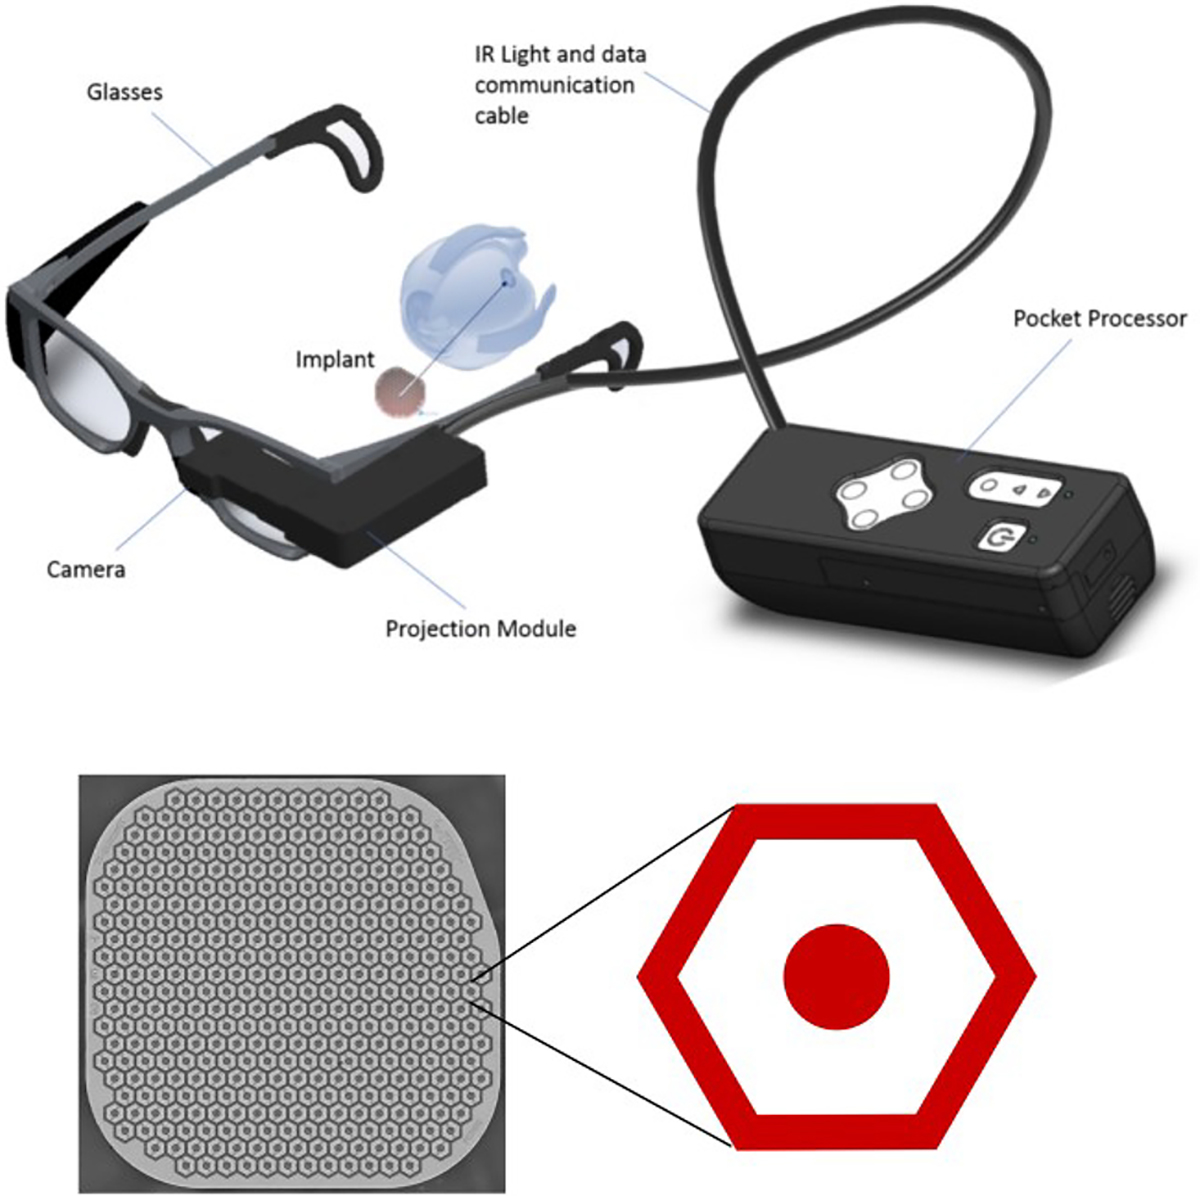
PRIMA Visual System
Images captured by the camera are processed and projected onto the retina from the augmented-reality glasses. To avoid photophobic and phototoxic effects of bright illumination, we use using near-infrared (880 nm) light [8]. Current flowing through the retina between the local active and return electrodes in each pixel stimulates the nearby inner retinal neurons [6], primarily the bipolar cells, which then pass the responses to ganglion cells, thereby harnessing some of the residual retinal signal processing [9,10].
A subretinal implant PRIMA has recently been tested in human in AMD patients [11]. Historically, in patients with retinitis pigmentosa (RP), several devices have been extensively studied, namely the epiretinal Argus II retinal prosthesis (Second Sight Medical Products, Inc., Sylmar, CA) and IRIS II (Pixium Vision, Paris, France), a subretinal implant Retina Implant Alpha IMS/AMS (Retina Implant AG, Reutlingen, Germany), and a suprachoroidal retinal prosthesis implant (Bionic Vision, Australia) [12–16].
A few studies assessed the retinal changes in the RP patients with the epiretinal Argus and suprachoroidal implants [16, 17]. The Argus implant causes progressive retinal thickening over time [17], while the suprachoroidal implants lead to swelling of the choroid increasing the electrode-retina disease [16]. Since the AMD pathophysiology is different from RP and subretinal location of the PRIMA implants differs from the epiretinal or suprachoroidal locations, it is important to assess the retinal changes with PRIMA implants and compare it to the natural course of the atrophy progression over time.
The success of retinal stimulation with micro-electrode largely depends on the distance between the stimulation electrodes and the target cells. This is even more important for bipolar electrode arrays where the return electrode is near the active electrode. Each 100 μm pixel of the PRIMA implant has a return electrode around the active (stimulation) electrode, connected in a hexagonal mesh (figure 1b). These local return electrodes confine the electric field, and hence it is important that the target cells are located close to the stimulation electrode and the distance does not significantly increase over time.
The aim of this study was to evaluate the retinal/macular structure and position of the retinal implant relative to the inner nuclear layer in the first feasibility study of the PRIMA implant. We analyzed the Spectral-Domain Optical Coherence Tomography (SD-OCT) images of three patients to measure the retinal thickness and the array-inner nuclear layer (INL) distances in this cohort of AMD patients, and evaluate any potential macular changes associated with the surgical trauma.
2. Methods
In the first-in-human clinical trial (ClinicalTrials.gov identifier, NCT03333954), five patients with geographic atrophy zone of at least 3 optic disc diameters, no foveal light perception, and best-corrected visual acuity of 20/400 to 20/1000 in the worse-seeing study eye have been implanted with a PRIMA retina implant [11,18]. The 2-mm wide, 30-μm thick chip, containing 378 pixels (each 100 μm in diameter), was implanted subretinally in the area of atrophy (absolute scotoma). Surgical procedures were performed in the Fondation Ophtalmologique A. de Rothschild (Paris, France), as described previously [11]. A complete 23-gauge vitrectomy was performed, the retina was detached temporally up to the edge of the atrophic zone with elevation of the temporal edge of atrophy. A temporal retinotomy was fashioned with scissors, and the retina was manually detached from the retinal pigment epithelium using a spatula. The implant was inserted under the neural retina using silicone-coated forceps and placed near the target location under the retina. It was then guided to the desired central location by transretinal application.
The study adhered to the tenets of the Declaration of Helsinki and received ethics committee approval from the Comité de Protection des Personnes Ile de France II and the Agence Nationale de Sécurité du Médicament et des Produits de Santé.
2.1. Assessment of the Retinal Layers Above the Implant
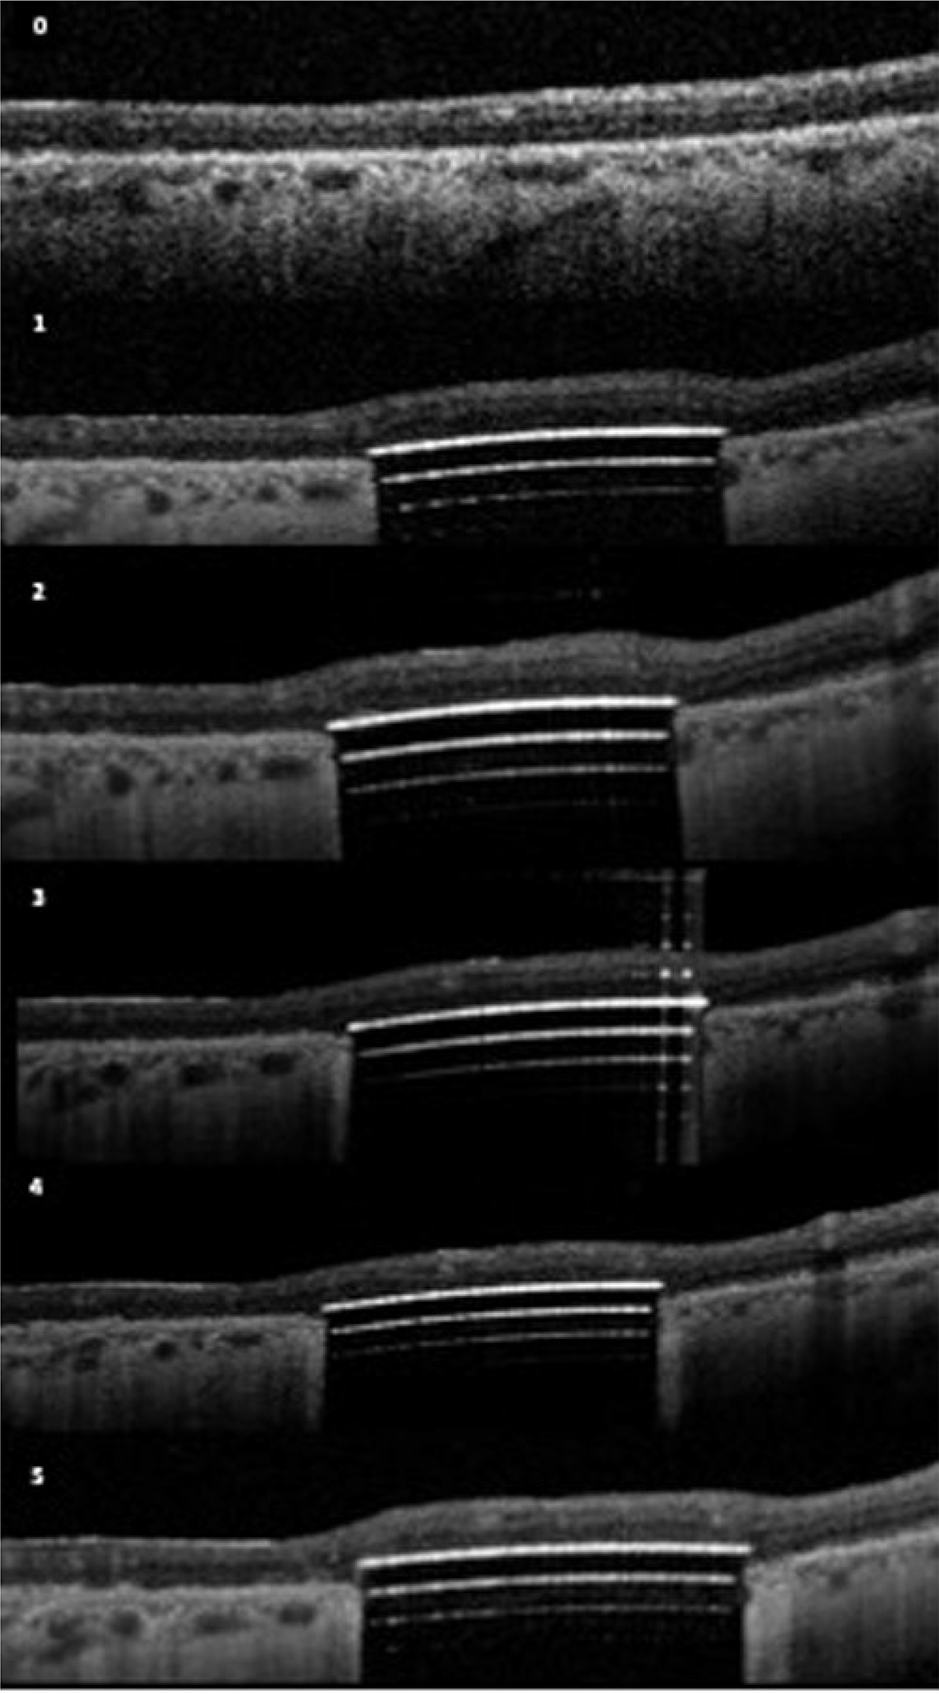
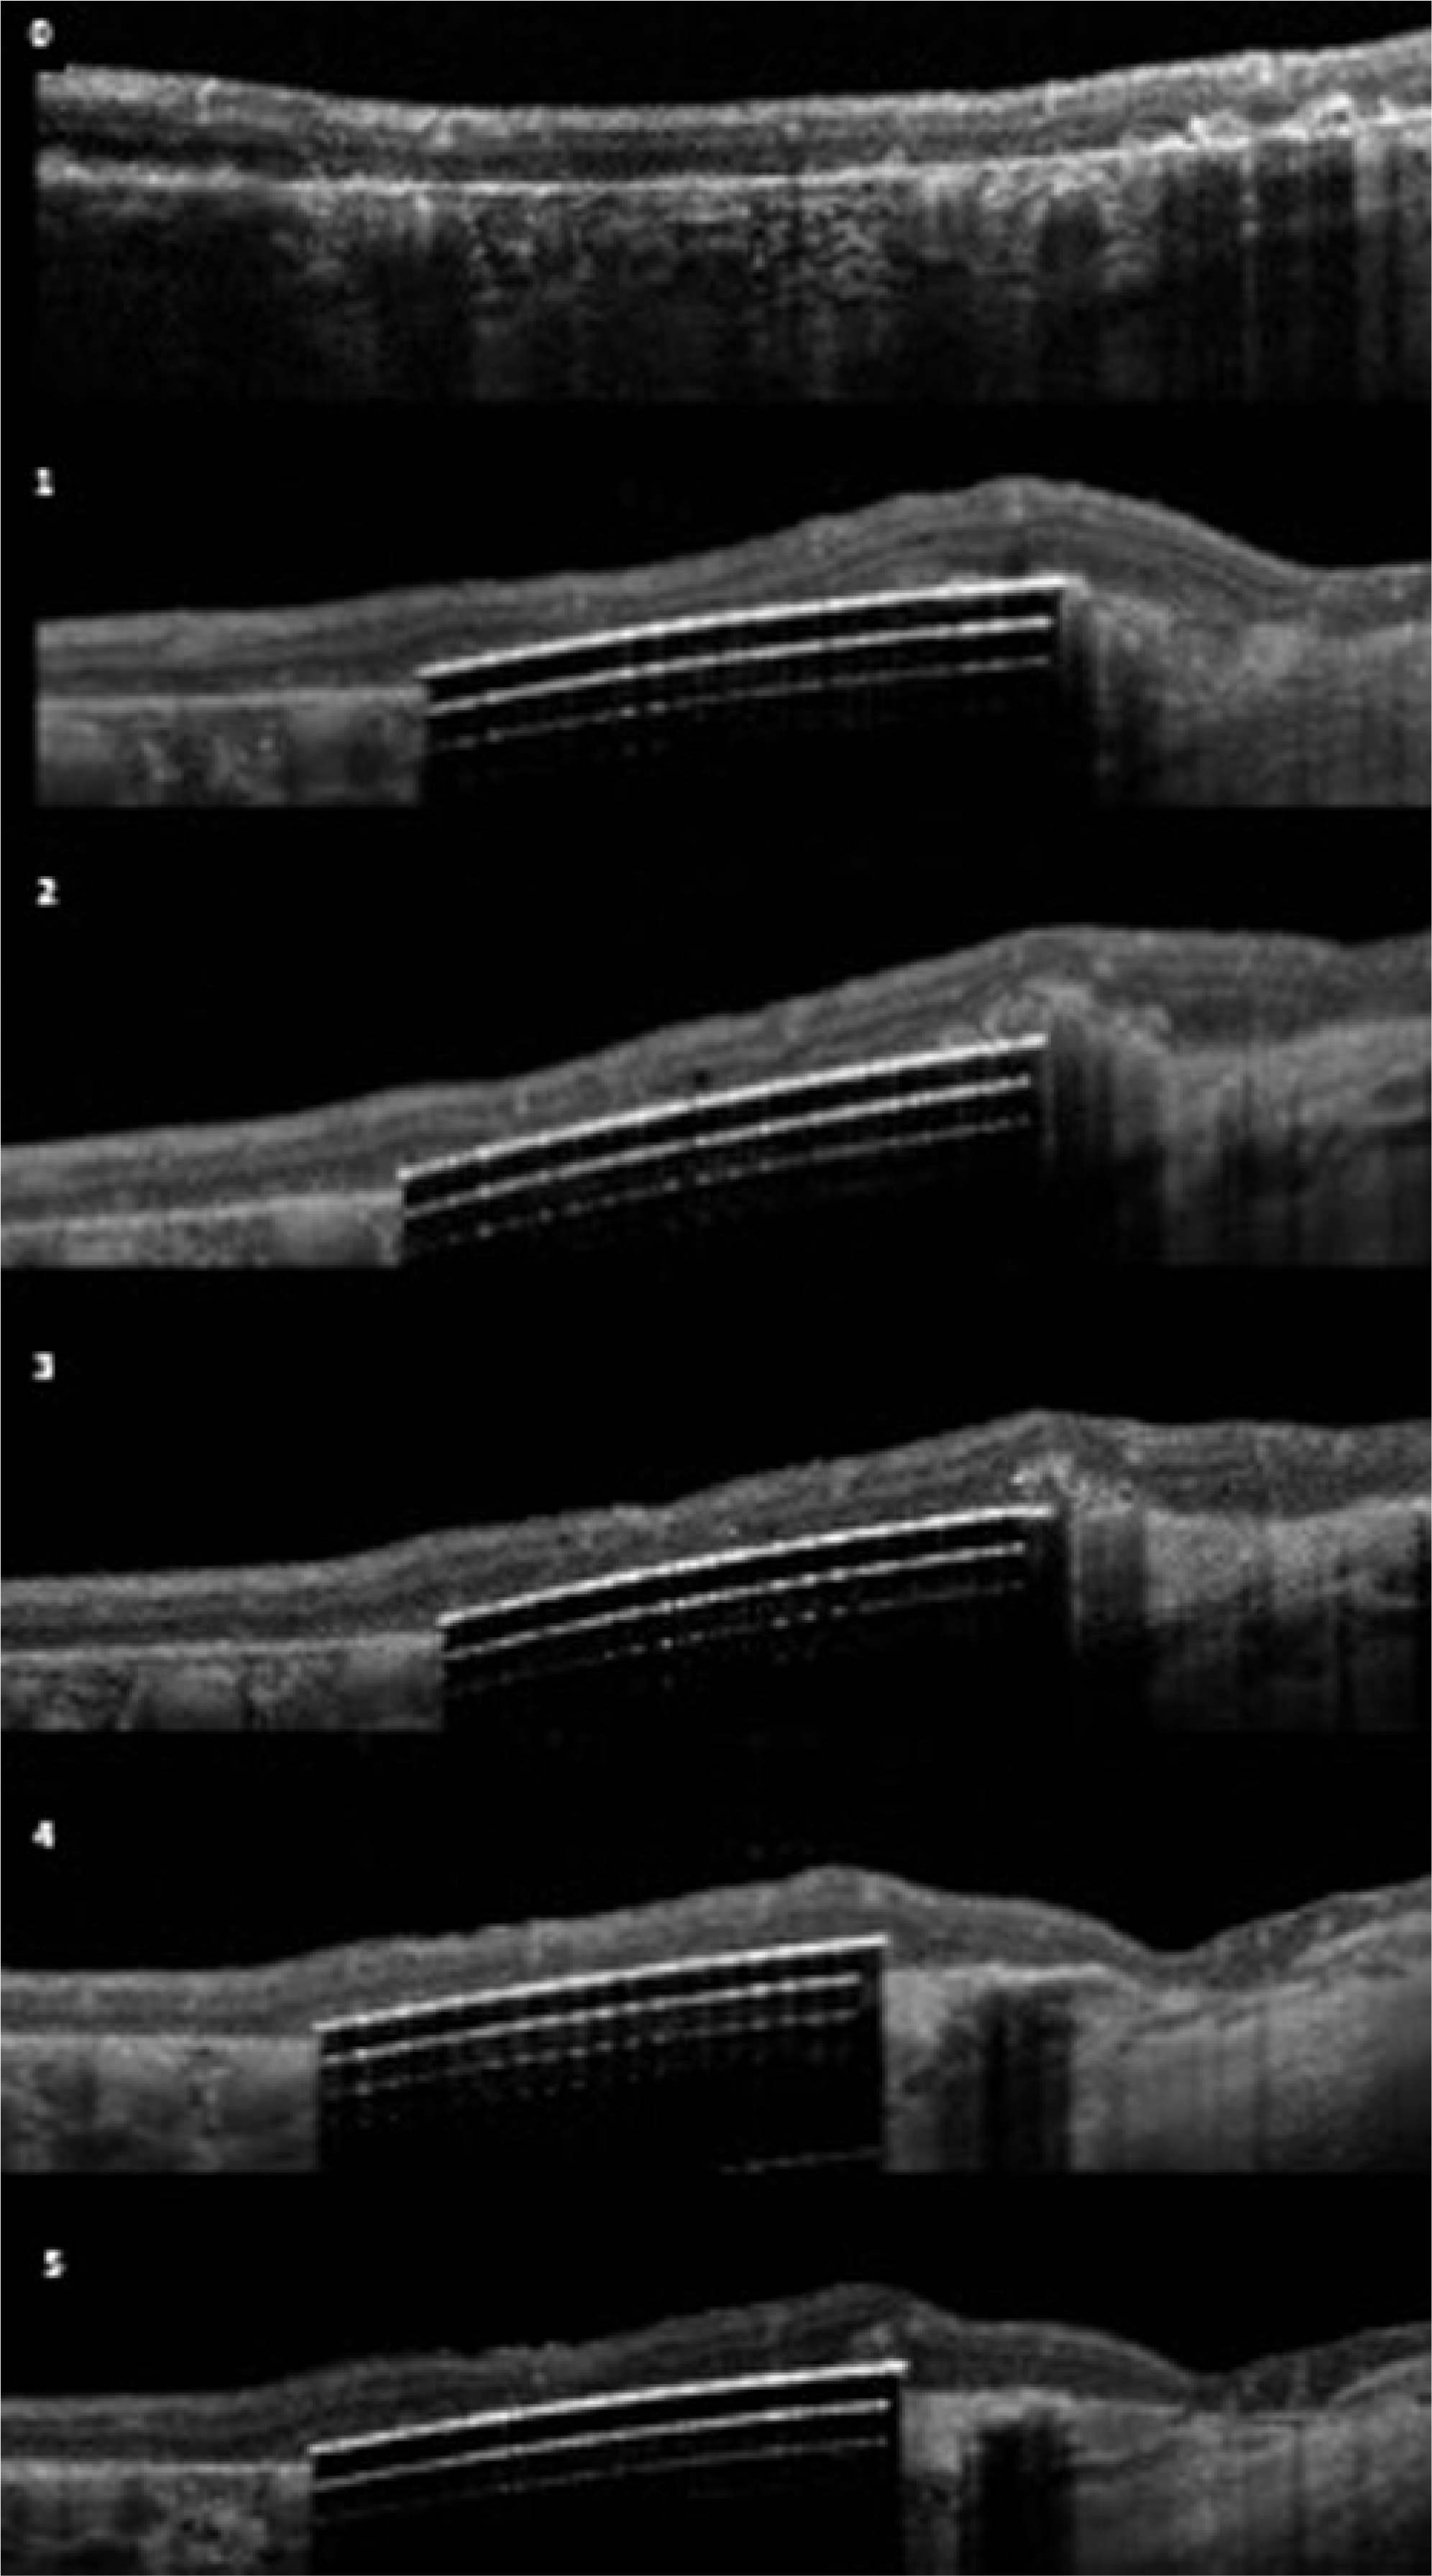
Before implantation, the area of the macula was scanned, and the baseline retinal thickness (RT) analysed in 3 out of 5 patients at baseline and at 3, 6, 12, 24 and 36 months (figure 2) post-op. The other two patients were not included because one of them died for reasons unrelated to the study, so a complete follow-up was not available, and one patient had intra-choroidal implantation and hence was excluded.
Figure 2.
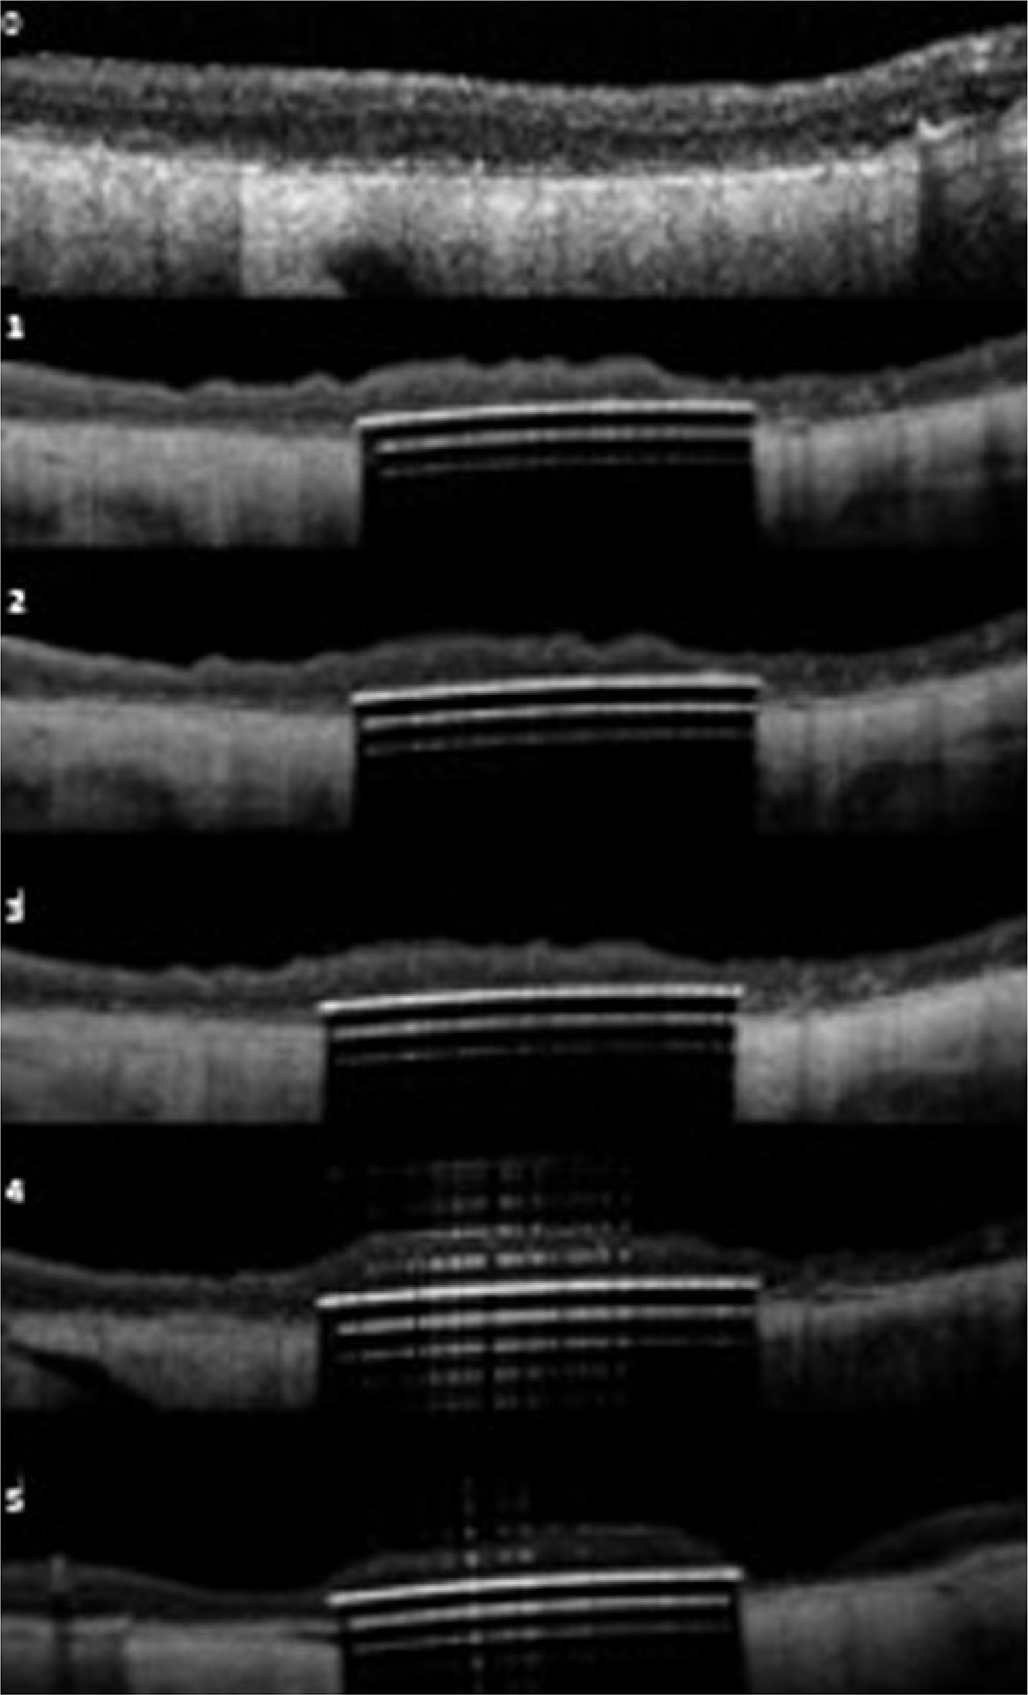
(upper): OCT images of the 3 patients over time; Patient B (upper); Patient C (middle); Patient D (lower). 0-baseline; 1=3 months; 2=6 months; 3=12 months; 4=24months; 5–36 months
(middle) OCT images of the 3 patients over time; Patient B (upper); Patient C (middle); Patient D (lower). 0-baseline; 1=3 months; 2=6 months; 3=12 months; 4=24months; 5–36months
(lower) OCT images of the 3 patients over time; Patient B (upper); Patient C (middle); Patient D (lower). 0-baseline; 1=3 months; 2=6 months; 3=12 months; 4=24months; 5–36 months
Geographic atrophy was present based on OCT and FAF imaging fulfilling the criteria of cRORA (complete retinal pigment epithelium and outer retinal atrophy) in accordance with the recently published CAM classification (19). In Figure 2, we show the baseline OCT images of the three patients with cRORA. The serial OCT images for each patient over time show the subretinal location of the retinal implant and the retina under investigation.
The area of the implant was scanned with the SD-OCT device (Spectralis, Heidelberg Engineering, Heidelberg, Germany) to verify the condition of the retina and identify the distance between its upper surface and the bottom of the INL with a cube measurement. A volume scan of 20° × 20° with 97 sections per scan was acquired with infrared and OCT using high-resolution mode.
For analysis, the 2×2 mm area of the implant was partitioned into 4×4 grid of 500×500 μm squares, thus creating 16 square sampling regions (figure 3A). The average distance between the implant and the INL was measured, as well as the average RT over the implant. In each of the 16 regions, three measurements in randomly chosen points were carried out. The mean of the three measurements was considered the average value in that region (figure 3B). The mean of the 16 regions was then computed in order to obtain the average overall value across the entire implant.
Figure 3:
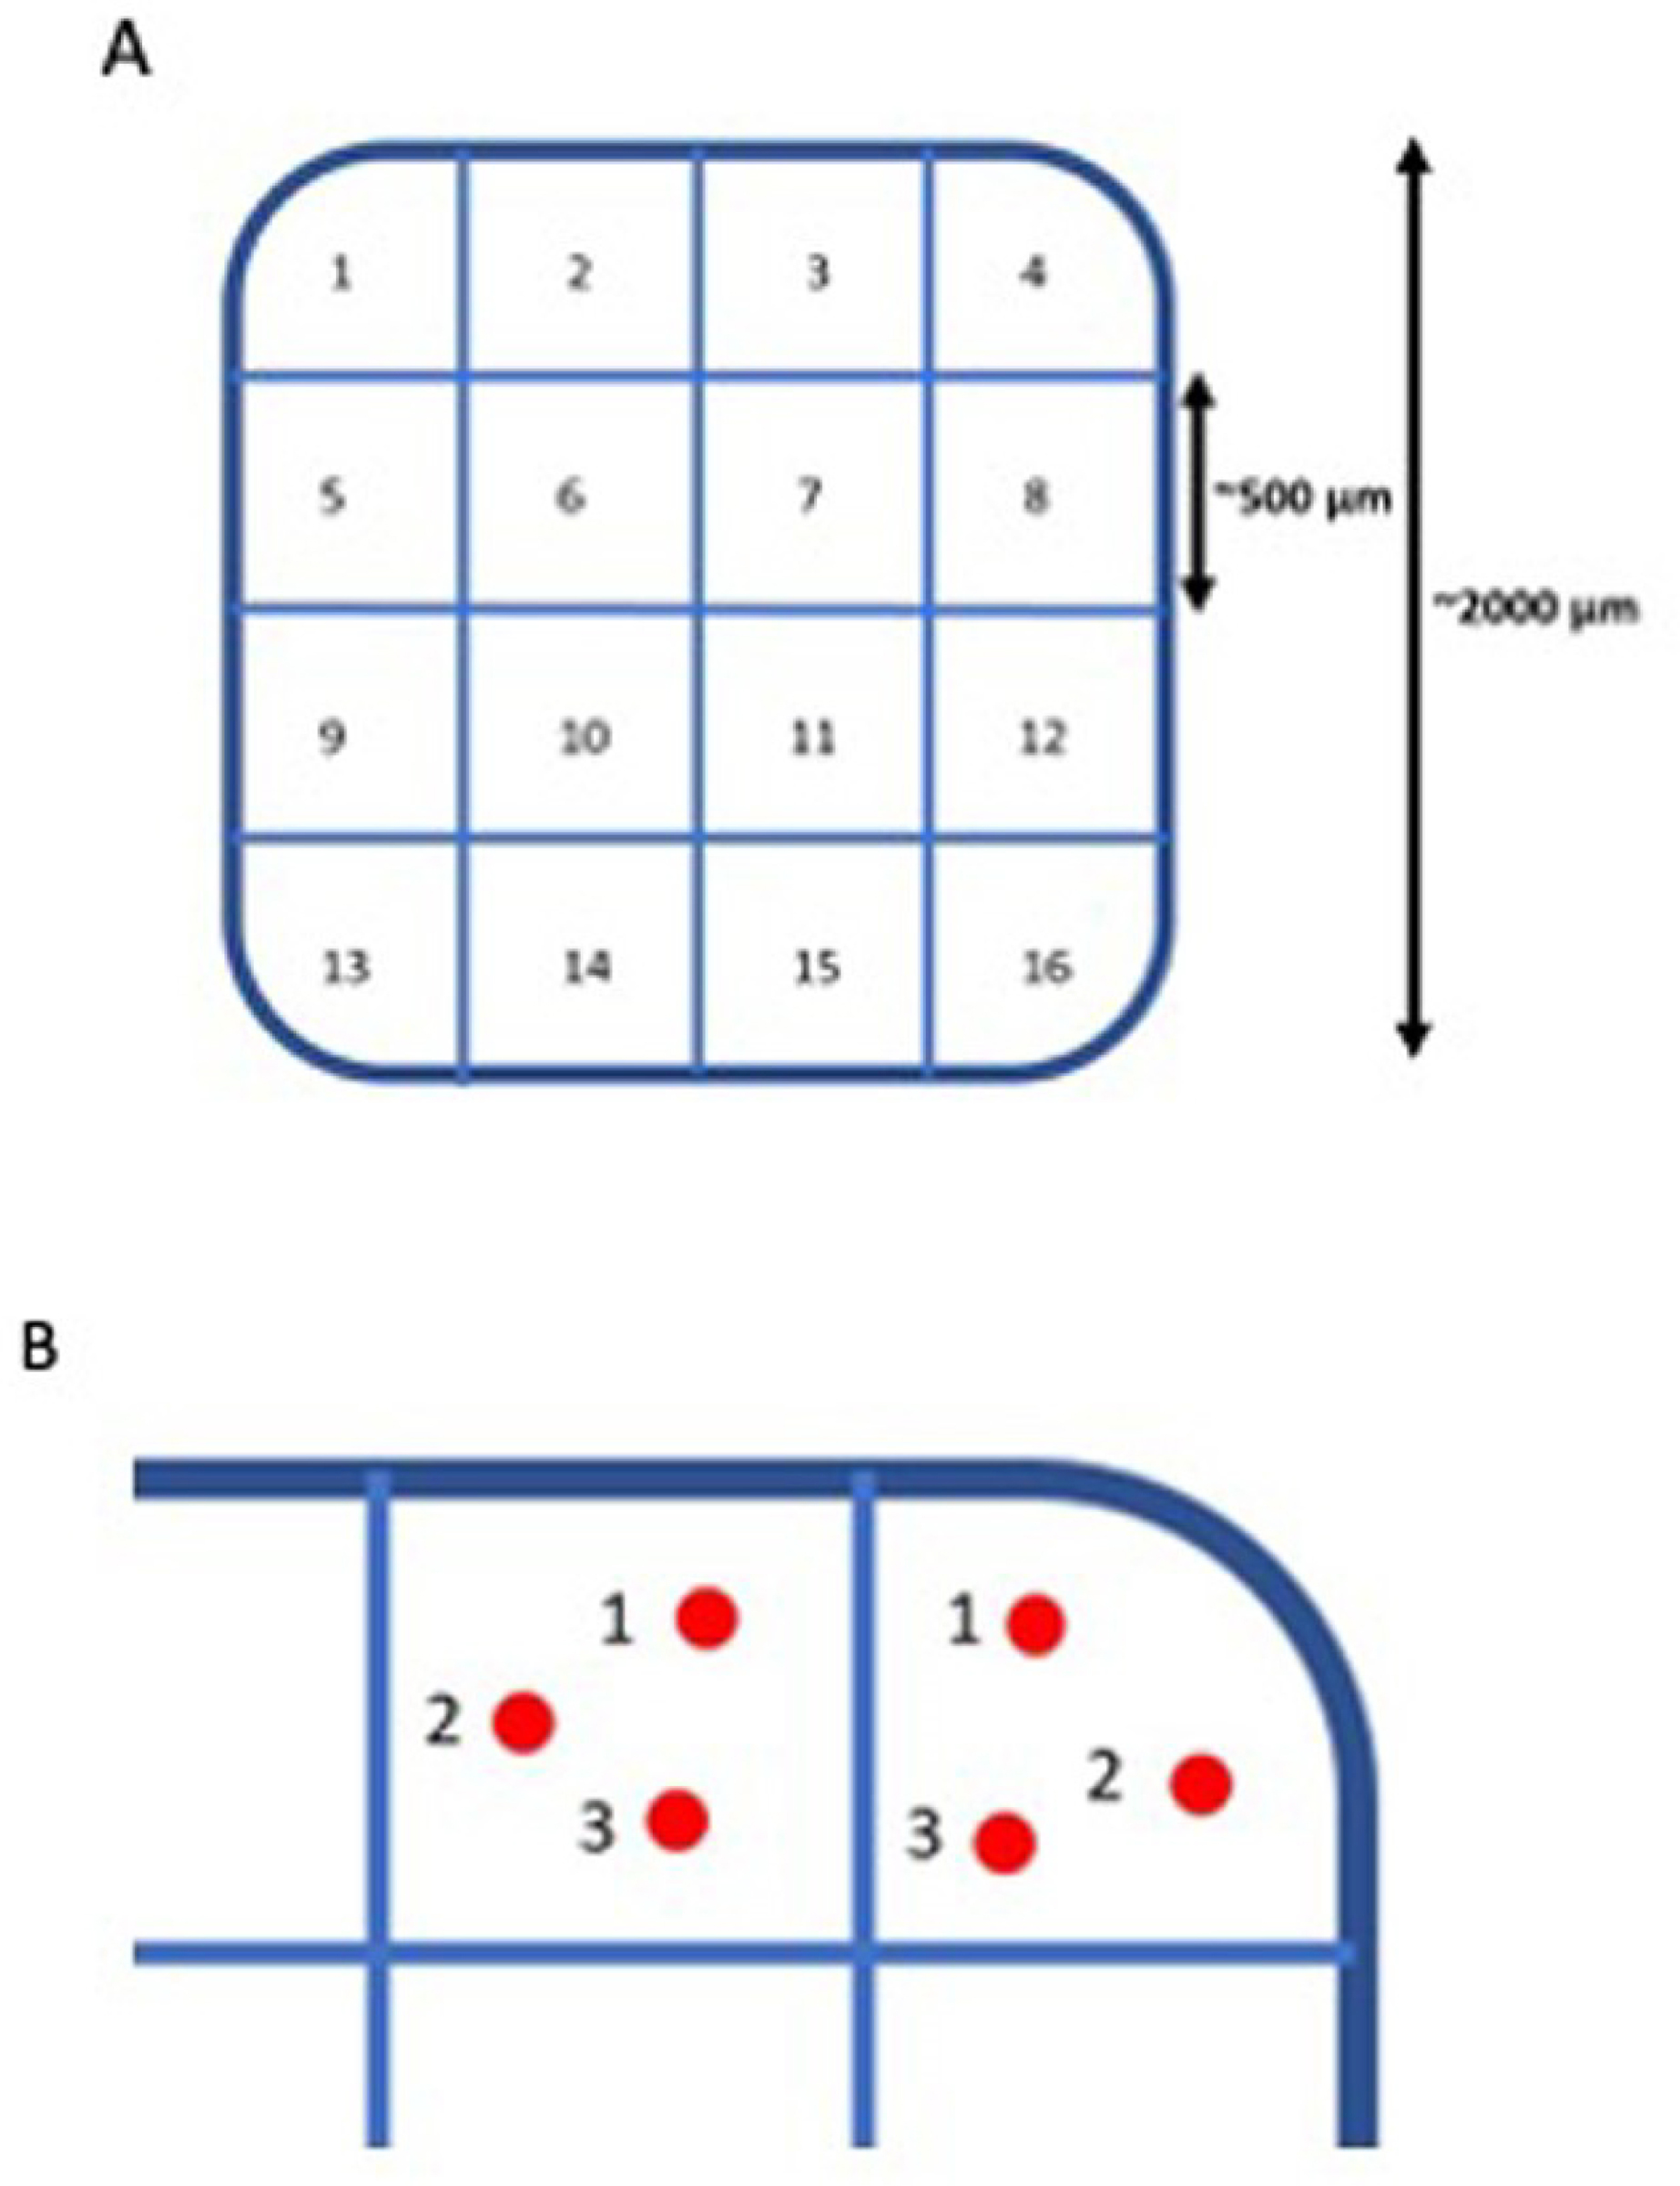
(A) PRIMA retinal implant analysis with 16 sectors of analysis. (B) Visual representation of the three measure points in each sampling region
In OCT scans, the INL is identified as the hypo-reflective dark grey layer situated in the middle between the two hyperreflective layers representing the Inner Plexiform layer (IPL) and the Outer Plexiform Layer (OPL) (as shown in Figure 4).
Figure 4:
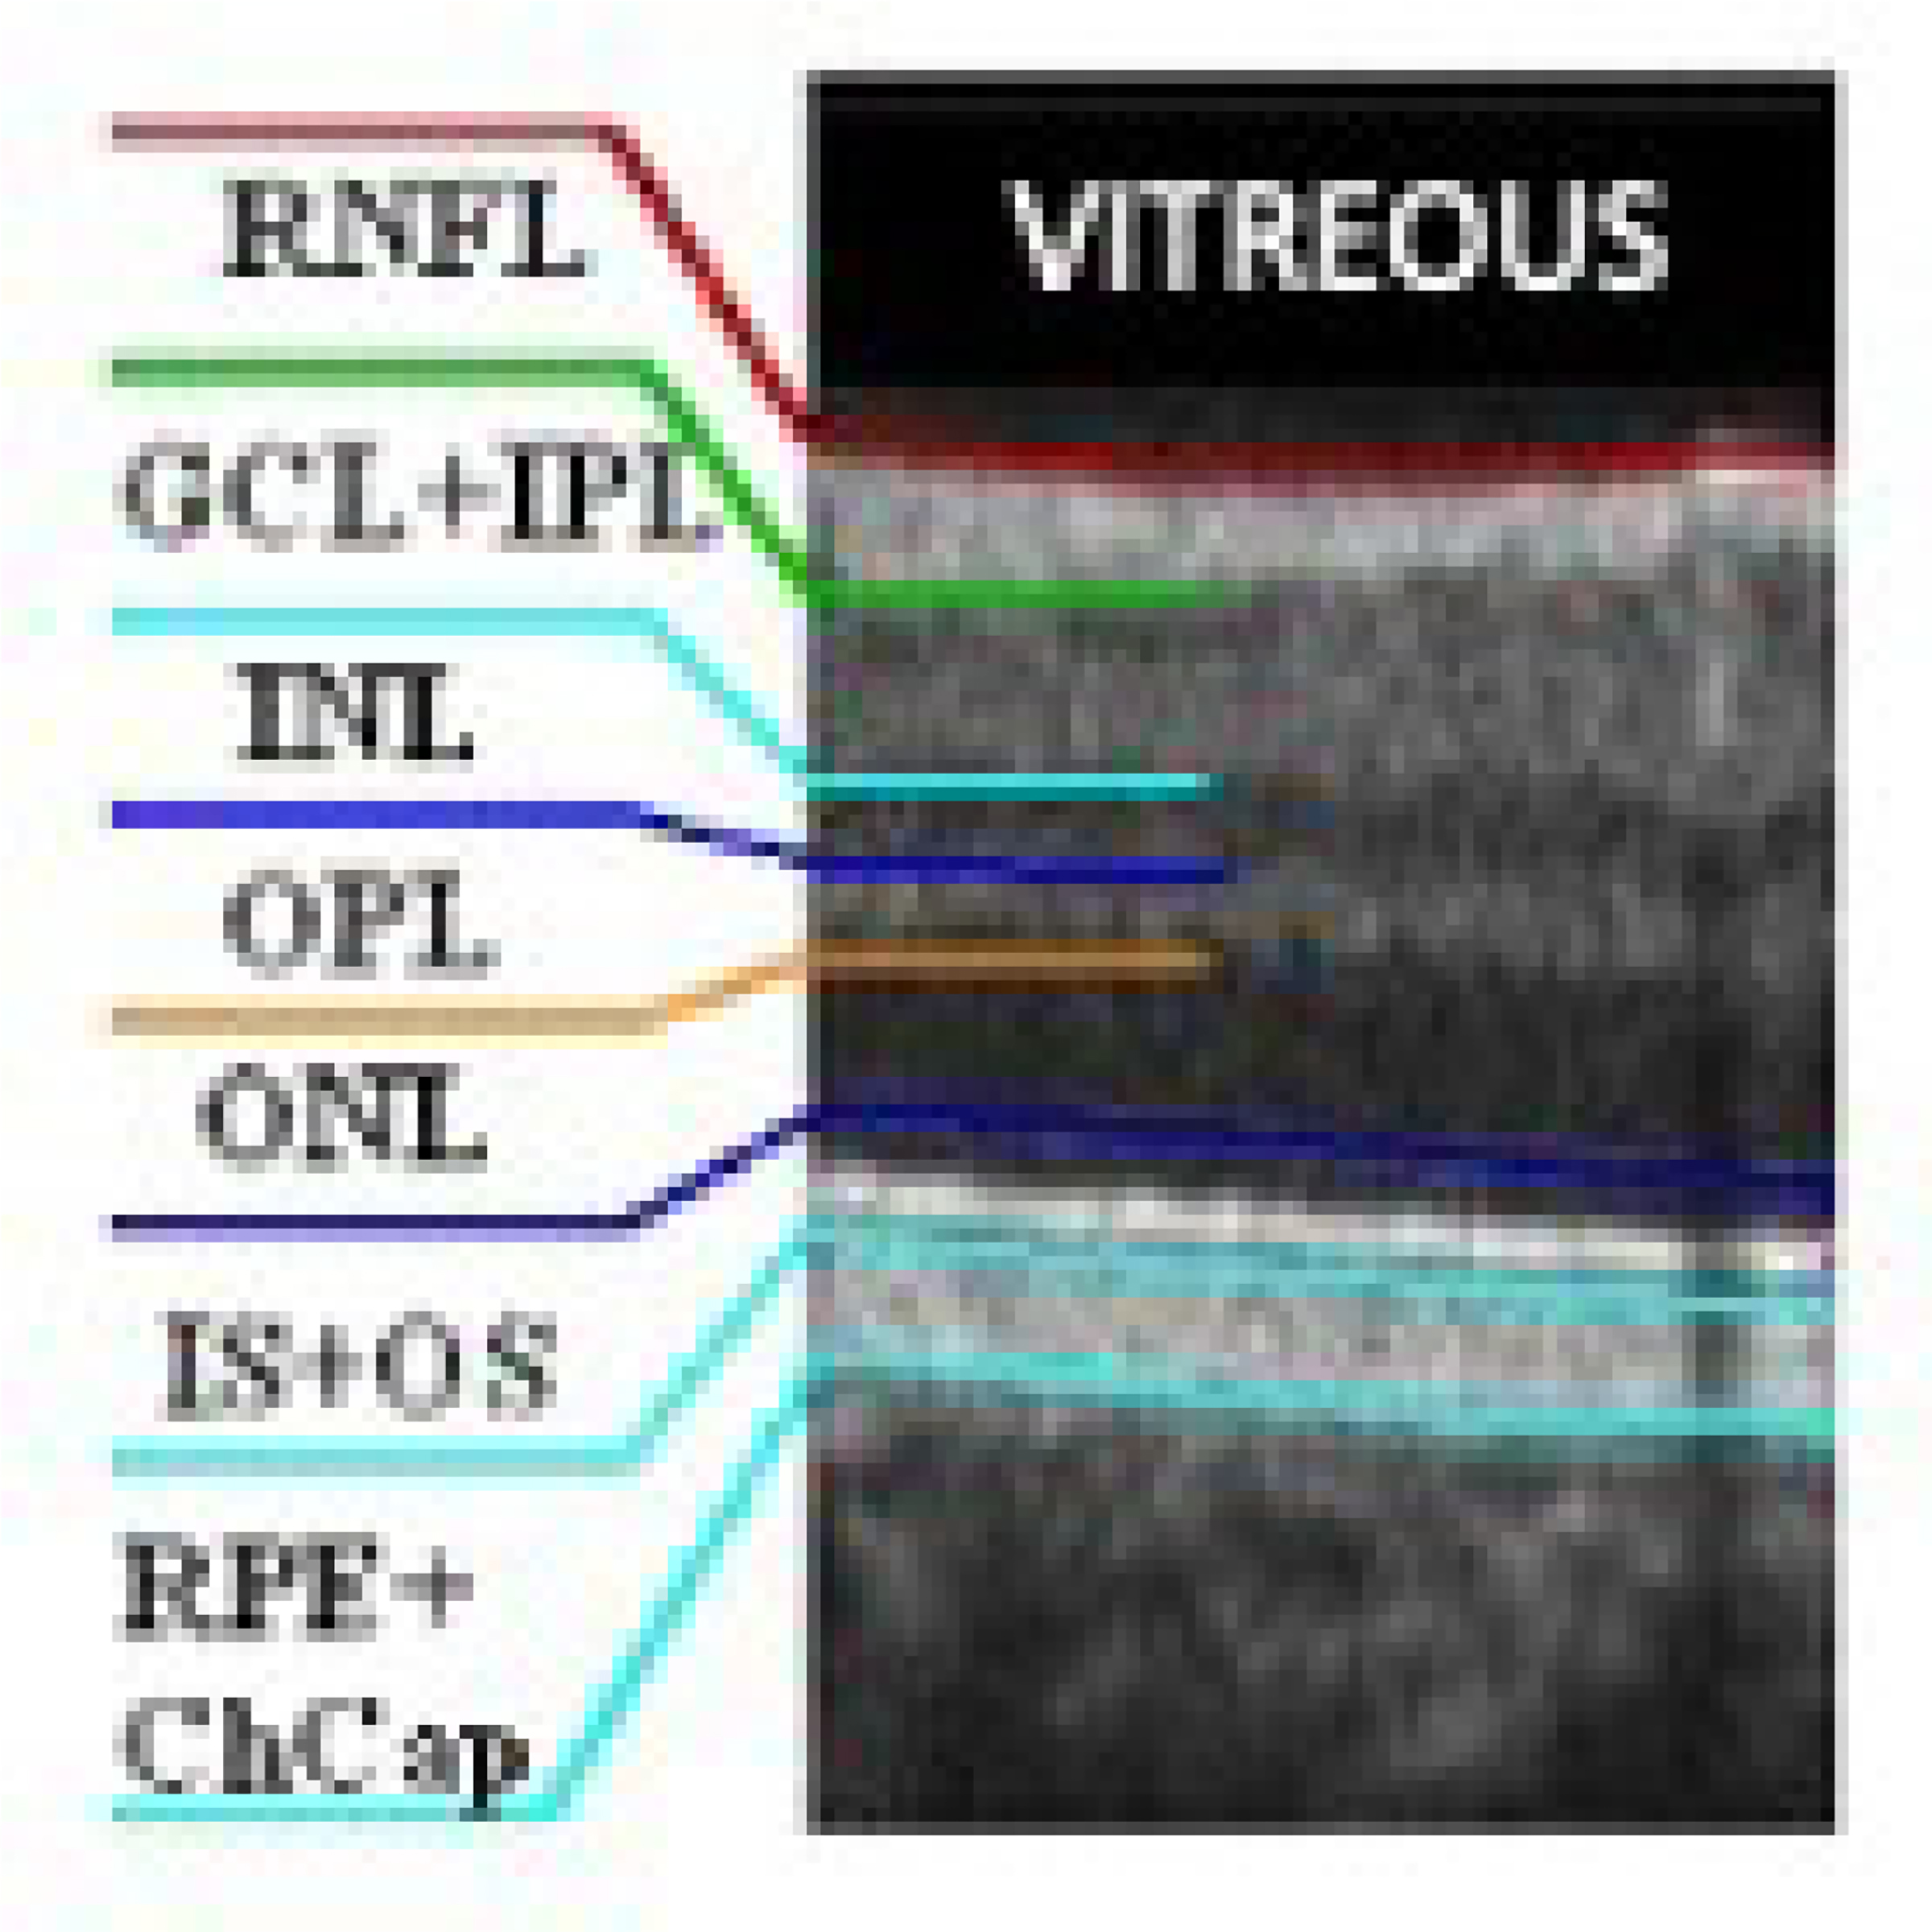
Retinal cell layers on a normal OCT scan. The inner nuclear layer (INL) is identified as the dark grey layer between the inner plexiform layer (IPL) and the outer plexiform layer (OPL). RNFL=retinal nerve fiber layer; GCL-ganglion cell layer; ONL-outer nuclear layer; IS=inner segment; OS=outer segment; RPE=retinal pigment epithelium; ChCap=choriocapillaris
We used the measuring tool in the Heyex software (Version 1.10.2.0; Spectralis, Heidelberg Engineering, Heidelberg, Germany) to measure the distance between the implant (on the electrodes’ side) and the external limit of the INL (at the boundary between the OPL and the INL).
Retinal thickness over the PRIMA implant was measured as the distance between the implant’s top surface and the top of the RNFL (figure 5A).
Figure 5A:
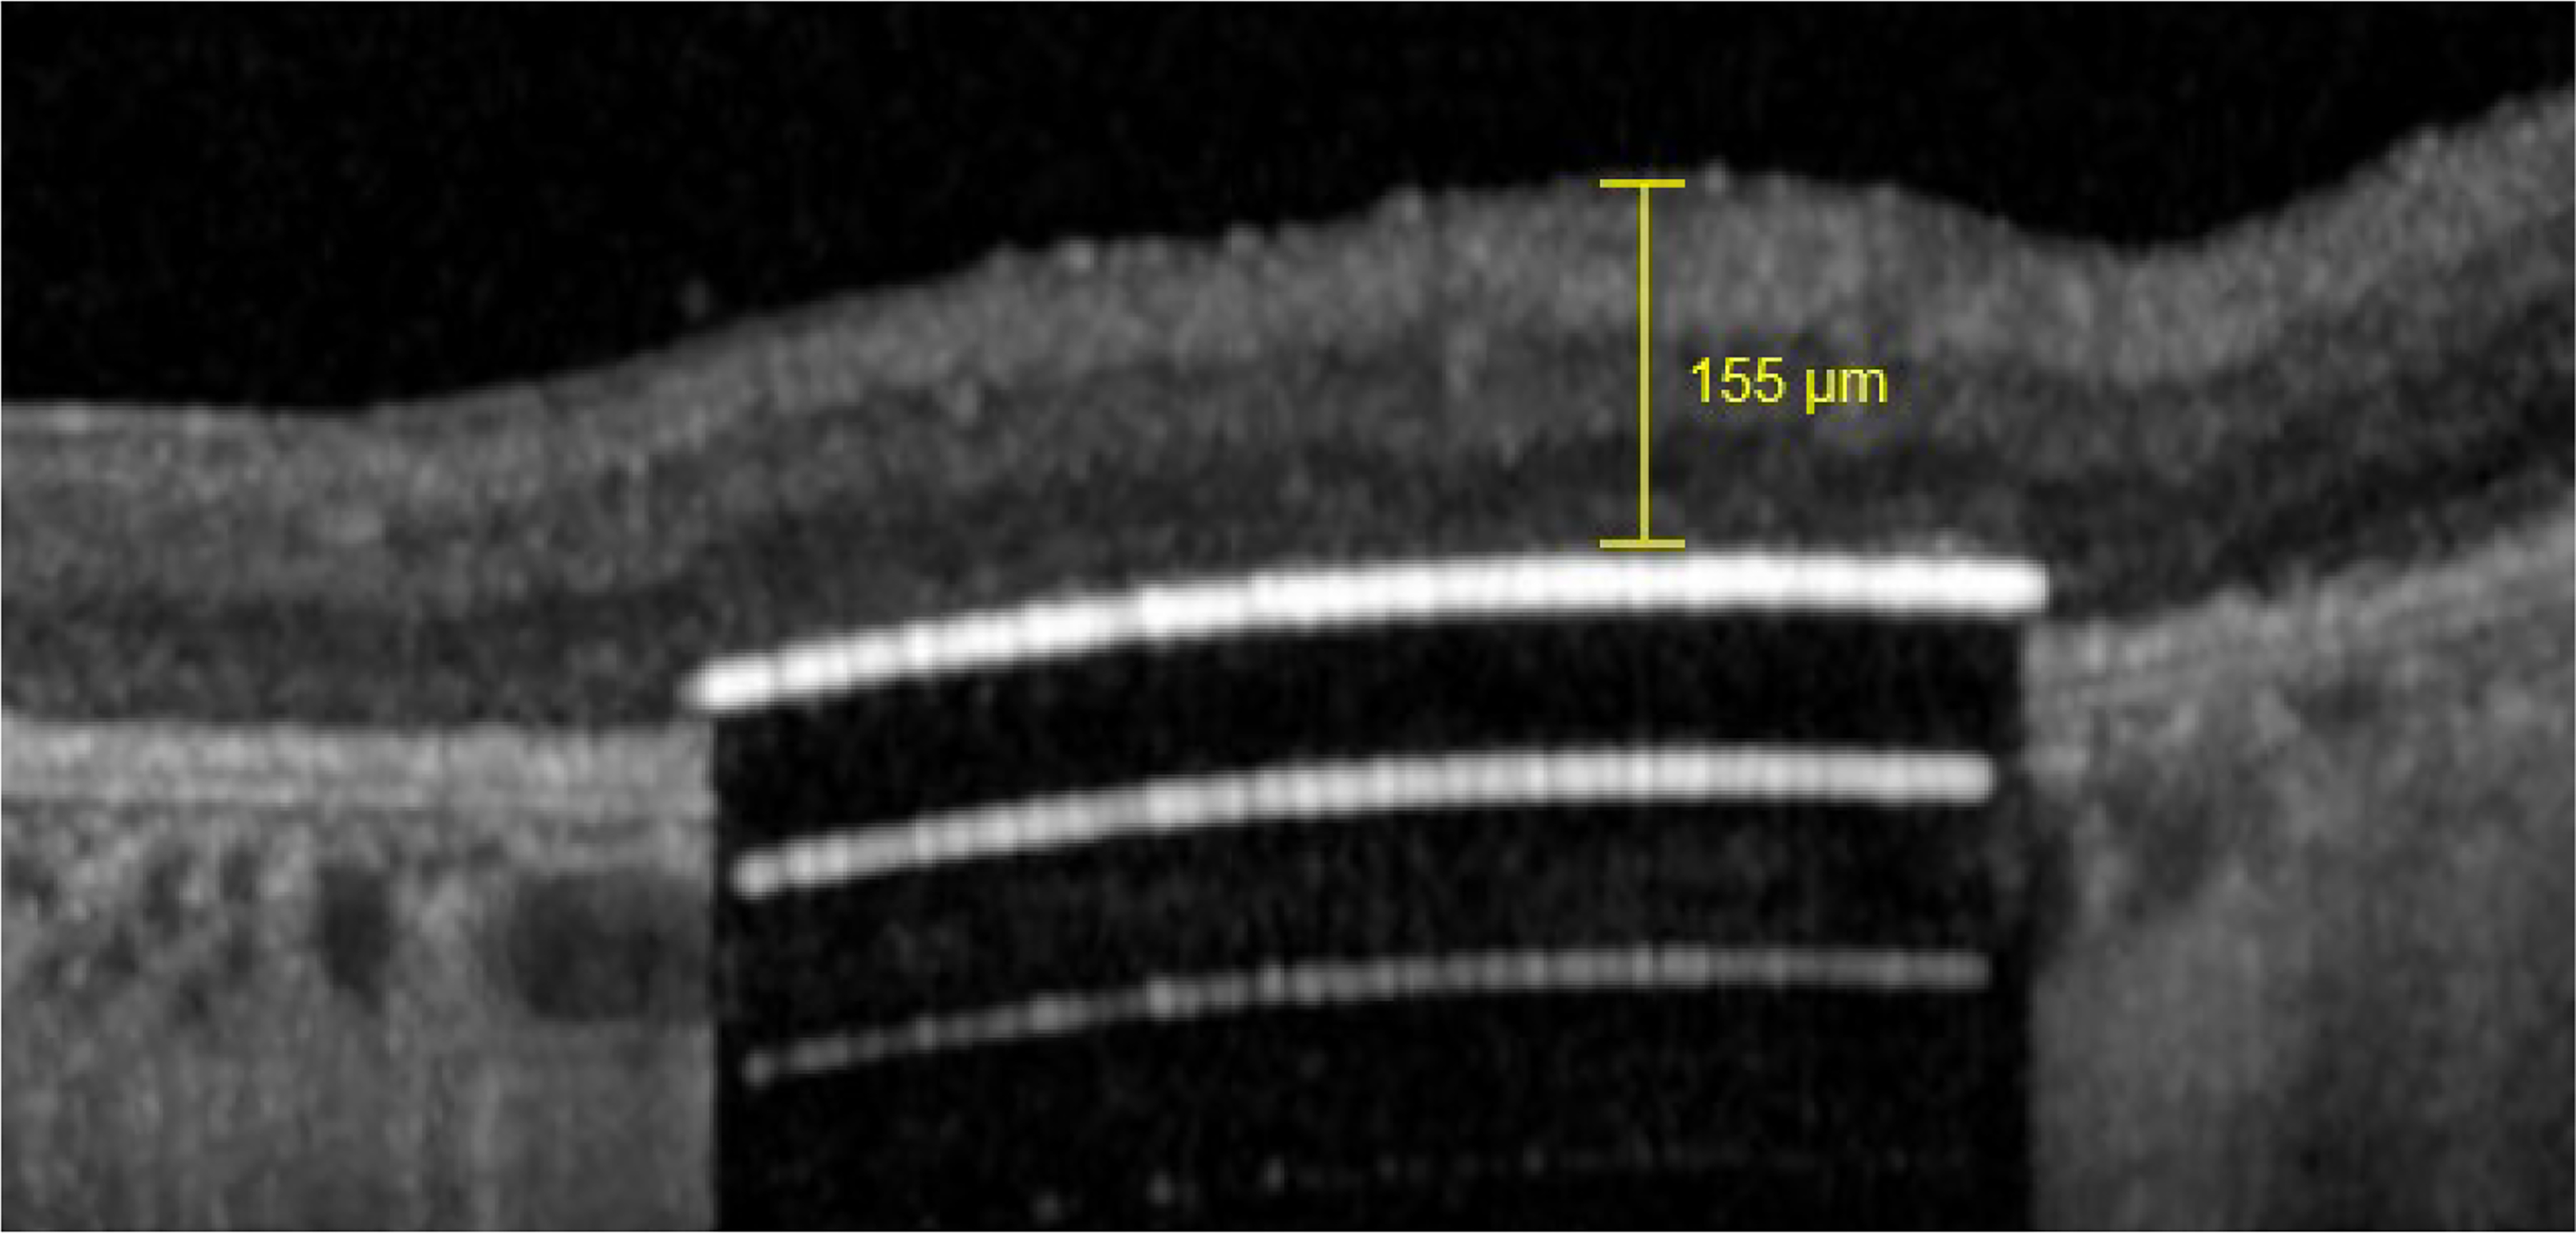
Example of measure of retinal thickness with the Heyex 2 software
Retinal thickness above the PRIMA implant surface to the INL was measured (figure 5B).
Figure 5B:
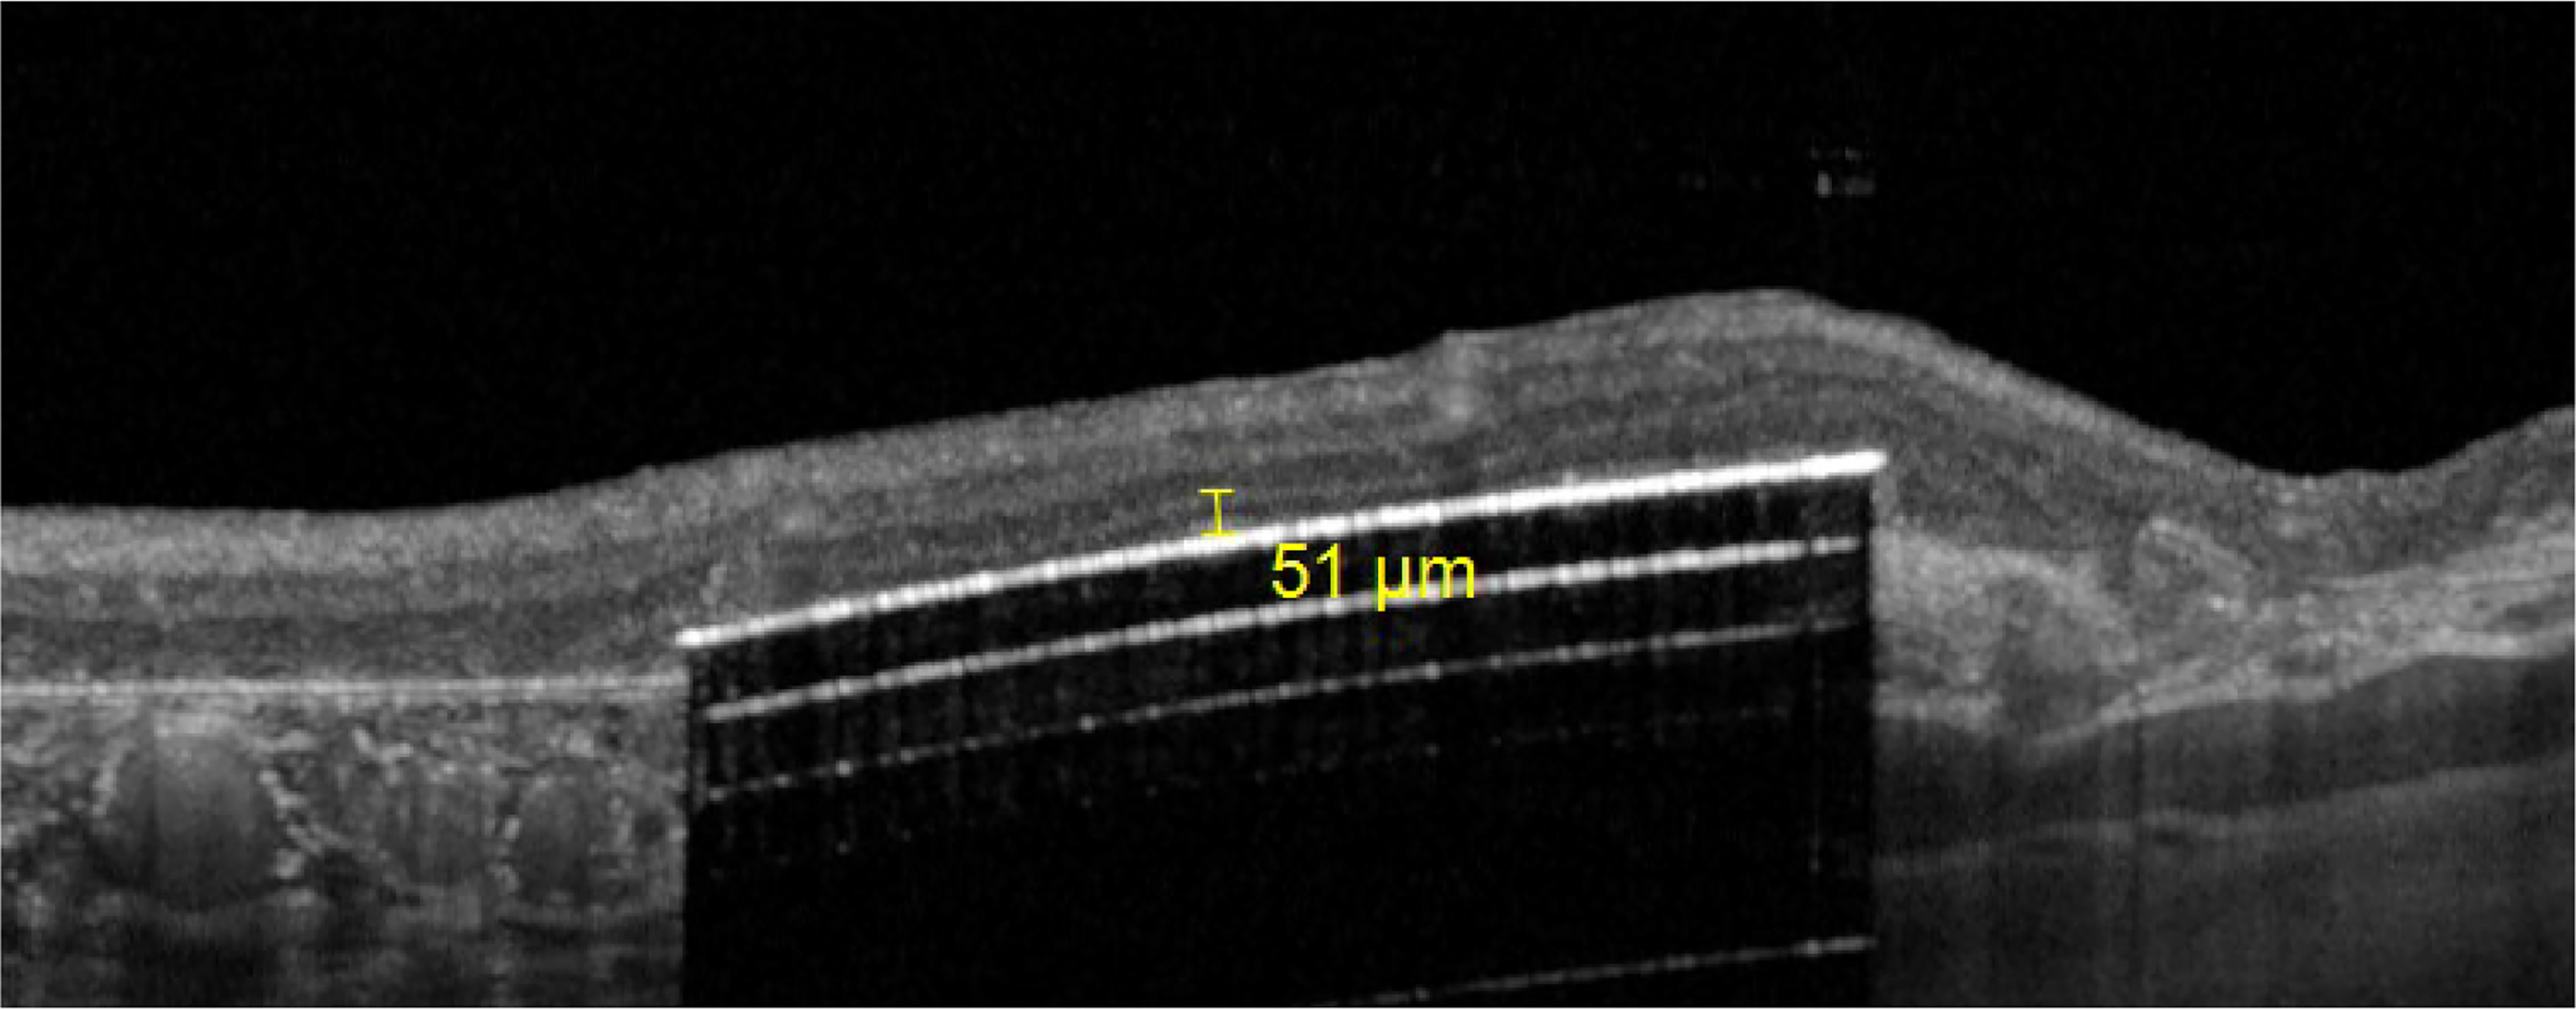
Example of measure of implant-inner nuclear layer with the Heyex 2 software
2.2. Assessment of the Control Macular Locations
Two areas where examined as a control of the macular thickness: 1) The area approximately 500 μm nasal from the implants always within the atrophic cRORA zone; and 2) The area approximately 500 μm temporal from the implant, always within the atrophic cRORA zone. In the first area (nasal), this nasal part of the retina was not detached nor the chip was implanted there. In the second area (temporal to the implant) the retina has been detached for implantation, and then re-attached in all the patients. The thickness has been measured at three spots in these nasal and temporal areas, similar to the measurements over the implant using the ruler function of the Heyex software.
The nasal part of the macula was not detached during implantation. By measuring 500 μm away from the nasal edge of the implant, we captured a standard section of the macula not detached during PRIMA implantation. This nasal section of the retina served as a control representing any retinal changes in the natural course of macular degeneration.
Measures were taken at baseline and at all the follow-up time points: 3, 6, 12, 24, 36 months post-implantation. For each patient, measurements were carried out at the same location across all time-points. Anatomical references have been used to establish the correspondence between the grid position on baseline and post-implantation images.
2.5. Statistical Analysis
Paired t-test was used to compare the mean RT at baseline and at follow-up time-points. Bonferroni correction was used to take into account multiple groups comparison. Alpha chosen for paired t-test=0.05 (with n=5 comparisons --> alpha adjusted=0.05/n=0.01).
In the first step collected data were analysed for each patient separately using linear regression model with the interaction of time and region as the predictor variables. The obtained pairwise differences between the estimated marginal means of the time points per each region were tested with t test adjusted with Tukey method using emmeans package (20, 21]. In the second step we pooled data for 3 patients and used Pinheiro and Bates mixed regression method [22], where we add random effect for patients in order to account for correlated measurements within each patient. The obtained marginal means were tested pairwise as in the first step. All the analysis was performed with R Core Team (21). Pairwise comparisons and pairwise by time, and the post hoc t test adjusted for multiple comparisons with Tukey method. For the 3 patients, the implant was divided into the inner and outer sector zones to explore any differences between the inner part of the implant versus the outer part of the implant in relation to RT and implant-INL changes. Inner sectors were 6, 7,10,11, and outer sectors 1, 2, 3, 4, 5, 8, 9, 12, 13, 14, 15, and 16 (figure 3A).
3. Results
3.1. Overall Retinal Thickness Changes
In all 3 patients and in all 16 regions, RT significantly decreased from baseline, (p<0.05) during the first 3 months, and did not change significantly after that (figure 6 and Table 1).
Figure 6:
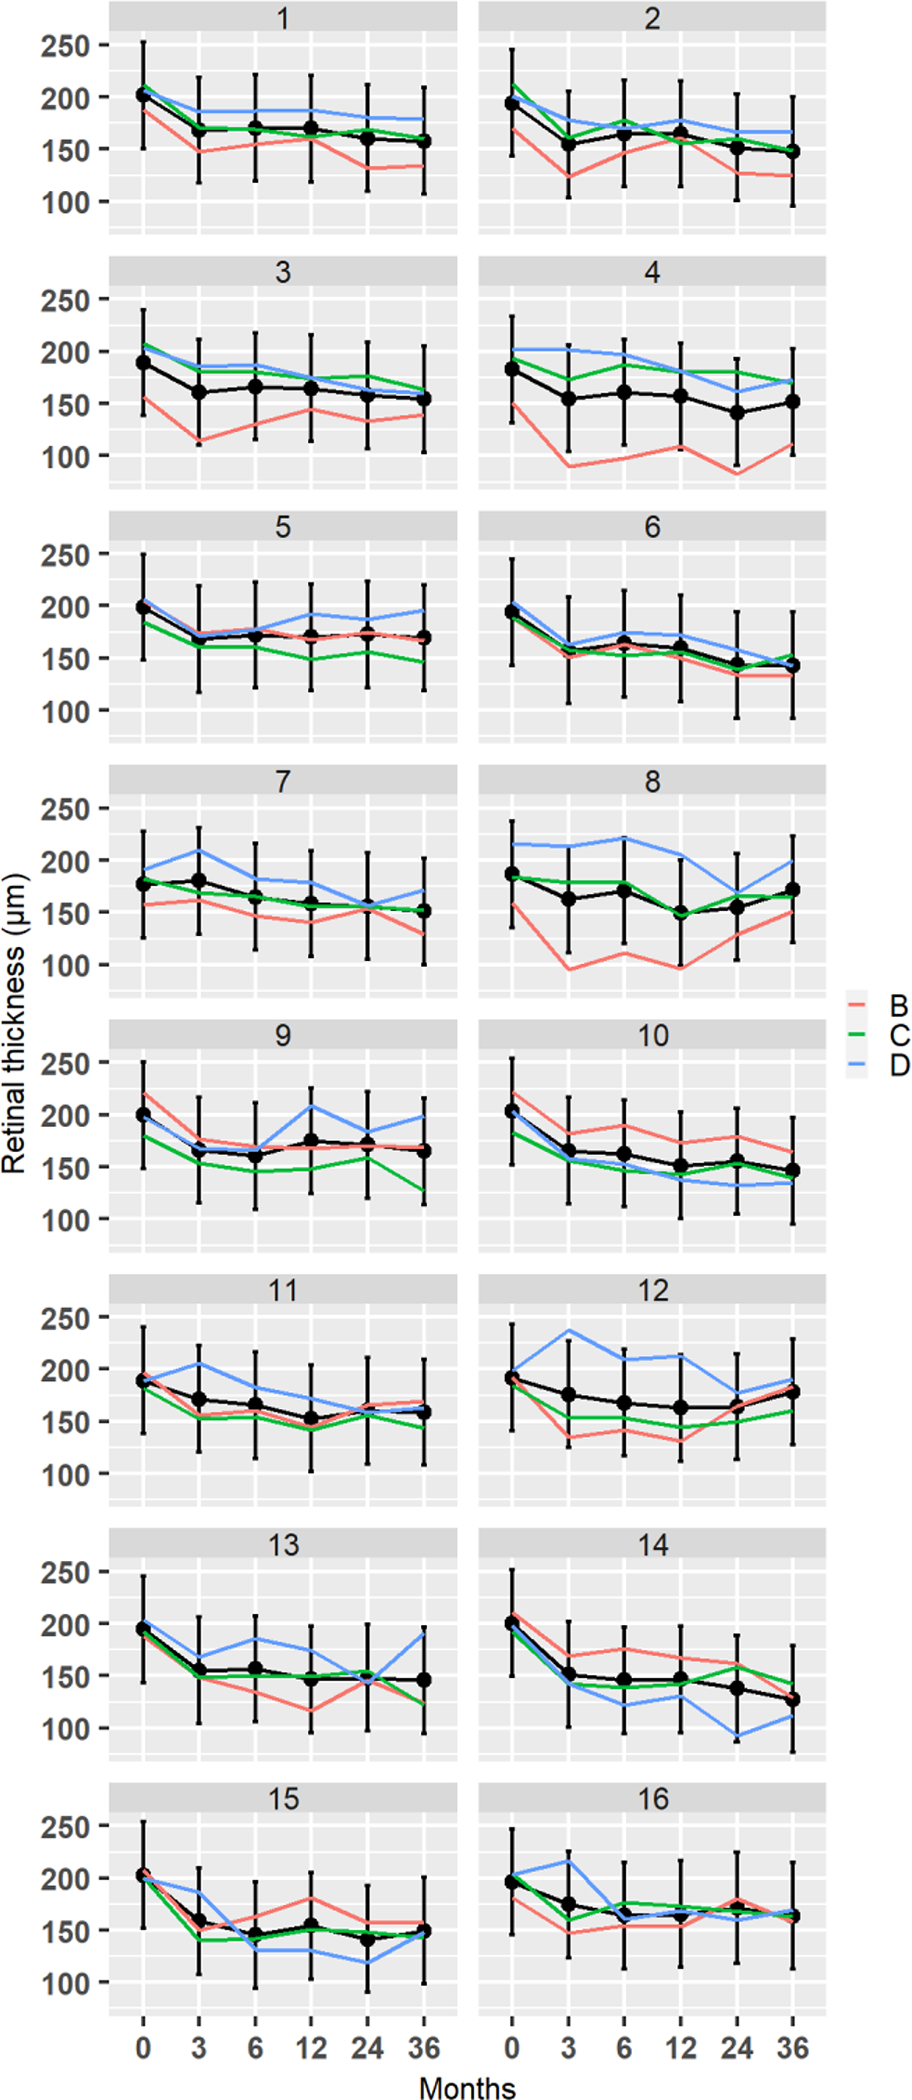
Changes in retinal thickness at 16 implant locations in all 3 patients. Black lines are fitted trajectories for each region obtained from least square regression model. The vertical lines are 95% confidence intervals for the marginal means.
Table 1:
Retinal Thickness Changes from baseline to 36 months
| Patient | Time | Retinal Thickness (μm) Mean (SD) |
Difference from baseline (μm) Mean (SD) |
Percentage change from baseline (%) |
|---|---|---|---|---|
|
| ||||
| B | baseline | 187±23 | ||
| C | 193± 11 | |||
| D | 202± 6 | |||
|
| ||||
| B | 3 months | 145± 27 | −42± 20 | −22.5± 10.7 |
| C | 160± 16 | −33± 10 | −16.9± 5.1 | |
| D | 187± 25 | −15± 15 | −7.3± 7.3 | |
|
| ||||
| B | 6 months | 151± 24 | −36± 19 | −19.2± 10.1 |
| C | 161± 16 | −32± 11 | −16.3± 5.6 | |
| D | 175± 25 | −27± 15 | −12.9± 7.1 | |
|
| ||||
| B | 12 months | 14± 24 | −39± 19 | −21.1± 10.3 |
| C | 155± 12 | −38± 9 | −19.7±4.7 | |
| D | 175± 25 | −26± 14 | −13.1± 7.1 | |
|
| ||||
| B | 24 months | 150± 26 | −37± 20 | −21.0± 11.4 |
| C | 159± 11 | −38± 9 | −17.5±4.1 | |
| D | 157± 25 | −45± 15 | −22.2± 7.4 | |
|
| ||||
| B | 36 months | 146± 21 | −41± 18 | −21.8± 9.6 |
| C | 150± 14 | −43± 10 | −22.2± 5.1 | |
| D | 169± 25 | −33± 15 | −16.3± 7.4 | |
Outer sector RT decreased from baseline to 3 months, on average by 32.3±11.5μm (p<0.05), and then remained stable up to the end of the follow-up at 36 months (figure 8). Inner sector RT decreased from baseline to 3 months, on average by 22.2±12.9μm (p<0.05), and then remained stable up to the end of the follow-up at 36 months (figure 7). There were no statistically significant differences between the outer and inner sectors at any time point (Table 2).
Figure 8:
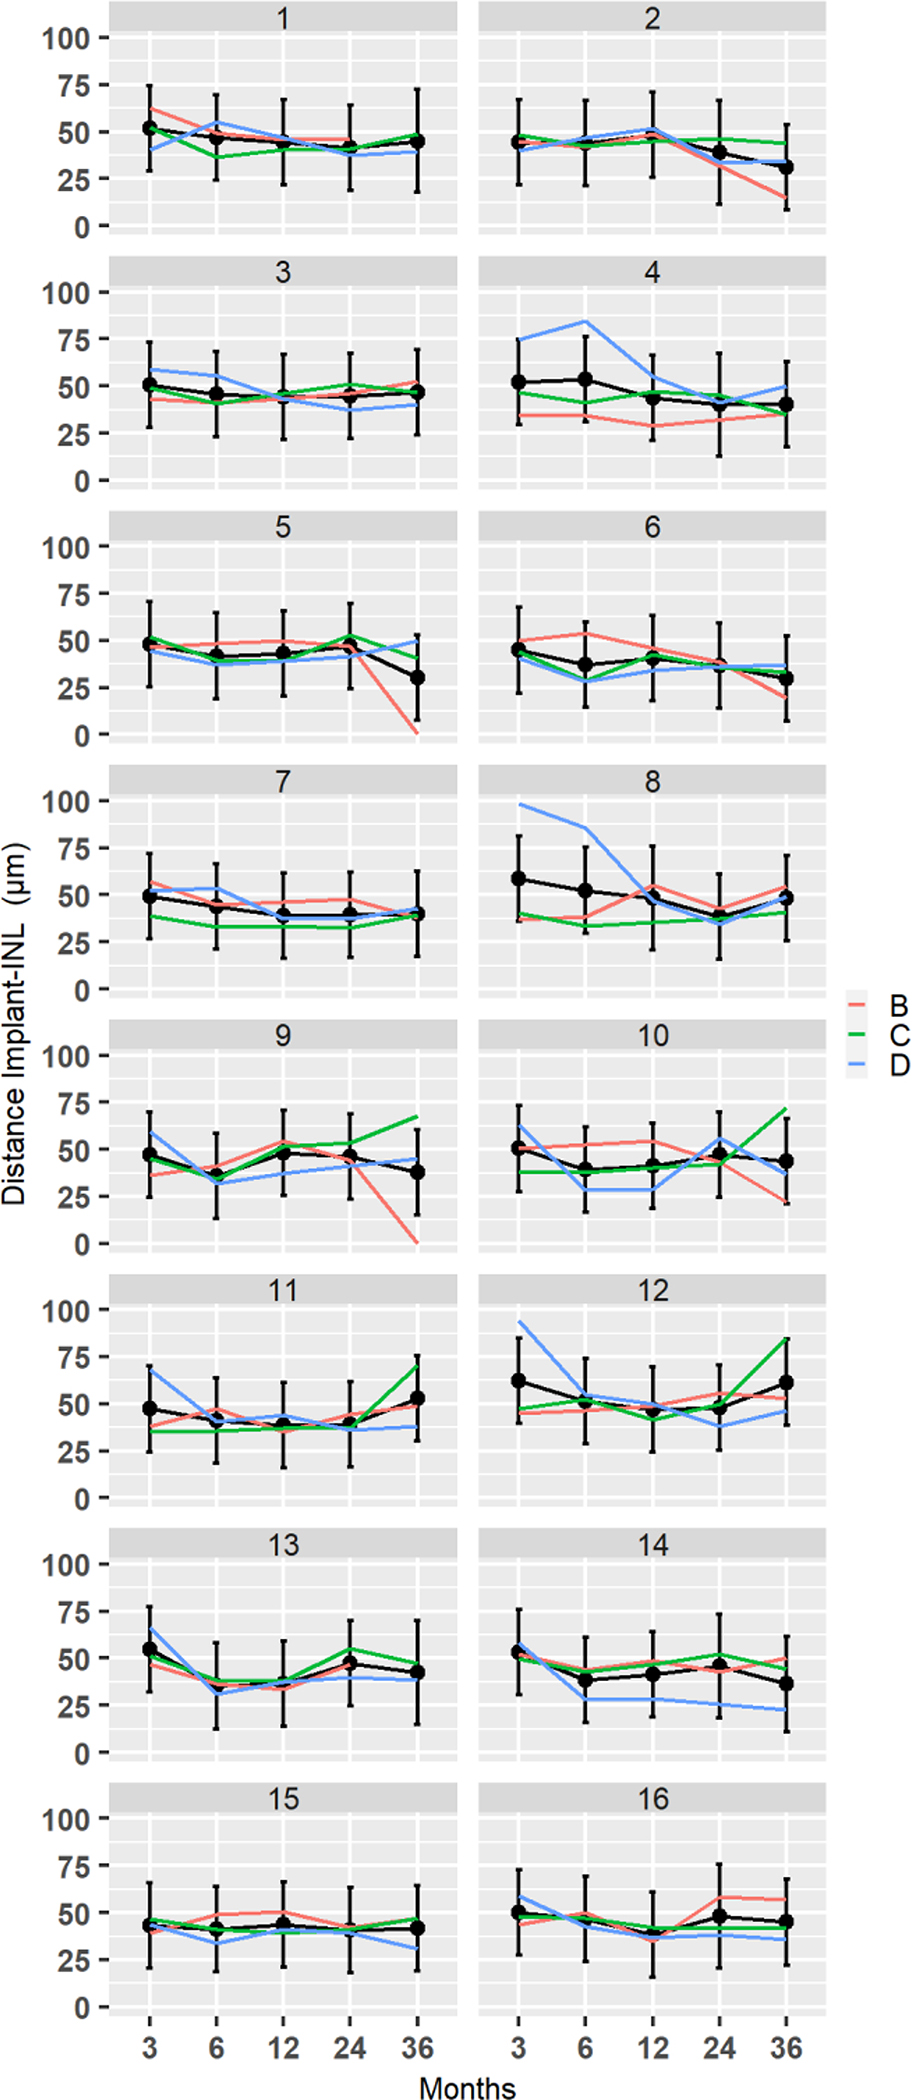
Distance from the implant to INL at 16 implant locations for subjects B, C, and D. Black lines are fitted trajectories for each region obtained from the least square regression model. The vertical lines are 95% confidence intervals for the marginal means
Figure 7:
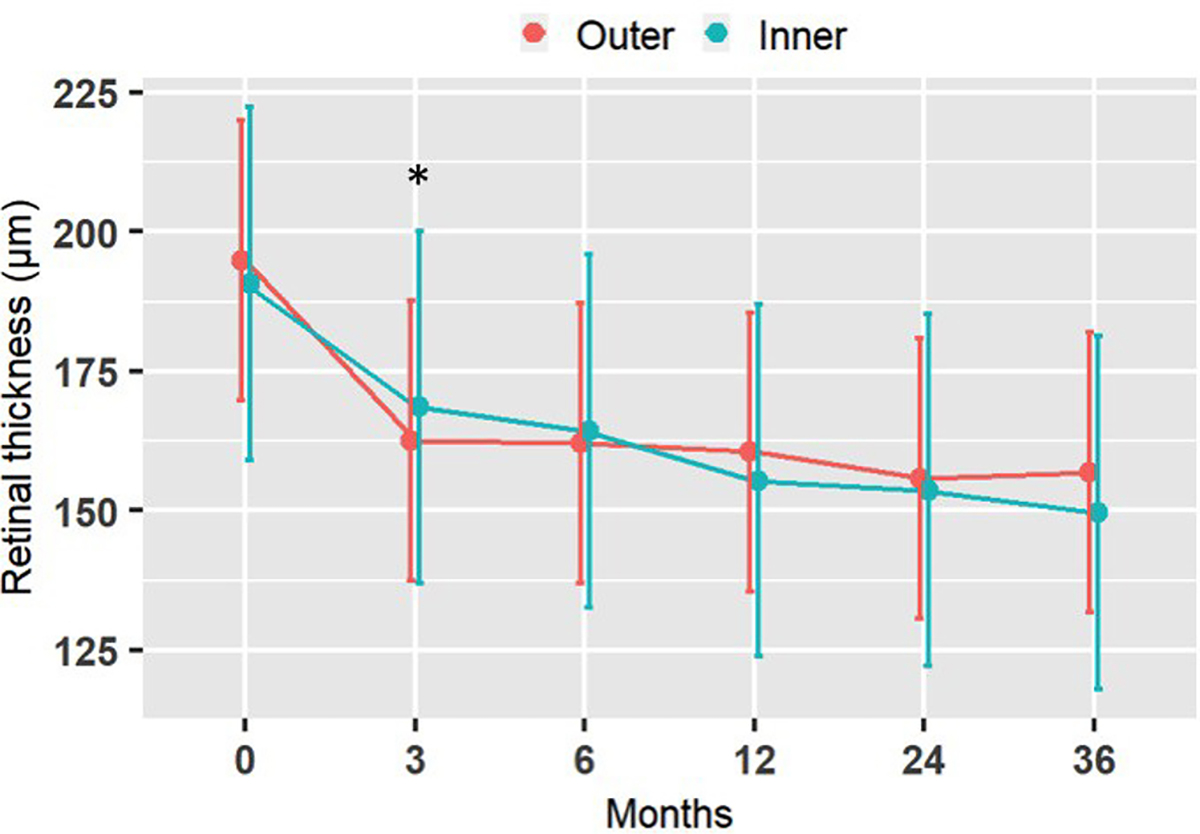
Retinal thickness at the outer and inner locations of the implant over time, averaged among all subjected. Vertical lines are 95% confidence intervals for the marginal means. * significant change from baseline to 3 months
Table 2:
Pairwise Comparisons of Retinal Thickness between Inner and Outer Sectors Following Implantation.
| Time | Contrast | Mean Difference (±SD) | P-value |
|---|---|---|---|
| baseline | Outer-inner | 4.0 ± 5 | 0.52 |
| Month 3 | Outer-inner | −6.0 ± 6 | 0.35 |
| Month 6 | Outer-inner | −2.2 ± 7 | 0.73 |
| Month 12 | Outer-inner | 5.1 ± 4 | 0.43 |
| Month 24 | Outer-inner | 2.0 ± 7 | 0.75 |
| Month 36 | Outer-inner | 7.3 ± 8 | 0.26 |
Post hoc t test adjusted for multiple comparisons with Tukey method
3.2. Overall Distance from Implant to Inner Nuclear Layer
In all patients, there was no clear pattern of change over time (figure 8). In Patient B, significant changes occurred in 5 out of 16 regions (regions: 2, 5, 6, 9 and 10) mainly due to decrease at 36 months, p<0.05. The mean distance from the implant to INL was 45± 5μm at month 3, 6 and 12,; 46 ± 7μm at month 24± 5 μm; and, 41± 5μm at month 36.
In Patient C, significant changes occurred in 4 out of 16 regions (regions: 9, 10, 11, 12) mainly due to increase at 36 months. The mean distance from the implant to INL was 46±5 μm at month 3, 39± 6μm at month 6, 42± 5 μm at month 12, 45± 7μm at month 24 and 50±16 μm at month 36. In Patient D, significant changes took place in 10 out of 16 regions (regions: 3, 4, 8, 9, 10, 11, 12, 13, 14, 16), p<0.05. In some of the regions distance increased and in others decreased, and yet in others it remained stable. Decrease and stabilization occurred in a vertical array of regions 4, 8, 12, 16. The mean distance from implant to INL was 60±18μm at month 3, 46±18μm at month 6, 41± 8μm at month 12, 39±6μm at month 24, and 50±8μm at month 36.
The distance between the implant surface and the INL did not show any statistically differences in respect to inner versus outer sectors location (Table 3) between 3 months and 36 months.
Table 3:
Pairwise Comparisons of Implant Distance-INL between Inner and Outer Sectors Following Implantation
| Time | Contrast | Mean Difference (±SD) | P-value |
|---|---|---|---|
| Month 3 | Outer-inner | 3.4± 4 | 0.30 |
| Month 6 | Outer-inner | 4.0 ± 4 | 0.22 |
| Month 12 | Outer-inner | 3.7± 8 | 0.25 |
| Month 24 | Outer-inner | 3.2± 5 | 0.33 |
| Month 36 | Outer-inner | 0.6± 3 | 0.86 |
Post hoc t test adjusted for multiple comparisons with Tukey method
3.5. Nasal Atrophy Control Group
Overall, there was no significant change in RT of the nasal control area on paired t-test and Bonferroni correction (Figure 9 and Table 4).
Figure 9:
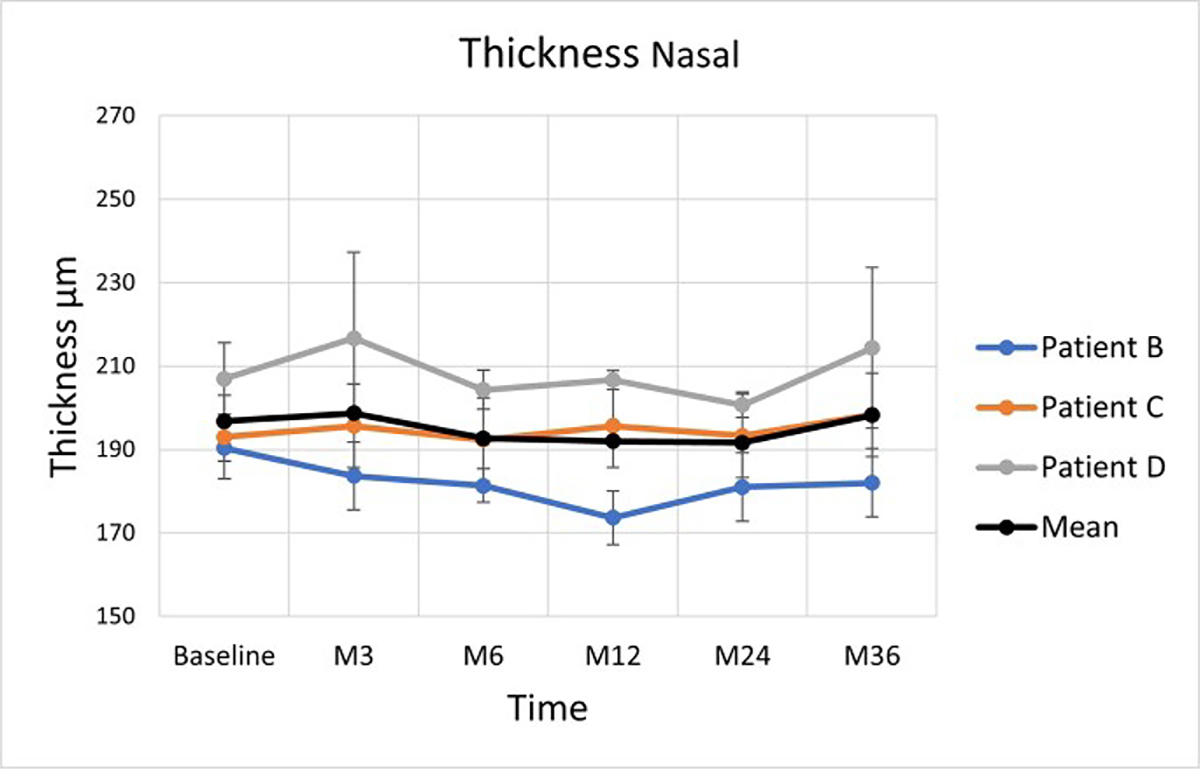
Average retinal thickness changes in the zone nasal to the implant. The vertical lines are 95% confidence intervals for the marginal means. Coloured lines are empirical trajectories of the 3 patients
Table 4:
Retinal Thickness within the Nasal Control Area
| Patient | Time | Retinal Thickness (μm) Mean (SD) |
Difference from baseline (μm) Mean (SD) |
Percentage change from baseline (%) |
|---|---|---|---|---|
|
| ||||
| B | baseline | 190± 3 | ||
| C | 193± 5 | |||
| D | 207± 8 | |||
|
| ||||
| B | 3 months | 184± 8 | −6± 5 | −3.5±2.9 |
| C | 196± 5 | +3± 4 | +1.4± 1.9 | |
| D | 217± 21 | +10± 13 | +4.7± 6.1 | |
|
| ||||
| B | 6 months | 181± 4 | −9± 3 | −4.7± 1.6 |
| C | 192± 5 | −1± 4 | −0.3± 1.2 | |
| D | 204± 5 | −3± 5 | −1.3± 2.2 | |
|
| ||||
| B | 12 months | 174± 6 | −16± 4 | −8.8± 2.2 |
| C | 196± 12 | +3± 8 | +1.4± 3.7 | |
| D | 207± 2 | 0± 4 | 0± 1.9 | |
|
| ||||
| B | 24 months | 181± 8 | −9± 5 | −4.9± 2.7 |
| C | 193± 9 | 0± 6 | 0± 3.1 | |
| D | 201± 3 | −6± 5 | −3.1± 2.6 | |
|
| ||||
| B | 36 months | 182± 8 | −8± 5 | −4.4± 2.8 |
| C | 198± 11 | +5± 7 | +2.8± 3.9 | |
| D | 214± 19 | +7± 12 | +3.5± 6 | |
3.6. Temporal Atrophy Control Group
RT of the temporal control area did not change significantly in any of the patients on paired t-test and Bonferroni correction (Figure 10 and Table 5).
Figure 10:
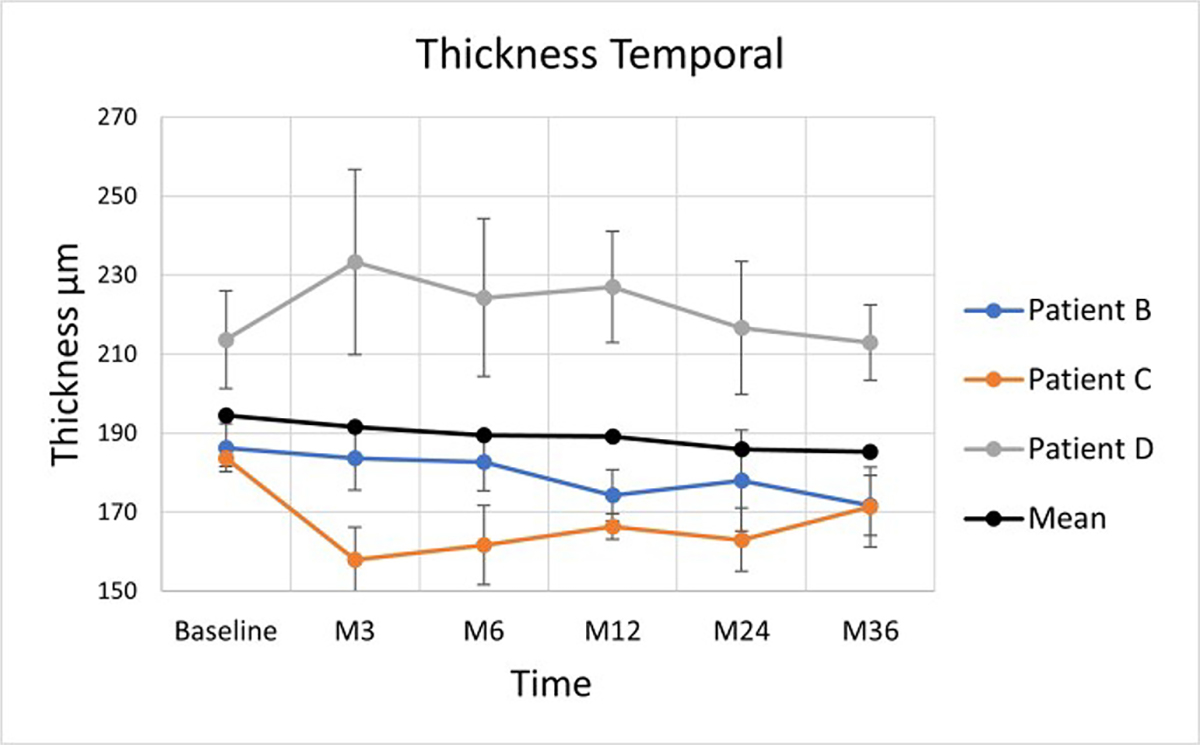
Average retinal thickness changes in the zone temporal to the implant. The vertical lines are 95% confidence intervals for the marginal means. Coloured lines are empirical trajectories of the 3 patients
Table 5:
Retinal Thickness within the Temporal Control Area
| Patient | Time | Retinal Thickness (μm) Mean (SD) |
Difference from baseline (μm) Mean (SD) |
Percentage change from baseline (%) |
|---|---|---|---|---|
|
| ||||
| B, C, D | baseline | 186± 6 | ||
| 184± 2 | ||||
| 214± 12 | ||||
|
| ||||
| B, C, D | 3 months | 184± 8 | −2± 6 | −1.4± 4.2 |
| 158± 8 | −28± 5 | −14± 2.5 | ||
| 233± 23 | +19± 15 | +9.2± 7.3 | ||
|
| ||||
| B, C, D | 6 months | 183± 7 | −6± 5 | −1.9± 1.6 |
| 162± 10 | −22± 6 | −11.9± 3.2 | ||
| 224± 20 | +10± 13 | +5± 6.5 | ||
|
| ||||
| B, C, D | 12 months | 174± 6 | −12± 5 | −6.4± 2.7 |
| 166± 3 | −18± 2 | −9.4± 1.1 | ||
| 227± 14 | +13± 10 | +6.2± 4.8 | ||
|
| ||||
| B, C, D | 24 months | 178± 13 | −8± 8 | −4.5± 4.5 |
| 163± 8 | −21± 5 | −11.3± 2.7 | ||
| 217± 17 | −6± 12 | 1.4± 2.8 | ||
|
| ||||
| B, C, D | 36 months | 172± 8 | −14± 6 | −7.8± 3.3 |
| 171± 10 | −13± 0 | −6.7± 0.1 | ||
| 213± 9 | −1± 9 | −0.3± 2.7 | ||
4. Discussion
The PRIMA implants did not cause any obvious structural changes in the vicinity of the device, nor in the outer retinal (OPL, INL, IPL, ONL) neural layers. The average distance between the surface of the implant and the INL was 45 ±5 μm at 3 months, and then remained stable during the follow-up of 36 months. Retinal thickness above the device decreased by 33–43 μm during the first 3 months, and no further changes were observed up to 36 months.
Following the retinal detachment surgery and re-attachment, the macular neural layers are known to become thinner over time [23,24]. We hypothesized that the retinal thinning in our study may be attributed to the retinal micro-trauma that is induced during surgery where a localised retinal detachment bleb is created temporal to the atrophic cRORA zone to allow the implant to be delivered into the submacular space. However, the small decrease in RT we observed aside of the implant from baseline 194.6± 12.4 μm to 185.3± 24 μm at 36 months was not statistically significant.
Previous epiretinal implant studies in RP have demonstrated increased retinal thickness, macular oedema, and development of fibrosis at the location of the implant [17, 25]. In our three patients with cRORA AMD, the trend was opposite as retinal thickness above the implant decreased from baseline, on average by 30± 12μm during the first 3 months postoperatively, then remained stable up to 36 months of the follow-up. This initial mild reduction in retinal thickness has not been associated with any negative functional deficit or any negative effect on visual function during implant stimulation [18].
This surgical trauma hypothesis was tested using two control groups that we analyzed in the nasal and temporal zones located 500 μm from the edge of the implant. As previously stated in the surgical technique, we measured standard areas within the area of detached and then re-attached retina located within the atrophic zone in cRORA AMD. We observed a trend for reduction of retinal thickness but this did not reach statistical significance. The implant is centred close to the centre of the macula, and the nasal cRORA zone is not detached or altered during the surgical period. The nasal zone of cRORA was used as a second control area to map retinal thickness changes in cRORA over time. We observed no significant change of retinal thickness from baseline up to 36 months, across all time-points. Our analysis would suggest that immediately following subretinal implantation in the cRORA zone, there is an associated early decrease in RT that could be explained by changes within the re-attached retina following surgery. The natural history of geographic atrophy in dry AMD involves progressive thinning of the outer photorecptor laminae, outer nuclear layer, and inner segment layers over a median 1.1 year follow-up [26]. In our study, we did not observe any similar changes over a 36 month period following subretinal implantation in cRORA AMD.
There are several reports of retinal structural changes in geographic atrophy and AMD (27–29). Our patients had advanced late-stage AMD with cRORA, and the recent reports do not either study this AMD image-classified subgroup, or measure similar RT measurements over time in GA patients. Ebneter and co-workers (27) measured INL thickness in a cohort of patients with moderate GA and better visual acuity, as compared to our study. They reported significant thickening of the presumptive INL over areas of degenerated photoreceptors within and outside the areas of atrophy and this correlated with GA progression. The outer retinal layer thickness surrounding the zone of geographic atrophy has been shown to increase (28). This study did not analyse patients with cRORA, so not able to compare with our study. Zhang et al revealed that not only the RPE, but also photoreceptor layer thickness decrease significantly in regions within and around GA as their corresponding fundus (29). In our group, we did not perform systematic measurements of retinal layers anterior of Bruch’s membrane in cRORA lesions.
Given the shape of the implant, we explored if there was any difference between changes in retinal thickness measured across the central part of the implant (inner sectors) versus the edge of the implant (outer sectors). We detected no significant changes in retinal thickness across the central part of the implant versus the outer edges of the implant from 3 to 36 months. This observation supports the hypothesis that the retina on inner and outer sectors of the implant are equally supplied with nutrition and oxygen, because a lack of supply would probably lead to differences between central and outer regions of the implant. There was no significant thinning of the retina at the edge (outer sector) of the implant compared to the central (inner sector) part of the implant from 3 to 36 months of follow-up.
Limitations in our study include a small sample size and high variability of the retinal thickness in patients with geographic atrophy. We were unable to exactly register and track the OCT volume scans before and after implantation as these contained artefact of a strong reflection from the implant. Therefore, we used the validated software to manually register the implant areas and measure retinal thickness. The fact that a single surgeon carried out all the operations helped reduce the variability of the surgical skills and techniques.
In conclusion, we report a decrease in retinal thickness above the implant by 30± 12μm during the first 3 months following surgery. The macular layers then remained stable up to 36 months with no adverse structural abnormality in patients with cRORA in dry AMD.
3. Acknowledgements
We thank the participating patients; the Pixium Vision team who designed, fabricated, and tested the PRIMA system; the Scientific and Medical Advisory Board of Pixium Vision for its guidance on the clinical trial design; and all the scientific, research and development, medical, and clinical research staff who continue the patient care, rehabilitation, and evaluation. Studies were supported by: Pixium Vision SA; the Sight Again project (via Structural R&D Projects for Competitiveness and Investment for the Future funding managed by BpiFrance) and the Clinical Investigation Center at the Quinze-Vingts National Hospital, which is supported in part by the Inserm-DGOS, France and by LabEx LIFESENSES (ANR-10-LABX-65) and IHU FOReSIGHT (ANR-18-IAHU-01) grants. J.A.S. is supported in part by the NIH CORE grant P30 EY08098, and by unrestricted grant from Research to Prevent Blindness, New York. Biomedical Research Centre at Moorfields Eye Hospital is acknowledged and supported in part by the National Institute for Health and Care Research, UK
References
- 1.Wong WL, Su X, Li X, et al. 2014. Global prevalence of age-related macular degeneration and disease burden projection for 2020 and 2040: a systematic review and meta-analysis Lancet. Glob. Health. 2 e106ee116. [DOI] [PubMed] [Google Scholar]
- 2.Friedman DS, Tomany SC, McCarty C, De Jong P 2004. Prevalence of age-related macular degeneration in the United States Arch. Ophthalmol. 122 564e572. [DOI] [PubMed] [Google Scholar]
- 3.Mazzoni F, Novelli E, Strettoi E 2008. Retinal ganglion cells survive and maintain normal dendritic morphology in a mouse model of inherited photoreceptor degeneration J. Neurosci. 28 14282–e14292 [DOI] [PMC free article] [PubMed] [Google Scholar]
- 4.Humayun MS, Prince M,deJuan E, et al. 1999. Morphometric analysis of the extramacular retina from postmortem eyes with retinitis pigmentosa Invest. Ophthalmol. Vis. Sci. 40 143e148. [PubMed] [Google Scholar]
- 5.Kim SY, Sadda S, Pearlman J, et al. 2002. Morphometric analysis of the macula in eyes with disciform age-related macular degeneration Retina. 22 471e477. [DOI] [PubMed] [Google Scholar]
- 6.Mathieson K, Loudin J, Goetz G, et al. 2012. Photovoltaic retinal prosthesis with high pixel density Nat. Photonics. 6 391e397. [DOI] [PMC free article] [PubMed] [Google Scholar]
- 7.Lorach H, Goetz G, Smith R, et al. 2015. Photovoltaic restoration of sight with high visual acuity Nat. Med. 21 476e482. [DOI] [PMC free article] [PubMed] [Google Scholar]
- 8.Goetz GA, Mandel Y, Manivanh R, et al. 2013. Holographic display system for restoration of sight to the blind J. Neural. Eng. 10(5) 056021. [DOI] [PMC free article] [PubMed] [Google Scholar]
- 9.Ho E, Smith R, Goetz G, et al. 2017. Spatiotemporal characteristics of retinal response to network-mediated photovoltaic stimulation J. Neurophysiol. 119 389e400. [DOI] [PMC free article] [PubMed] [Google Scholar]
- 10.Ho E, Lorach H, Goetz G, et al. 2018. Temporal structure in spiking patterns of ganglion cells defines perceptual thresholds in rodents with subretinal prosthesis Sci. Rep. UK. 8 3145. [DOI] [PMC free article] [PubMed] [Google Scholar]
- 11.Palanker D, Le Mer Y, Mohand-Said S, Muqit M. and Sahel J A 2020. Photovoltaic restoration of central vision in atrophic age-related macular degeneration Ophthalmology. 127 1097–1104 [DOI] [PMC free article] [PubMed] [Google Scholar]
- 12.Humayun MS, Dorn JD, Ashish K. Ahuja AK et al. 2009 Preliminary 6 Month Results from the Argus™ II Epiretinal Prosthesis Feasibility Study Conf. Proc. IEEE. Eng. Med. Biol. Soc. 2009. 4566–4568 [DOI] [PMC free article] [PubMed] [Google Scholar]
- 13.Stingl K, Bartz-Schmidt KU, Besch D, Braun A., Bruckmann A, Gekeler F, et al. 2013. Artificial vision with wirelessly powered subretinal electronic implant alpha-IMS Proc. Biol. Sci. 280 20130077. [DOI] [PMC free article] [PubMed] [Google Scholar]
- 14.Stingl K, Schippert R, Bartz-Schmidt KU et al. 2017. Interim Results of a Multicenter Trial with the New Electronic Subretinal Implant Alpha AMS in 15 Patients Blind from Inherited Retinal Degenerations Front. Neurosci. 11 445. [DOI] [PMC free article] [PubMed] [Google Scholar]
- 15.Muqit MMK, Velikay-Parel M, Weber M, Dupeyron, Audemard D, Corcostegui, Sahel J and Le Mer Y 2019. Six Months Safety and Efficacy of the IRIS (IRIS II Intelligent Retinal Implant System) in Retinitis Pigmentosa Ophthalmology. 126(4) 637–639 [DOI] [PubMed] [Google Scholar]
- 16.Titchener SA, Nayagam DAX, Kvansakul J, Kolic M, Baglin EK, Abbott CJ, McGuinness MB, Ayton LA, Luu CD, Greenstein S, Kentler WG, Shivdasani MN, Allen PJ, and Petoe MA 2022. A Second-Generation (44-Channel) Suprachoroidal Retinal Prosthesis: Long-Term Observation of the Electrode–Tissue Interface Transl. Vis. Sci. Technol. 11(6) 12. [DOI] [PMC free article] [PubMed] [Google Scholar]
- 17.Gregori NZ, Natalia F. Callaway NF, Catherine Hoeppner C et al. 2018. Retinal Anatomy and Electrode Array Position in Retinitis Pigmentosa Patients after Argus II Implantation: an International Study Am. J. Ophthalmol. 193 87–99 [DOI] [PMC free article] [PubMed] [Google Scholar]
- 18.Palanker D, Le Mer Y, Mohand-Said S, Sahel JA 2022. Simultaneous perception of prosthetic and natural vision in AMD patients Nat. Commun. 13(1) 513. [DOI] [PMC free article] [PubMed] [Google Scholar]
- 19.Sadda SR, Guymer R, Holz FG, Schmitz-Valckenberg S, Curcio CA, Bird AC, Blodi BA, Bottoni F, Chakravarthy U, Chew EY, Csaky K, Danis RP, Fleckenstein M, Freund KB, Grunwald J, Hoyng CB, Jaffe GJ, Liakopoulos S, Monés JM, Pauleikhoff D, Rosenfeld PJ, Sarraf D, Spaide RF, Tadayoni R, Tufail A, Wolf S, and Staurenghi G 2018. Consensus Definition for Atrophy Associated with Age-Related Macular Degeneration on OCT: Classification of Atrophy Report 3. Ophthalmology. 125(4) 537–548 [DOI] [PMC free article] [PubMed] [Google Scholar]
- 20.Lenth and Russell V 2022. Emmeans: Estimated Marginal Means, Aka Least-Squares Means. https://CRAN.R-project.org/package=emmeans
- 21.R Core Team. 2019. R: A Language and Environment for Statistical Computing. Vienna, Austria: R Foundation for Statistical Computing. https://www.R-project.org/ [Google Scholar]
- 22.Pinheiro J and Bates D 2006. Mixed-Effects Models in S and S-Plus. Springer Science & Business Media [Google Scholar]
- 23.Menke MN, Kowal JH, Dufour P, et al. 2014. Retinal layer measurements after successful macula-off retinal detachment repair using optical coherence tomography Invest. Ophthalmol. Vis. Sci. 55 6575–6579 [DOI] [PubMed] [Google Scholar]
- 24.Faude F, Francke M, Makarov F, et al. 2002. Experimental retinal detachment causes widespread and multilayered degeneration in rabbit retina. J. Neurocytol. 30 379–390 [DOI] [PubMed] [Google Scholar]
- 25.Rizzo S, Cinelli L, Finocchio L, Tartaro R, Santoro F and Gregori NZ 2019. Assessment of Postoperative Morphologic Retinal Changes by Optical Coherence Tomography in Recipients of an Electronic Retinal Prosthesis Implant JAMA. Ophthalmol. 137(3) 272–278 [DOI] [PMC free article] [PubMed] [Google Scholar]
- 26.Pfau M, von der Emde L, de Sisternes L, Hallak JA, Leng T, Schmitz-Valckenberg S, Holz FG, Fleckenstein M and Rubin DL 2020. Progression of Photoreceptor Degeneration in Geographic Atrophy Secondary to Age-related Macular Degeneration. JAMA. Ophthalmol. 138(10) 1026–1034 [DOI] [PMC free article] [PubMed] [Google Scholar]
- 27.Ebneter A, Jaggi D, Abegg M, Wolf S, Zinkernagel MS 2016. Relationship Between Presumptive Inner Nuclear Layer Thickness and Geographic Atrophy Progression in Age-Related Macular Degeneration. Invest Ophthalmol Vis Sci. 57(9) 299–306 [DOI] [PubMed] [Google Scholar]
- 28.Zhang Q, Shi Y, Shen M, Cheng Y, Zhou H, Feuer W, de Sisternes L, Gregori G, Rosenfeld PJ, and Wang RK 2022. Does the Outer Retinal Thickness Around Geographic Atrophy Represent Another Clinical Biomarker for Predicting Growth? Am. J. Ophthalmol. S0002-9394(22)00317-8. doi: 10.1016/j.ajo.2022.08.012. Epub ahead of print. [DOI] [PubMed] [Google Scholar]
- 29.Wang DL, Agee J, Mazzola M, Sacconi R, Querques G, Weinberg AD, Smith RT 2019. Outer Retinal Thickness and Fundus Autofluorescence in Geographic Atrophy. Ophthalmol. Retina. 3(12) 1035–1044 [DOI] [PMC free article] [PubMed] [Google Scholar]


