Abstract
The relationship between Parkinson’s disease (PD) and urate or gout has attracted significant interest in recent years, but the results were conflicting. This dose-response meta-analysis aimed to estimate the correlation between urate levels or gout and the risk for PD. The Embase, PubMed, and Medline databases were searched for studies that investigated the relationship between the risk for PD and urate levels or gout. Random-effects or fixed-effects models were used to obtain pooled relative risks (RRs) and corresponding 95% confidence intervals (CIs). Fifteen studies, involving 449,816 participants and 14,687 cases in total, were included in the meta-analysis. High serum urate levels were associated with decreased risk for PD (RR 0.44 [95% CI 0.32–0.55]). Subgroup analysis according to sex revealed a neuroprotective effect of high urate levels against PD among females (0.68 [95% CI 0.43–0.93]) and males (0.49 [95% CI 0.34–0.64]). The risk for PD was lowered by 6% (0.94 [95% CI 0.90–0.98]) for each 1 mg/dl increase in serum urate level and reduced by 13% (0.87 [95% CI 0.80–0.95]) with each 2 mg/dl increase in serum urate level. However, gout was not closely correlated with the risk for PD (0.97 [95% CI 0.85–1.09]). Higher serum urate levels reduced the risk for PD, which was decreased by 6% (relative risk reduction) for each 1 mg/dl increase in serum urate levels. And the results indicated that urate may exert protective effects against the development of PD.
Subject terms: Parkinson's disease, Risk factors, Parkinson's disease
Introduction
Parkinson’s disease (PD) has become the second most common neurodegenerative disease, and its incidence has increased dramatically in the past decade, imposing heavy health and economic burdens worldwide1,2. Because there is currently no effective cure for PD, it is particularly important to investigate the pathogenesis of PD to prevent its onset and progression. Although the pathological mechanisms of degeneration of dopaminergic neurons remain unclear, oxidative stress has been confirmed to play a crucial role3,4. Urate is a metabolite of purine and a natural antioxidant that reduces oxidative stress by removing reactive nitrogen and oxygen radicals in vivo and in vitro5,6. Therefore, urate may exert potential protective effects against the development of PD. In fact, some epidemiological studies have reported that individuals with hyperuricemia have lower risks for developing PD7–11. In contrast, however, other studies reported no significant correlation between high levels of urate and the risk for PD12,13.
Gout is a metabolic disorder associated with joint pain caused by elevated urate levels14. However, epidemiological studies have reported inconsistent results as to whether gout, such as hyperuricemia, is associated with a lower risk for PD15–19. Most previous studies included only single-sex participants and no dose-response analyses, which were not comprehensive and could not demonstrate the strength of the correlation between high urate levels and the risk for PD13,20.
Prompted by the conflicting results reported in the literature, a comprehensive meta-analysis of cohort studies was performed to explore the correlation between urate or gout and the risk for PD in both sexes. In addition, a dose-response meta-analysis was also performed to clarify the dose correlation between urate and the risk for PD.
Results
Literature search
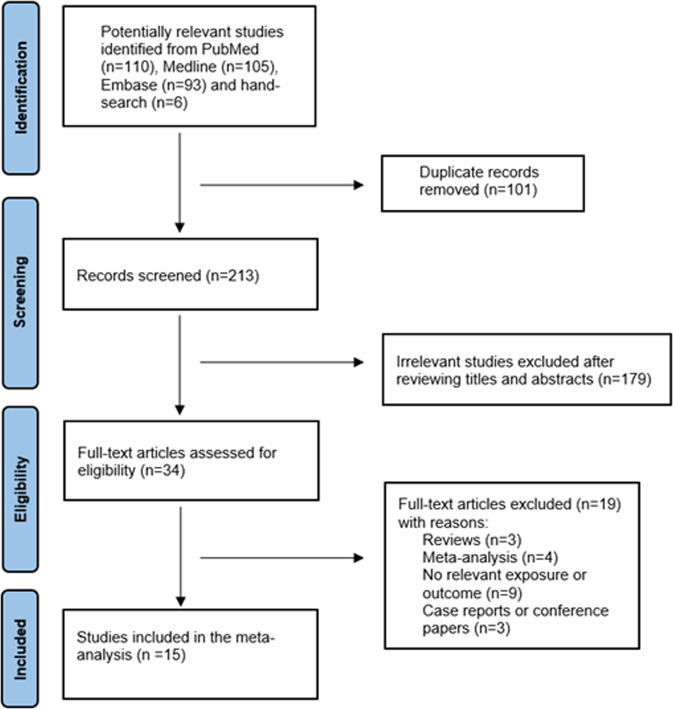
Study selection is illustrated in the flow-diagram presented in Fig. 1. A total of 308 potentially relevant studies were retrieved in the keyword literature search of the computerized databases; an additional 6 were identified through a manual search of the reference lists of these articles. Of 314 studies, 101 were excluded due to duplication, leaving 213 for initial screening of titles and abstracts, among which 179 irrelevant studies were excluded. For the remaining 34 studies, eligibility was accessed through full text reading and 19 did not meet the inclusion criteria. Therefore, 15 studies (all written in English) were ultimately included in this meta-analysis12,13,16–19,21–29.
Fig. 1. Flow diagram showing the selection process of articles.
15 studies were included in the meta-analysis.
Characteristics of the included studies
Seven studies investigating gout and the incidence of PD, and eight addressing urate concentration and the risk for PD, involving 449,816 participants and 14,687 cases in total, were identified (Table 1). Six studies were nested case-control studies while the other nine were cohort studies, in which the follow-up ranged from 2 to 24 years. Three studies did not differentiate between the sexes, seven described analyses separately according to sex, two included only males12,24, and one described analysis of females only13. Participant age ranged from 42.5 to 75.3 years. Aside from sex and age, adjustment for confounders included smoking, alcohol, caffeine, body mass index (BMI) diabetes, and hypertension. The diagnostic criteria for PD, gout, or hyperuricemia were clearly defined in each study. Results of quality assessment according to the NOS (scored from 6 to 9 [mean, 7.5]), indicated that the quality of the included studies was generally good.
Table 1.
Characteristics of studies on correlation between high urate levels or gout and the risk of PD.
| First author, year | Country | Case/total | Gender | Age | Follow-up years | PD definition | Adjustment for confounders | Newcastle-Ottawa scale |
|---|---|---|---|---|---|---|---|---|
| Cohort study for gout and PD incidence | ||||||||
| De Vera, 200819 | Canada | 1182/67457 | M/W | 74.1 | 8 | The ICD-9 code | Age, sex, hypertension, diabetes, hyperlipidemia, COPD, Charlson comorbidity score, use of diuretics, and use of NSAIDs | Selection: 4 stars Comparability: 2 stars Outcome: 3 stars |
| Pakpoor, 201522 | England | 1568/217179 | Combined | 69.4 | 5 | The ICD 9 and 10 revision codes | Age, sex, calendar year of admission, region of residence, and socioeconomic status | Selection: 3 stars Comparability: 1 star Outcome: 2 stars |
| Singh, 201921 | US | 1129/21507 | Combined | 75.3 | 2.38 | ICD-9-CM diagnostic code | Age, sex, hypertension, hyperlipidemia, and statin use | Selection: 3 stars Comparability: 2 stars Outcome: 3 stars |
| Hu, 202017 | China | 339/7900 | M/W | 50 | 13.36 | A code: A221; ICD-9-CM code: 332 | Sex, age, urbanization, typical comorbidities, and monthly income | Selection: 3 stars Comparability: 2 stars Outcome: 2 stars |
| Case-control study for gout and PD incidence | ||||||||
| Alonso, 200718 | UK | 1052/6634 | M/W | 70.0/68.7 | 6 | Computer-recorded PD with confirmation of the related paper records | Age, sex, practice, year of enrollment in the GPRD, and smoking | Selection: 3 stars Comparability: 2 stars Outcome: 2 stars |
| Schernhammer, 201316 | Denmark | 4484/22416 | M/W | – | 7 | Diagnostic code and prescription of PD medication | Age, sex, and COPD | Selection: 3 stars Comparability: 1 star Outcome: 2 stars |
| Lai, 201423 | China | 3854/15416 | M/W | 75.0/74.0 | 10 | ICD-9 | Sex, age, diabetes, stroke, dementia, hyperlipidemia, depression, renal failure, head injury, hypertension, and polypharmacy | Selection: 3 stars Comparability: 1 star Outcome: 2 stars |
| Cohort study for urate and PD incidence | ||||||||
| Weisskopf, 200724 | US | 84/165 | M | 30–55 | 9 | Diagnostic validations for self-reported PD by treating neurologists or internists | Age, smoking, and caffeine intake | Selection: 3 stars Comparability: 2 stars Outcome: 2 stars |
| de Lau, 200525 | Netherlands | 68/4695 | Combined | 55– | 9.4 | Screened positive received a structural diagnostic workup | Age, sex, smoking, alcohol, dairy products, BMI | Selection: 3 stars Comparability: 2 stars Outcome: 3 stars |
| Davis, 199612 | US | 92/6851 | M | 45–68 | 24 | By neurologists or neurosurgeons | Age, smoking | Selection: 3 stars Comparability: 1 star Outcome: 2 stars |
| Chen, 200927 | US | 95/15036 | M/W | 45–64 | 17 | ICD diagnosis or self-reported PD with confirmation by movement disorder specialist | Age, sex, race, smoking, caffeine, BMI, alcohol, serum creatinine | Selection: 3 stars Comparability: 2 stars Outcome: 3 stars |
| Jain, 201128 | US | 154/5749 | M/W | 67–78 | 14 | Self-report, medication, and hospitalization records | Age, smoking, race, BMI, alcohol, creatinine, diabetes, hypertension, uricosurics, EKG | Selection: 4 stars Comparability: 2 stars Outcome: 3 stars |
| Case-control study for urate and PD incidence | ||||||||
| O’Reilly, 201013 | US | 101/504 | W | 68 | 14 | Self-reported PD with confirmation by treating physicians and movement disorder specialist | Age, smoking, and caffeine | Selection: 3 stars Comparability: 2 stars Outcome: 3 stars |
| Winquist, 201026 | US | 97/57040 | M/W | 18– | 2 | Self-reported PD and reported current use of a standard PD medication | Age, gender, smoking, BMI, alcohol | Selection: 4 stars Comparability: 2 stars Outcome: 3 stars |
| Gao, 201629 | US | 388/1267 | M/W | 30–79 | 24 | By treating neurologist/internists or movement disorder specialist | Age, smoking status, height, weight, presence of chronic diseases, and consumption of caffeinated coffee and alcohol, BMI | Selection: 3 stars Comparability: 2 stars Outcome: 3 stars |
Serum urate levels and the risk for PD
Pooled RR
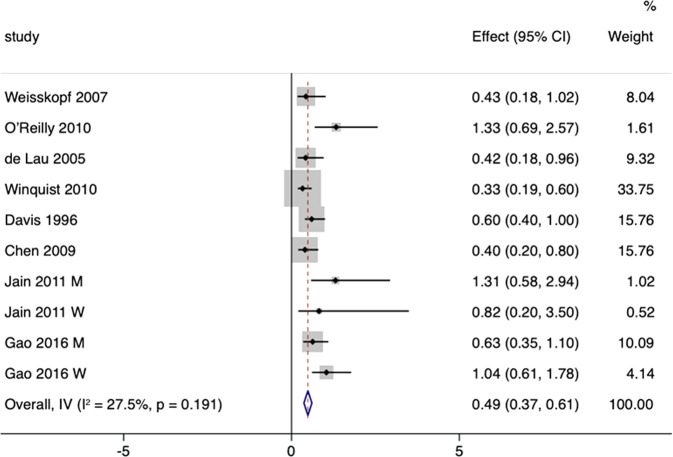
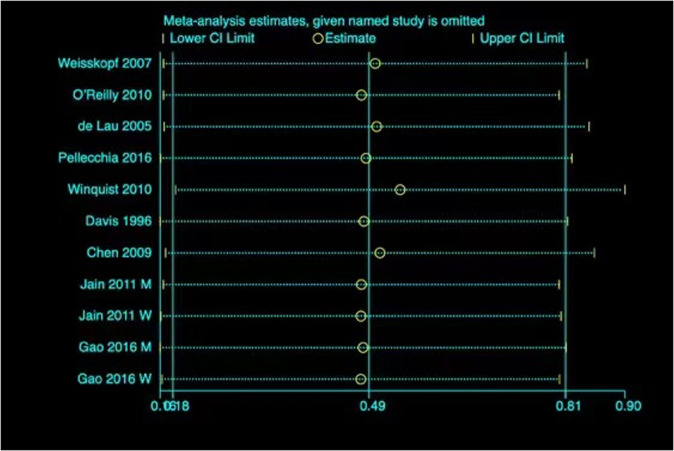
Eight studies including 91,307 participants and 1079 cases were included to assess the relationship between urate concentration and the risk for PD12,13,24–29. The pooled estimate using fixed-effects model was 0.49 (95% CI 0.37–0.61) with low heterogeneity (I² = 27.5%; p = 0.191) (Fig. 2). Begg’s test and funnel plot revealed no substantial publication bias (p = 0.152), while Egger’s test revealed publication bias (p = 0.008). The trim-and-fill method was applied, and the adjusted estimate was 0.44 (95% CI 0.32–0.55), indicating that high serum urate levels decreased the risk for PD. In sensitivity analysis, removing each study in turn did not substantially alter the pooled estimate (Fig. 3).
Fig. 2. RRs with 95% CIs from studies on the correlation between high urate concentration and risks of PD.
The adjusted pooled estimate was 0.44 (95% CI 0.32–0.55).
Fig. 3. Sensitivity analysis omitting one article in turn from the analyses on the correlation between high urate concentration and PD risks.
The vertical lines show the summary estimate (0.49) and its 95% CI (0.18–0.81) from the meta-analysis of all the articles.
Subgroup analysis
Subgroup analysis according to sex was performed to investigate whether high urate levels reduced the risk for PD differently for males and females (Fig. 4). Five studies were included for analyses of females and six for males. Compared with overall (RR 0.54 [95% CI 0.41–0.67]), the neuroprotective effect of high serum urate levels against PD existed in both females (RR 0.68 [95% CI 0.43–0.93]) and males (RR 0.49 [95% CI 0.34–0.64]), without significant heterogeneity (p = 0.187). Begg’s test and funnel plot revealed no substantial publication bias (p = 0.101), whereas Egger’s test revealed publication bias (p = 0.018), and the trim-and-fill method was applied.
Fig. 4. Subgroup analyses by sex on the correlation between urate concentration and PD risk.
RRs were 0.68 (95% CI 0.43–0.93) in females and 0.49 (95% CI 0.34–0.64) in males.
Dose-response analysis
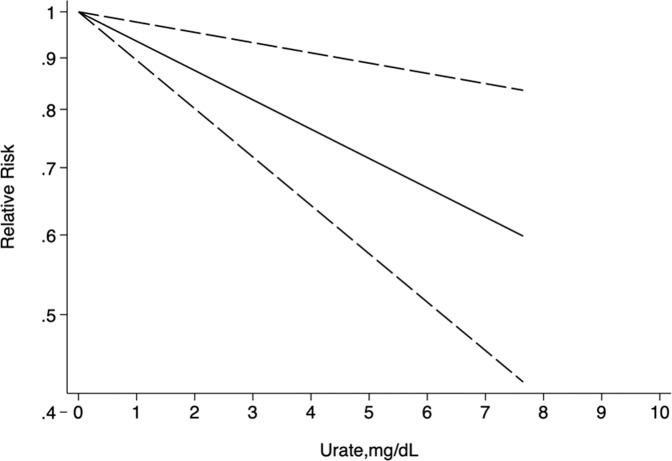
Data from five studies were used in the linear dose-response analysis of urate concentration and the risk for PD12,13,25,26,29. The nonlinear correlation between urate levels and the risk for PD was not significant (p = 0.209). Restricted cubic spline was used to model the linear dose-response correlation, which revealed a negative linear correlation between urate levels and the risk for PD (Fig. 5). The risk for PD was lowered by 6% (RR 0.94 [95% CI 0.90–0.98]) for each 1 mg/dl increase in urate level. Moreover, PD risk was further decreased by 13% (RR 0.87 [95% CI 0.80–0.95]) with each 2 mg/dl increase in serum urate level.
Fig. 5. Dose–response correlation between urate levels and PD risk.
Restricted cubic spline revealed a negative linear correlation.
Gout and the risk for PD
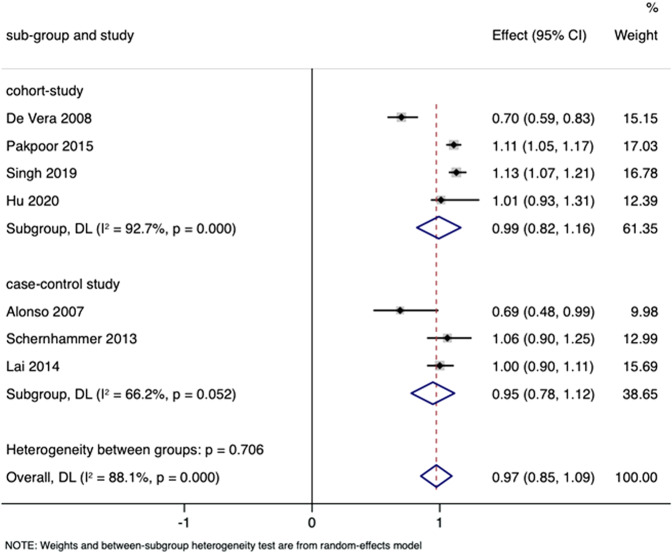
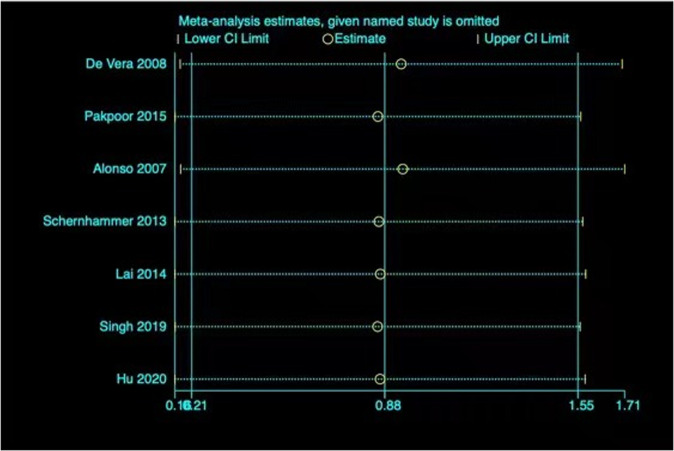
Four cohort studies and three nested case-control studies involving 358,509 participants and 13,608 cases were adopted into analyses of gout and the risk for PD16–19,21–23. The pooled RR in the random-effects model was 0.97 (95% CI 0.85–1.09) with high heterogeneity (I² = 88.1%; p = 0.000), indicating that gout was not closely correlated with the risk for PD (Fig. 6). Furthermore, the subgroup results of nested case-control studies (RR 0.95 [95% CI 0.78–1.12]) and cohort studies (RR 0.99 [95% CI 0.82–1.16]) were consistent with the overall result. No significant publication bias was evident according to Begg’s (p = 0.230) and Egger’s (p = 0.133) tests. Furthermore, the funnel plot displayed symmetry. The pooled estimates were substantially altered after excluding one study at a time (Fig. 7).
Fig. 6. RRs with 95% CIs from studies on the correlation between gout and PD risk.
The pooled estimate was 0.97 (95% CI 0.85–1.09).
Fig. 7. Sensitivity analysis omitting each study in turn from the analyses on the correlation between gout and the risk of PD.
The vertical lines show the summary estimate (0.88) and its 95% CI (0.21–1.55) from the meta-analysis of all the articles.
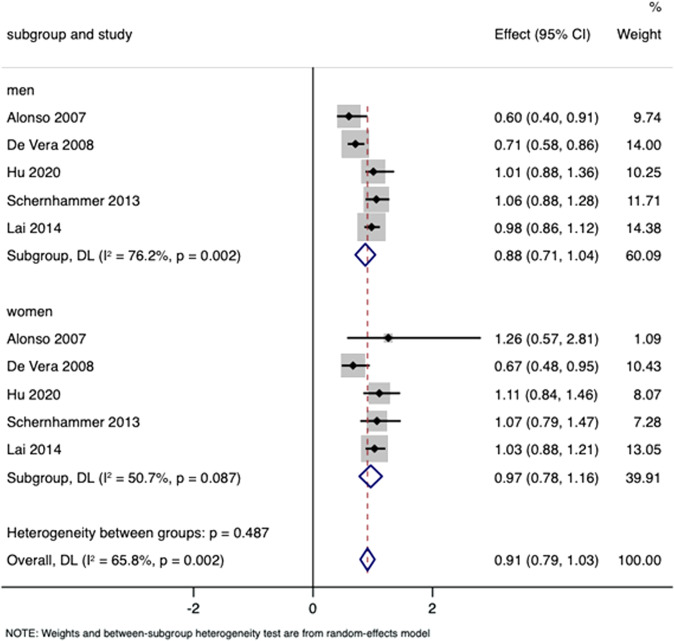
Five studies were included for subgroup analysis according to sex to explore whether gout was related to the risk for PD for only males or only females16–19,23. The pooled estimate for females was 0.97 (95% CI 0.78–1.16) and the pooled RR for males was 0.88 (95% CI 0.71–1.04), without substantial heterogeneity (p = 0.487) (Fig. 8). Publication bias was not evident according to Begg’s test (p = 0.721), Egger’s test (p = 0.682), and symmetrical funnel plots. The results do not suggest a strong relationship between gout and the risk for PD.
Fig. 8. Subgroup analyses by sex on the association between gout and PD risk.
RRs were 0.97 (95% CI 0.78–1.16) in females and 0.88 (95% CI 0.71–1.04) in males.
Discussion
The relationship between PD and urate or gout has attracted significant interest in recent years. However, published studies have reported conflicting results regarding these associations. A study by Jain28 reported that high urate levels were not associated with the reduction in risk for PD, while a meta-analysis by Shen10 indicated a 33% decrease in the risk for PD among participants with higher urate concentrations. Regarding the correlation between gout and risk for PD, a study by Alonso30 indicated that the risk for PD was lower among individuals with gout, whereas the study by Ungprasert15 reported that gout was not correlated with a lower risk for PD. To address the controversies in the existing literature, meta-analysis was the most reliable way to combine all the information.
Accordingly, we performed a meta-analysis of all eligible data including 449,816 participants and 14,687 cases from 15 studies. With the very large sample size, high quality of the studies, and high stability of the sensitivity analysis, results obtained in our meta-analysis were highly convincing. Our study found that high urate levels reduced the risk for PD. In the dose-response analysis, the risk for PD was reduced by 6% (relative risk reduction) for each 1 mg/dl increase in serum urate level. For each 2 mg/dl increase in serum urate level, the risk for PD was decreased by 13% (relative risk reduction).
In the analysis of gout and risk for PD, results revealed no strong correlation. Although gout is a metabolic disorder caused by prolonged hyperuricemia, the effect of gout on the risk for PD was not the same as the influence of high serum urate levels. A possible explanation is that patients with gout are likely to take medication that lowers the concentration of serum urate or undergo anti-inflammatory therapy, which may influence the risk for PD. Chen et al. conducted a meta-analysis to explore non-genetic risk factors for PD, and indicated that among non-steroidal anti-inflammatory drugs, aspirin intake increased the risk of PD (RR 1.12 [95% CI 1.01–1.23])31.
We also performed subgroup analysis of urate level according to sex and found that high serum urate levels reduced the risk for PD in both males and females. A study by Shen10 indicated that the neuroprotective effect of serum urate was evident in only males and not females. However, our study incorporated more comprehensive data and revealed that the neuroprotective effects of high urate levels also exist in females.
Oxidative damage, including lipid peroxidation and DNA damage, was evident in autopsy of brains with PD, suggesting that oxidative stress plays a vital role in the mechanisms of PD32. There are several hypotheses for why high urate levels lower the risk for PD. First, as the anion of uric acid, urate is a key antioxidant that can reduce oxidative damage through removing reactive oxygen species (ROS) and free radicals. Second, urate can chelate metal ions and reduce their ability of oxidize33. In an animal study, urate reduced oxidative stress in dopaminergic cells induced by iron34. Third, in addition to the reduction in ROS and radicals, potential mechanisms for the protective effect for neurons of urate include the maintenance of mitochondrial function and protection from apoptosis induced by dopamine. A previous study found the metabolism of dopamine causes oxidative damage in substantia nigra, which can be reduced by urate35.
Previous meta-analyses exploring the correlation between urate or gout and the risk for PD included a small number of studies and drew different conclusions. The studies by Shen and Gao indicated that males—but not females—with high serum urate levels had lower risks for PD10,29. The study by Alonso indicated that the risk for PD was lower among participants with gout, while the study by Ungprasert reported that gout was not associated with lower risks for PD15,18. Our study included more high-quality studies and we performed subgroup analyses. We found that both males and females with high urate levels exhibited lower risks for PD. We also performed dose-response analyses to illustrate the extent to which high serum urate concentrations reduce the risk for PD more precisely.
The present meta-analysis had some strengths. First, we searched the Embase, PubMed, and Medline databases and included 15 prospective studies with a very large number of participants from different countries, which enabled us to comprehensively identify correlations and reduce potential sample error. Second, the studies we included were of high quality according to the NOS, which meant that results of our meta-analysis are highly reliable. Third, we performed a dose-response analysis and generated linear dose-response curves, which provided a quantitative estimation and an intuitive plot of the correlation between high urate levels and the risk for PD. Fourth, compared to previous single-sex or mixed-sex studies, we performed separate subgroup analyses according to sex and found the neuroprotective effect of serum urate exists among both males and females.
However, there were limitations to our study. First, although all the included studies controlled for confounding factors, the adjusted confounders were different in each study. Because there is still much to explore about PD, there may be residual confounders that have an impact on the results. Second, we could not exclude the presence of publication bias in this study, although Begg’s test revealed little publication bias and we applied the trim-and-fill method. Third, heterogeneity was high in the gout analysis, which may have influenced the interpretation of the results. Fourth, the number of studies investigating the correlation between urate or gout and the risk for PD is not large, and only part of the studies was included due to the rigorous inclusion criteria of our meta-analysis.
The neuroprotective effect of high urate levels for PD has potentially important implications for prevention. The concentration of urate can be increased by intake of a purine-rich diet or administration of inosine36, which is the precursor of purine and has already been used for the clinical treatment of multiple sclerosis37. Schwarzschild et al. conducted the SURE-PD3 randomized clinical trial, and identified that treatment with inosine did not lead to a significant difference compared with placebo in the disease progression among patients recently diagnosed with PD38. The results did not recognize inosine as a treatment for early PD. However, Shen’s study reported that the progression of PD was slow among patients with high serum urate levels10. Future studies with larger sample sizes are needed to further clarify the link between adenosine or high urate concentrations and PD progression. Besides, high serum urate level is a risk factor for hypertension, stroke, cardiovascular and metabolic diseases, such as diabetes mellitus39–42, which means it is important to weigh the benefits of lowering the risk for PD and adverse effects and maintain the concentration of serum urate in a suitable range. In future studies, the effect of urate on the risk for PD will be further confirmed, and a potentially new avenue will be provided for the treatment of PD.
In conclusion, results of the present meta-analysis indicated that high serum urate levels reduced the risk for PD and, in the dose-response analysis, the risk for PD was reduced by 6% (relative risk reduction) for each 1 mg/dl increment in serum urate level. Our results indicated that urate may exert protective effects against the development of PD. And gout did not have a significant correlation with a lower risk of PD. More detailed studies investigating the effects of high urate levels or gout on PD are needed to warrant.
Methods
Literature search strategy
This study is reported in accordance with the Preferred Reporting Items for Systematic Reviews and Meta-Analyses (i.e., PRISMA) and Meta-Analysis of Observational Studies in Epidemiology (i.e., MOOSE) guidelines43,44. The PubMed, Medline, and Embase databases were searched for relevant studies published before March 2022, without language or country restrictions. The MeSH terms “urate”, “uric acid” or “hyperuricemia”, “gout”, “cohort”, “prospective” “incidence”, “risk” “follow up” and “Parkinson’s disease” were used in the literature search. Boolean operators were used in this way: (“urate” OR “uric acid” OR “hyperuricemia”) AND “Parkinson’s disease” AND (“cohort” OR “prospective” OR “incidence” OR “risk” OR “follow up”). The reference lists of the retrieved articles and correlative reviews were also manually searched for other potentially eligible studies.
Selection criteria
To be included in the meta-analysis, studies must have fulfilled the following criteria: reported diagnostic criteria for PD; hyperuricemia and gout clearly stated; published in peer-reviewed journals; cohort or case-control studies assessing the correlation between urate or gout and the risk for PD; and relative risks (RRs) or odds ratios (ORs) with corresponding 95% confidence intervals (CIs) could be obtained. For the dose-response analysis, the concentrations of serum urate were required and divided into ≥ 3 groups of different levels.
The quality of the included studies was evaluated according to the Newcastle-Ottawa Scale (NOS) in terms of selection, comparability, and outcome45. The NOS scores nine stars at most, and studies scoring no less than six stars were considered to be of high-quality.
Data extraction
The following data were independently extracted from the articles by two reviewers using a standardized data form: first author’s last name; publication year; region of study; study population; mean age; sex distribution; follow-up; number of cases; definition of outcome; adjusted confounders; serum levels of urate; and corresponding risk estimates and 95% CI. The result adjusted by the most confounders was chosen in the study with several adjusted models. Disagreements were resolved by consensus discussion.
Statistical analysis
Some studies used international units (μmol/liter) to report uric acid levels, which were converted to traditional units (mg/dl) using 1 mg/dl = 59.48 μmol/l. RRs with corresponding 95% CIs were used to explore the correlation between urate level or gout and the risk for PD. The lowest level of serum urate was regarded to be the reference value, and serum levels of urate in each group are expressed as mean concentration. If a level group had upper and lower bounds, the average value of both bounds was calculated as the mean concentration of the group. For the group without a lower or upper bound, the mean concentration was the upper or lower boundary plus or minus one-half the range of the closest group.
Data analysis was performed using Stata version 15.1 (Stata Corp LLC, College Station, TX, USA) and differences with a two-sided P < 0.05 were considered to be statistically significant. Heterogeneity was evaluated using the I² statistic and Cochran’s Q statistic46. An I² < 50% suggested no obvious heterogeneity and the adjusted RR was pooled using the fixed-effects model. Otherwise, pooled estimates based on the random-effects model under the condition that substantial heterogeneity existed (i.e., I² > 50%)47. Subgroup analysis was performed according to sex. Begg’s test and Egger’s test were performed to assess publication bias, in which p < 0.05 indicated statistically significant publication bias48,49. Asymmetrical funnel plots also suggested potential publication bias. When publication bias was indicated, the pooled estimate was adjusted using the “trim-and-fill” method50. Sensitivity analysis was performed to evaluate the stability of the result by removing one study at a time and calculating the pooled RRs of the other studies.
Generalized least squares regression was used to estimate the dose-response correlation between urate levels and the risk for PD, considering covariance for each exposure category among the different studies51,52. First, a linear association was assumed. RR estimates were calculated per mg/dl serum urate concentration increase and then pooled. Second, the restricted cubic spline model with three knots was applied to check for possible non-linear associations. The P values for non-linearity were obtained by testing the null hypothesis, for which the second spline’s coefficient was zero.
Reporting summary
Further information on research design is available in the Nature Research Reporting Summary linked to this article.
Supplementary information
Acknowledgements
This study was supported by Natural Science Foundation of Liaoning province of China (2019-MS-364) and the National Natural Science Foundation of China (81501006).
Author contributions
H.C.: conception, organization, literature search, data collection, statistical analysis, manuscript preparation, review, and critique. B.W.: literature search, data collection. Y.S.: literature search, data collection. R.Z.: conception, organization, literature search, statistical analysis, review, and critique
Data availability
The data used in this paper have been previously published, and details are reported in Table 1.
Competing interests
The authors declare no competing interests.
Footnotes
Publisher’s note Springer Nature remains neutral with regard to jurisdictional claims in published maps and institutional affiliations.
Supplementary information
The online version contains supplementary material available at 10.1038/s41531-022-00433-5.
References
- 1.Simon DK, Tanner CM, Brundin P. Parkinson disease epidemiology, pathology, genetics, and pathophysiology. Clin. Geriatr. Med. 2020;36:1–12. doi: 10.1016/j.cger.2019.08.002. [DOI] [PMC free article] [PubMed] [Google Scholar]
- 2.Bloem BR, Okun MS, Klein C. Parkinson’s disease. Lancet. 2021;397:2284–2303. doi: 10.1016/S0140-6736(21)00218-X. [DOI] [PubMed] [Google Scholar]
- 3.Schapira AH, Jenner P. Etiology and pathogenesis of Parkinson’s disease. Mov. Disord. 2011;26:1049–1055. doi: 10.1002/mds.23732. [DOI] [PubMed] [Google Scholar]
- 4.Trist BG, Hare DJ, Double KL. Oxidative stress in the aging substantia nigra and the etiology of Parkinson’s disease. Aging Cell. 2019;18:e13031. doi: 10.1111/acel.13031. [DOI] [PMC free article] [PubMed] [Google Scholar]
- 5.Ya BL, et al. Uric acid protects against focal cerebral ischemia/reperfusion-induced oxidative stress via activating Nrf2 and regulating neurotrophic factor expression. Oxid. Med. Cell Longev. 2018;2018:6069150. doi: 10.1155/2018/6069150. [DOI] [PMC free article] [PubMed] [Google Scholar]
- 6.Bowman GL, Shannon J, Frei B, Kaye JA, Quinn JF. Uric acid as a CNS antioxidant. J. Alzheimers Dis. 2010;19:1331–1336. doi: 10.3233/JAD-2010-1330. [DOI] [PMC free article] [PubMed] [Google Scholar]
- 7.Cortese M, Riise T, Engeland A, Ascherio A, Bjornevik K. Urate and the risk of Parkinson’s disease in men and women. Parkinsonism Relat. Disord. 2018;52:76–82. doi: 10.1016/j.parkreldis.2018.03.026. [DOI] [PubMed] [Google Scholar]
- 8.Ascherio A, et al. Urate as a predictor of the rate of clinical decline in Parkinson disease. Arch. Neurol. 2009;66:1460–1468. doi: 10.1001/archneurol.2009.247. [DOI] [PMC free article] [PubMed] [Google Scholar]
- 9.Wen M, et al. Serum uric acid levels in patients with Parkinson’s disease: a meta-analysis. PLoS One. 2017;12:e0173731. doi: 10.1371/journal.pone.0173731. [DOI] [PMC free article] [PubMed] [Google Scholar]
- 10.Shen C. Serum urate and the risk of Parkinson’s disease: Results from a meta-analysis. Can. J. Neurol. 2013;40:73–9. doi: 10.1017/s0317167100012981. [DOI] [PubMed] [Google Scholar]
- 11.Zhang HN, et al. Lower serum UA levels in Parkinson’s disease patients in the Chinese population. Neurosci. Lett. 2012;514:152–155. doi: 10.1016/j.neulet.2012.02.077. [DOI] [PubMed] [Google Scholar]
- 12.Davis JW, et al. Observations on serum uric acid levels and the risk of idiopathic Parkinson’s disease. Am. J. Epidemiol. 1996;144:480–484. doi: 10.1093/oxfordjournals.aje.a008954. [DOI] [PubMed] [Google Scholar]
- 13.O’Reilly EJ, et al. Plasma urate and Parkinson’s disease in women. Am. J. Epidemiol. 2010;172:666–670. doi: 10.1093/aje/kwq195. [DOI] [PMC free article] [PubMed] [Google Scholar]
- 14.Dalbeth N, Merriman TR, Stamp LK. Gout. Lancet. 2016;388:2039–2052. doi: 10.1016/S0140-6736(16)00346-9. [DOI] [PubMed] [Google Scholar]
- 15.Ungprasert P, Srivali N, Thongprayoon C. Gout is not associated with a lower risk of Parkinson’s disease: A systematic review and meta-analysis. Parkinsonism Relat. Disord. 2015;21:1238–1242. doi: 10.1016/j.parkreldis.2015.08.030. [DOI] [PubMed] [Google Scholar]
- 16.Schernhammer E, et al. Gout and the risk of Parkinson’s disease in Denmark. Eur. J. Epidemiol. 2013;28:359–360. doi: 10.1007/s10654-013-9791-1. [DOI] [PMC free article] [PubMed] [Google Scholar]
- 17.Hu LY, et al. Risk of Parkinson’s disease following gout: a population-based retrospective cohort study in Taiwan. BMC Neurol. 2020;20:338. doi: 10.1186/s12883-020-01916-9. [DOI] [PMC free article] [PubMed] [Google Scholar]
- 18.Alonso A, Rodriguez LA, Logroscino G, Hernan MA. Gout and risk of Parkinson disease: a prospective study. Neurology. 2007;69:1696–1700. doi: 10.1212/01.wnl.0000279518.10072.df. [DOI] [PubMed] [Google Scholar]
- 19.De Vera M, et al. Gout and the risk of Parkinson’s disease: a cohort study. Arthritis Rheum. 2008;59:1549–1554. doi: 10.1002/art.24193. [DOI] [PubMed] [Google Scholar]
- 20.Gao X, et al. Diet, urate, and Parkinson’s disease risk in men. Am. J. Epidemiol. 2008;167:831–838. doi: 10.1093/aje/kwm385. [DOI] [PMC free article] [PubMed] [Google Scholar]
- 21.Singh JA, Cleveland JD. Gout and the risk of Parkinson’s disease in older adults: a study of U.S. Medicare data. BMC Neurol. 2019;19:4. doi: 10.1186/s12883-018-1234-x. [DOI] [PMC free article] [PubMed] [Google Scholar]
- 22.Pakpoor J, Seminog OO, Ramagopalan SV, Goldacre MJ. Clinical associations between gout and multiple sclerosis, Parkinson’s disease and motor neuron disease: record-linkage studies. BMC Neurol. 2015;15:16. doi: 10.1186/s12883-015-0273-9. [DOI] [PMC free article] [PubMed] [Google Scholar]
- 23.Lai S-W, Lin C-H, Lin C-L, Liao K-F. Gout and Parkinson’s disease in older people: An observation in Taiwan. Int. J. Gerontol. 2014;8:166–167. [Google Scholar]
- 24.Weisskopf MG, O’Reilly E, Chen H, Schwarzschild MA, Ascherio A. Plasma urate and risk of Parkinson’s disease. Am. J. Epidemiol. 2007;166:561–567. doi: 10.1093/aje/kwm127. [DOI] [PMC free article] [PubMed] [Google Scholar]
- 25.de Lau LM, Koudstaal PJ, Hofman A, Breteler MM. Serum uric acid levels and the risk of Parkinson disease. Ann. Neurol. 2005;58:797–800. doi: 10.1002/ana.20663. [DOI] [PubMed] [Google Scholar]
- 26.Winquist A, Steenland K, Shankar A. Higher serum uric acid associated with decreased Parkinson’s disease prevalence in a large community-based survey. Mov. Disord. 2010;25:932–936. doi: 10.1002/mds.23070. [DOI] [PubMed] [Google Scholar]
- 27.Chen H, Mosley TH, Alonso A, Huang X. Plasma urate and Parkinson’s disease in the Atherosclerosis Risk in Communities (ARIC) study. Am. J. Epidemiol. 2009;169:1064–1069. doi: 10.1093/aje/kwp033. [DOI] [PMC free article] [PubMed] [Google Scholar]
- 28.Jain S, et al. The risk of Parkinson disease associated with urate in a community-based cohort of older adults. Neuroepidemiology. 2011;36:223–229. doi: 10.1159/000327748. [DOI] [PMC free article] [PubMed] [Google Scholar]
- 29.Gao X, O’Reilly EJ, Schwarzschild MA, Ascherio A. Prospective study of plasma urate and risk of Parkinson disease in men and women. Neurology. 2016;86:520–526. doi: 10.1212/WNL.0000000000002351. [DOI] [PMC free article] [PubMed] [Google Scholar]
- 30.Alonso A, Sovell KA. Gout, hyperuricemia, and Parkinson’s disease: a protective effect? Curr. Rheumatol. Rep. 2010;12:149–155. doi: 10.1007/s11926-010-0083-4. [DOI] [PubMed] [Google Scholar]
- 31.Chen Y, et al. Non-genetic risk factors for Parkinson’s disease: An overview of 46 systematic reviews. J. Parkinsons Dis. 2021;11:919–935. doi: 10.3233/JPD-202521. [DOI] [PMC free article] [PubMed] [Google Scholar]
- 32.Jenner P. Oxidative stress and Parkinson’s disease. Handb Clin Neurol. 2007;83:507–520. doi: 10.1016/S0072-9752(07)83024-7. [DOI] [PubMed] [Google Scholar]
- 33.Ames BN, Cathcart R, Schwiers E, Hochstein P. Uric acid provides an antioxidant defense in humans against oxidant- and radical-caused aging and cancer: a hypothesis. Proc. Natl Acad. Sci. USA. 1981;78:6858–6862. doi: 10.1073/pnas.78.11.6858. [DOI] [PMC free article] [PubMed] [Google Scholar]
- 34.Duan W, et al. Dietary folate deficiency and elevated homocysteine levels endanger dopaminergic neurons in models of Parkinson’s disease. J. Neurochem. 2002;80:101–110. doi: 10.1046/j.0022-3042.2001.00676.x. [DOI] [PubMed] [Google Scholar]
- 35.Guerreiro S, et al. Protection of midbrain dopaminergic neurons by the end-product of purine metabolism uric acid: potentiation by low-level depolarization. J. Neurochem. 2009;109:1118–1128. doi: 10.1111/j.1471-4159.2009.06040.x. [DOI] [PubMed] [Google Scholar]
- 36.Aihemaitijiang, S. et al. The association between purine-rich food intake and hyperuricemia: A cross-sectional study in Chinese adult residents. Nutrients10.3390/nu12123835 (2020). [DOI] [PMC free article] [PubMed]
- 37.Spitsin S, et al. Inactivation of peroxynitrite in multiple sclerosis patients after oral administration of inosine may suggest possible approaches to therapy of the disease. Mult. Scler. 2001;7:313–319. doi: 10.1177/135245850100700507. [DOI] [PubMed] [Google Scholar]
- 38.Parkinson Study Group S-PDI, et al. Effect of urate-elevating inosine on early Parkinson disease progression: The SURE-PD3 randomized clinical trial. JAMA. 2021;326:926–939. doi: 10.1001/jama.2021.10207. [DOI] [PMC free article] [PubMed] [Google Scholar]
- 39.Nam GE, et al. Metabolic syndrome and risk of Parkinson disease: a nationwide cohort study. PLoS Med. 2018;15:e1002640. doi: 10.1371/journal.pmed.1002640. [DOI] [PMC free article] [PubMed] [Google Scholar]
- 40.Borghi C, et al. Hyperuricaemia and gout in cardiovascular, metabolic and kidney disease. Eur. J. Intern. Med. 2020;80:1–11. doi: 10.1016/j.ejim.2020.07.006. [DOI] [PubMed] [Google Scholar]
- 41.Bos MJ, Koudstaal PJ, Hofman A, Witteman JC, Breteler MM. Uric acid is a risk factor for myocardial infarction and stroke: the Rotterdam study. Stroke. 2006;37:1503–1507. doi: 10.1161/01.STR.0000221716.55088.d4. [DOI] [PubMed] [Google Scholar]
- 42.Kim W, et al. Age and sex dependent association of uric acid and incident hypertension. Nutr. Metab. Cardiovasc. Dis. 2021;31:1200–1208. doi: 10.1016/j.numecd.2020.12.015. [DOI] [PubMed] [Google Scholar]
- 43.Page MJ, et al. The PRISMA 2020 statement: an updated guideline for reporting systematic reviews. BMJ. 2021;372:n71. doi: 10.1136/bmj.n71. [DOI] [PMC free article] [PubMed] [Google Scholar]
- 44.Stroup DF, et al. Meta-analysis of observational studies in epidemiology: a proposal for reporting. Meta-analysis of observational studies in epidemiology (MOOSE) group. JAMA. 2000;283:2008–2012. doi: 10.1001/jama.283.15.2008. [DOI] [PubMed] [Google Scholar]
- 45.Stang A. Critical evaluation of the Newcastle-Ottawa scale for the assessment of the quality of nonrandomized studies in meta-analyses. Eur. J. Epidemiol. 2010;25:603–605. doi: 10.1007/s10654-010-9491-z. [DOI] [PubMed] [Google Scholar]
- 46.Higgins JP, Thompson SG, Deeks JJ, Altman DG. Measuring inconsistency in meta-analyses. BMJ. 2003;327:557–560. doi: 10.1136/bmj.327.7414.557. [DOI] [PMC free article] [PubMed] [Google Scholar]
- 47.DerSimonian R, Laird N. Meta-analysis in clinical trials. Controlled Clin. Trials. 1986;7:177–188. doi: 10.1016/0197-2456(86)90046-2. [DOI] [PubMed] [Google Scholar]
- 48.Begg CB, Mazumdar M. Operating characteristics of a rank correlation test for publication bias. Biometrics. 1994;50:1088–1101. [PubMed] [Google Scholar]
- 49.Egger M, Davey Smith G, Schneider M, Minder C. Bias in meta-analysis detected by a simple, graphical test. BMJ. 1997;315:629–634. doi: 10.1136/bmj.315.7109.629. [DOI] [PMC free article] [PubMed] [Google Scholar]
- 50.Duval S, Tweedie R. Trim and fill: A simple funnel-plot-based method of testing and adjusting for publication bias in meta-analysis. Biometrics. 2000;56:455–463. doi: 10.1111/j.0006-341x.2000.00455.x. [DOI] [PubMed] [Google Scholar]
- 51.Bagnardi V, Zambon A, Quatto P, Corrao G. Flexible meta-regression functions for modeling aggregate dose-response data, with an application to alcohol and mortality. Am. J. Epidemiol. 2004;159:1077–1086. doi: 10.1093/aje/kwh142. [DOI] [PubMed] [Google Scholar]
- 52.Orsini N, Li R, Wolk A, Khudyakov P, Spiegelman D. Meta-analysis for linear and nonlinear dose-response relations: examples, an evaluation of approximations, and software. Am. J. Epidemiol. 2012;175:66–73. doi: 10.1093/aje/kwr265. [DOI] [PMC free article] [PubMed] [Google Scholar]
Associated Data
This section collects any data citations, data availability statements, or supplementary materials included in this article.
Supplementary Materials
Data Availability Statement
The data used in this paper have been previously published, and details are reported in Table 1.


