

Abstract
Objectives
Kidney transplant (KT) is the most effective treatment for end‐stage renal disease. The immunosuppressant anti‐thymocyte globulin (ATG) has been applied for induction therapy to reduce the risk of acute transplant rejection for patients at high immunological risk. Despite its putative role in replicative stress during immune reconstitution, the effects of ATG on T‐cell immunosenescent changes remain to be understood.
Methods
Phenotypic and functional features of senescent T cells were examined by flow cytometry in 116 healthy controls (HC) and 95 KT patients for comparative analysis according to ATG treatment and CMV reactivation. The TCR repertoire was analysed in peripheral blood mononuclear cells (PBMCs) of KT patients.
Results
T cells of KT patients treated with ATG (ATG+) show typical immunosenescent features, accumulation of CD28−, CD85j+ or CD57+ T cells, and imbalance of functional T‐cell subsets, compared with untreated KT patients (ATG−). Plasma IL‐15 and CMV‐IgG levels were higher in KT patients than in HCs, and the IL‐15 level positively correlated with the frequency of CD28− T cells in KT patients. ATG+ patients had a higher prevalence of CMV reactivation, which is associated with an increased frequency of CD28− T cells. As a result, ATG+ patients had expanded CMV‐specific T cells and decreased TCR diversity. However, proliferation, cytokine‐producing capacity and polyfunctionality of T cells were preserved in ATG+ patients.
Conclusion
Our findings suggest that ATG treatment contributes to the accumulation of senescent T cells, which may have lifelong clinical implications in KT patients. Thus, these patients require long‐term and comprehensive immune monitoring.
Keywords: ATG, CD28‐ T cells, CMV, immunosenescence, kidney transplantation
In this study, we found that in kidney transplant (KT) patients, anti‐thymocyte globulin (ATG) treatment contributes to the accumulation of senescent T cells, which is likely to be associated with increased IL‐15 and CMV reactivation. T cells of ATG‐treated KT patients have senescence‐associated phenotypic changes and markedly shrunken oligoclonality, but relatively intact functionality. Our findings suggest that ATG treatment is associated with enhanced T‐cell senescence, which may have lifelong clinical implications in KT patients. Therefore, long‐term, comprehensive immune monitoring of these patients is necessary.

Introduction
A variety of immunosuppressive medication regimens, including steroids, calcineurin inhibitors (CNI), cytostatics, antibodies and anti‐thymocyte globulin (ATG), have been developed and used for the prevention and treatment of immune rejection in transplant patients. 1 For many decades, ATG has been applied to reduce the risk of acute rejection in solid organ and haematopoietic cell transplantation in patients at high immunological risk. 2 , 3 Polyclonal ATG is the purified immunoglobulin G (IgG) fraction of sera from rabbits or horses immunised with human T cells and their precursors, thymocytes. ATG induces immediate immune cell depletion, particularly T‐cell depletion, through several mechanisms including lysis and phagocytosis. 4 Following ATG‐mediated T‐cell depletion, intensive T‐cell immune reconstitution occurs over a short period, less than 6 months, 5 by repopulating the immune space via enhanced thymic output and robust homeostatic proliferation of residual memory T cells. 2 , 6 It has been reported that impaired CD4+ T‐cell reconstitution after ATG treatment represents a major cause of morbidity and mortality and results in increased late opportunistic infections and atherosclerotic events in kidney transplant recipients. 7 , 8 T‐cell reconstitution inescapably entails replicative stress and telomere erosion in T cells. 9 Since replicative stress is a potent driver of cellular senescence, increasing attention has been paid to immunosenescent changes of reconstituted T cells following ATG treatment in KT. However, only limited studies on this issue have been conducted.
Immunosenescence, which refers to the progressive deterioration of protective immunity with advancing age, contributes to aberrant immune responses with fundamental effects on health and survival in the elderly via enhanced incidence of inflammatory diseases and increased susceptibility to infections and cancers. 10 Immunosenescent features of T cells have been intensively investigated. 11 , 12 , 13 Phenotypically, senescent T cells are characterised by loss of CD28 expression and gain of several NK cell receptors (NKRs). 14 , 15 The accumulation of CD28− T cells has been considered a hallmark of age‐related changes in the human immune system. 16 , 17 Functionally, senescent T cells have reduced proliferative capacity upon T‐cell receptor (TCR) stimulation, 18 limited TCR diversity 19 and shorter telomere length. 20 By contrast, they have the ability to proliferate in an antigen‐independent manner in the presence of IL‐15 and to produce large quantities of proinflammatory cytokines and cytotoxic molecules, which is closely associated with many deleterious health‐related outcomes. 17 , 21 , 22 , 23 , 24 , 25 , 26 In addition to immunosenescence, exhaustion is also a dominant dysfunctional state of T cells in certain pathological conditions, including in chronic infections and cancers. 27 Exhausted T cells are characterised by the expression of several inhibitory receptors, such as PD‐1, CTLA‐4, Tim‐3 and LAG‐3. 27 Several studies have demonstrated that exhausted T cells are accumulated in the plaque and blood of patients with atherosclerosis and are associated with anti‐atherogenic cytokine production. 28 , 29 , 30 A large body of evidence suggests that cytomegalovirus (CMV) infection and its reactivation is a major driver contributing to the deterioration of T‐cell immunity with age, 31 probably via aberrant expansion of CMV‐specific T cells experiencing replicative stress. The incidence of CMV infection or reactivation is higher in immunocompromised transplant recipients. 32 Thus, considering the broad T‐cell depletion following ATG treatment, it needs to be understood how CMV reactivation impacts immunosenescent changes of reconstituted T cells in ATG‐treated kidney transplant (KT) recipients.
Recent studies have suggested that ATG is associated with accelerated immune senescence, influencing thymic output, altered T‐cell phenotype and telomere length/telomerase activity of T cells in KT recipients. 33 Furthermore, kidney failure is also associated with premature signs of immune ageing that are caused by a proinflammatory environment resulting from the accumulation of uremic toxins. 34 , 35 To broaden our knowledge of ATG‐mediated immunosenescent changes in reconstituted T cells in KT recipients, we investigated phenotypic and functional features of CD28− senescent T cells in KT patients by comparative analysis of ATG treatment (ATG+ vs. ATG−) and CMV reactivation (CMVReact vs. CMVNonreact). Our findings demonstrate that ATG treatment is associated with enhanced T‐cell senescence, consequently causing functional alteration of CD4+ T cells, which may have lifelong clinical implications in KT patients. Thus, long‐term follow‐up of ATG+ patients is necessary.
Results
Patient characteristics and clinical outcomes
The clinical characteristics of the patients are summarised in Table 1. The mean patient age was 50.2 years. Entry into the study was 66.8 ± 78.5 months after transplantation. Among patients, 22 patients received ATG, and 24 were diagnosed with CMV infection. In addition, 13 patients received ganciclovir or valganciclovir treatment.
Table 1.
Characteristics of kidney transplant (KT) patients
| Clinical manifestations | Kidney transplant cohort (N = 95) |
|---|---|
| Age (years old) | 50.2 ± 9.8 |
| Gender (N, %) | |
| Male | 60 (63.2%) |
| Female | 35 (36.8%) |
| Post‐transplant duration (months) | 66.8 ± 78.5 |
| Obesity | 13 (13.7%) |
| DM | |
| Pre‐KT DM | 11 (11.6%) |
| NODAT | 6 (6.32%) |
| Aetiology of renal disease | |
| No‐pretreatment biopsy (unknown) | 41 (43.2%) |
| DM nephropathy | 1 (1.1%) |
| Hypertensive nephropathy | 24 (25.3%) |
| Glomerulonephritis | 21 (22.1%) |
| Polycystic kidney disease | 5 (5.3%) |
| Others a | 2 (2.1%) |
| HLA matching | |
| 0 | 3 (3.2%) |
| 1 | 14 (14.7%) |
| 2 | 16 (16.8%) |
| 3 | 29 (30.5%) |
| 4 | 13 (137%) |
| 5 | 4 (1.2%) |
| 6 | 12 (12.6%) |
| CMV seropositivity (IgG) at KT | |
| Recipient | 80 (84.2%) |
| Donor | 77 (81.1%) |
| CMV infection | |
| Yes | 25 (26.3%) |
| No | 70 (73.7%) |
| Ganciclovir or valganciclovir treatment | |
| Yes | 13 (13.7%) |
| No | 82 (86.3%) |
| Donor type | |
| Living | 30 (31.6%) |
| Deceased | 61 (64.2%) |
DM, diabetes mellitus; NODAT, new onset DM after organ transplantation.
Tumors, infections.
Immunosenescent features of peripheral T cells of KT patients
To explore whether the recovery of kidney function and immunosuppressive regimen during KT affect immunosenescent changes, the phenotypic features of peripheral T cells of 95 KT patients were analysed. KT patients had a decreased frequency of CD4+ T cells and an increased frequency of CD8+ T cells and consequently, the ratio of CD4+ to CD8+ T cells (3.70 ± 3.02) was decreased in patients compared with age‐matched healthy controls (HCs; 5.61 ± 4.02) (Figure 1a and b). CD28+ T cells dwindle with advancing age and loss of CD28 is closely linked to the acquisition of CD57 and CD85j, which are associated with the modulation of functional activity. 14 , 15 We found that KT patients had higher frequencies of CD28−, CD57+ and CD85j+ subsets of both CD4+ and CD8+ T cells than HCs (Figure 1c and Supplementary figure 1a). The change in frequencies of functional T‐cell subsets, which are defined by the expression of CD45RA and CCR7 in humans, is well known as an age‐related feature of T cells. 36 In CD4+ T cells of KT patients, the frequency of the naive subset was diminished, whereas central memory (CM) and effector memory (EM) subsets were significantly expanded compared with HCs. Meanwhile, the frequency of EMRAs (effector memory cell re‐expressing CD45RA) was markedly increased in CD8+ T cells of KT patients (Figure 1d and Supplementary figure 1b). The accumulation of CD28− cells in both CD4+ and CD8+ T‐cell populations is not associated with time after kidney transplant (Figure 1e), implying that these cells expand in peripheral blood regardless of the postoperative condition of patients. These findings show that KT patients have a higher frequency of phenotypically senescent T cells than age‐matched controls, despite the fact that this study was conducted on patients at least 3 months post‐KT with stabilised kidney function.
Figure 1.

Kidney transplant (KT) patients have a higher frequency of phenotypically senescent T cells. Flow cytometry‐based phenotypic analysis of T cells in KT patients (n = 95) and age‐matched HCs (n = 116). (a, b) The frequency (%) of CD4+ and CD8+ T cells (a) and the ratio of CD4+ to CD8+ T cells (b) in KT patients and HCs. (c) The frequency (%) of CD28−, CD57+ and CD85j+ senescent cells in CD4+ and CD8+ T cells of KT patients and HCs. (d) The distribution of functional T‐cell subsets is defined by the expression pattern of CD45RA and CCR7 in CD4+ and CD8+ T cells. Naïve (CD45RA+CCR7+), central memory (CM: CD45RA−CCR7+), effector memory (EM: CD45RA−CCR7−) and CD45RA+ effector memory (EMRA: CD45RA+CCR7−). (e) Correlation between frequency (%) of CD28− T cells and post‐transplant period in KT patients (n = 95). Each data point represents an individual subject. Bar graphs show the mean ± sem. * P < 0.05, ** P < 0.01, *** P < 0.01, **** P < 0.0001 by the two‐tailed unpaired t‐test.
Enhanced immunosenescent changes in T cells following ATG treatment
To explore the mechanism underlying the immunosenescent change in T cells in KT patients, we examined the effect of various immunosuppressive agents on the increase in CD28− T cells in KT patients. Table 2 shows that of immunosuppressive agents, only anti‐thymocyte globulin (ATG) is associated with an increased frequency of CD28− T cells. Since the immunosuppressive activity of ATG likely results primarily from the depletion of both circulating T cells and T cells from secondary lymphoid organs, 3 , 37 , 38 reconstituted T cells in KT patients may be prone to immunosenescence because of extensive cell divisions. To test this idea, 95 KT patients from Figure 2 were subdivided into two groups according to ATG treatment [22 ATG‐treated (ATG+) KT patients and 73 without ATG treatment (ATG−)]. Re‐analysis of the data in Figure 1 revealed that the major immunosenescent features observed were attributable to ATG treatment (Figure 2a–c). Moreover, the ratio of CD4+ to CD8+ T cells was markedly decreased in ATG+ patients compared with ATG− patients (Figure 2b). The expansion of CD28− cells in both CD4+ and CD8+ T‐cell populations of ATG+ patients was more prominent than in ATG− patients (Figure 2c). ATG treatment led to an obvious shift in the distribution of functional T‐cell subsets from naive T cells to EM and EMRA in CD4+ and CD8+ T cells, respectively (Figure 2d). By contrast, frequencies of total CD4+, CD8+CD28− and naive CD8+ T cells were comparable between HC and ATG− patients (Figure 2a, c and d). Collectively, these data indicate that the immunosenescent features of T cells observed in KT patients are primarily attributed to ATG treatment.
Table 2.
Frequency of CD28− T‐cell by immunosuppressive regimens
| Immunosuppressive drugs | Treatment | N | Frequency of CD28− T cells (%, sd) | P‐value | |
|---|---|---|---|---|---|
| CD4 | CD8 | ||||
| Anti‐thymocyte globulin (ATG) | Treatment | 22 | 18.62 (11.58) | < 0.0001 | < 0.0001 |
| No treatment | 73 | 5.62 (6.064) | |||
| Anti‐IL‐2R antibody | Treatment | 63 | 7.948 (9.319) | 0.2953 | 0.1508 |
| No treatment | 11 | 11.21 (10.28) | |||
| Calcineurin inhibitors | Cyclosporine A | 18 | 6.618 (8.885) | 0.3471 | 0.0623 |
| Tacrolimus | 60 | 9.032 (9.666) | |||
| Anti‐metabolite agents | Mycophenolate mofetil | 48 | 7.888 (8.731) | 0.5868 | 0.4872 |
| Mycophenolate sodium | 18 | 9.172 (11.47) | 0.9519 | 0.3299 | |
| None | 13 | 9.409 (9.54) | |||
Figure 2.

Immunosenescent features of T cells in kidney transplant (KT) patients are mainly attributed to ATG treatment. KT patients in Figure 1 were categorised into two groups (ATG+, n = 22; ATG−, n = 73) according to ATG treatment, and the data were re‐analysed. (a, b) The frequency (%) of CD4+ and CD8+ T cells (a) and the ratio of CD4+ to CD8+ T cells (b) in ATG+ KT patients, ATG− KT patients and HCs. (c) Frequency (%) of CD28− T cells in CD4+ and CD8+ T cells in three groups. (d) Frequency of each functional T‐cell subset in CD4+ and CD8+ T cells in three groups. Bar graphs show the mean ± sem. * P < 0.05, ** P < 0.01, *** P < 0.001, ****P < 0.0001 by the two‐tailed unpaired t‐test.
Association of increased plasma IL‐15 with expanded CD28 − T cells in KT patients
IL‐15 promotes antigen‐independent expansion and survival of memory CD8+ T cells and more robustly, senescence of CD28− T cells. 21 , 39 , 40 , 41 Thus, IL‐15 may be involved in the repopulation of T cells and the expansion of senescent CD28− T cells in KT patients. Since IL‐15 signalling is provided to target cells by transpresentation via the membrane‐bound IL‐15/IL‐15Rα complex on monocytes and macrophages, 40 , 42 the concentration of IL‐15 in the plasma and the expression of IL‐15 receptor alpha (IL‐15Rα) on peripheral monocytes were compared between KT patients and HCs (Figure 3a and b and Supplementary figure 2). KT patients had a similar level of IL‐15Rα expression on monocytes, but a higher concentration (1.81 ± 0.89 pg mL−1) of plasma IL‐15 than HCs (0.89 ± 0.53 pg mL−1, P < 0.0001) (Figure 3a and b). However, no obvious increase in the concentration of plasma IL‐15 was observed between ATG+ and ATG− patients (Figure 3c). Of note, plasma IL‐15 positively correlated with the frequency of CD28− T cells in both CD4+ and CD8+ T cells of ATG− patients, whereas CD28− T cells were considerably expanded in ATG+ patients irrespective of plasma IL‐15 (Figure 3d).
Figure 3.

Increased plasma IL‐15 is correlated with the frequency of CD28− T cells in kidney transplant (KT) patients. (a) IL‐15 level in plasma of KT patients (n = 82) and HCs (n = 34) was quantified by ELISA. (b) Expression of IL‐15 receptor α (IL‐15Rα) on CD14+ monocytes of KT patients (n = 24) and HCs (n = 26) was analysed by flow cytometry. (c) IL‐15 level in plasma of ATG− (n = 45) and ATG+ (n = 21) KT patients. (d) Correlation analysis between frequency (%) of CD28− T cells and IL‐15 level in plasma of HCs (n = 31), ATG− (n = 61) and ATG+ (n = 21) KT patients. P‐values were obtained using the Pearson correlation analysis. Bar graphs show the mean ± sem. **** P < 0.0001 by the two‐tailed unpaired t‐test (a–c).
Contribution of CMV reactivation to increase in CD28 − T cells
Cytomegalovirus infection is known to induce immunosenescence in T cells because of repeated antigen stimulation over the extended course of infection. 15 , 43 , 44 Therefore, we next investigate whether CMV reactivation is associated with an increase in CD28− T cells in KT patients. Although all patients recruited in this study were CMV seropositive, only 25 patients experienced CMV viraemia (CMVReact) and 70 patients had no evidence of CMV reactivation (CMVNonreact) after KT. We found that the concentration of CMV‐specific IgG in plasma was significantly increased in KT patients compared with HCs (Figure 4a) and CMVReact patients had a higher frequency of CD28− T cells in both CD4+ and CD8+ T cells than CMVNonreact patients and HCs (Figure 4b). Flow cytometric analysis using HLA‐A*0201/CMV pp65495–504 (NLVPMVATV) pentamer illustrates that CMV pp65‐specific CD8+ T cells from KT patients have significantly increased proportions of CD28− or CD85j+ subsets compared with non‐CMV pp65‐specific CD8+ memory T cells. No such increase was observed in CD8+ T cells of HCs (Figure 4c and Supplementary figure 3). Because CMV reactivation tends to occur in the immunocompromised state, complete T‐cell depletion caused by ATG treatment is likely associated with CMV reactivation. As expected, only 14% of ATG− patients (10/73 patients) experienced CMV reactivation, while CMV reactivation occurred in 68% of ATG+ patients (15/22 patients) after KT (Figure 4d), showing that CMV reactivation occurs more frequently in patients following ATG treatment. However, there was no difference in the level of CMV‐IgG after ATG treatment or CMV reactivation (Figure 4e), nor was there a difference in IL‐15 levels following CMV reactivation (Supplementary figure 4). In addition, the frequency of CD28− T cells was not associated with the concentration of CMV‐IgG (Figure 4f). These data suggest that the accumulation of CD28− T cells is influenced by CMV reactivation, which occurs with increased frequency in KT patients after ATG treatment.
Figure 4.

ATG+ patients have a higher prevalence of CMV reactivation, which is associated with increased CD28− T cells. (a) The level (AU) of CMV‐specific antibodies (IgG) in plasma of kidney transplant (KT) patients (n = 53) and HCs (n = 27). (b) Frequency (%) of CD28− T cells in KT patients with or without CMV reactivation and HC (CMVReact, n = 25; CMVNonreact, n = 70; HCs, n = 116). (c) Frequency (%) of CD28− cells in CMV pp65‐specific and non‐CMV pp65‐specific CD8+ memory T cells of HLA‐A2+ HCs (n = 8) and HLA‐A2+ KT patients (n = 11). (d) Percentage of CMVReact in ATG+ and ATG− KT patients. (e) The level (AU) of CMV‐IgG in KT patients with or without ATG treatment [ATG+ (n = 12) vs. ATG− (n = 27) KT patients] and with or without CMV reactivation [CMVReact (n = 12) vs. CMVNonreact (n = 31)]. (f) Correlation analysis of the frequency (%) of CD28− T cells and the level of CMV‐IgG in plasma of KT patients (n = 53) and HCs (n = 27). Bar graphs show the mean ± sem. * P < 0.05, ** P < 0.01, *** P < 0.001, **** = P < 0.0001 by the two‐tailed unpaired t‐test.
T‐cell functional changes in ATG‐treated patients
To determine whether the ATG‐mediated senescent changes in T cells cause functional changes, we first examined the proliferative capacity of T cells upon stimulation with anti‐CD3 Ab or IL‐15. A CFSE dilution assay revealed reduced proliferation of CD8+ T cells in ATG+ patients in response to TCR stimulation compared with those of ATG− patients, whereas there were no differences in CD4+ T cells upon anti‐CD3 stimulation or CD4+ and CD8+ T cells upon IL‐15 stimulation (Supplementary figure 5a and b). It has been demonstrated that CD28− T cells have a diminished proliferative ability in response to TCR stimulation, while IL‐15 promotes the expansion of CD28− T cells in an antigen‐independent manner. 21 Thus, we further analysed CFSE data by assessing CD28+ and CD28− T cells to examine whether senescence in CD28− T cells is associated with an impaired proliferative capacity (Supplementary figure 5c). As expected, CD28− T cells generally had reduced proliferative ability in response to anti‐CD3 stimulation compared with CD28+ T cells in the same patients. However, IL‐15‐dependent proliferation was more robust in CD28− T cells than in CD28+ T cells. Comparing ATG+ and ATG− patients, CD8+CD28+ T cells underwent significantly less proliferation upon anti‐CD3 stimulation (Supplementary figure 5c).
We next compared cytokine production and cytotoxicity of T cells between ATG+ and ATG− patients. Ag‐specific T‐cell responses were evaluated following treatment with overlapping peptide mixtures from pp65 and IE‐1, CMV dominant antigens. 45 The frequency of IFN‐γ‐ or TNF‐α‐producing cells upon stimulation with CMV peptides was significantly increased in CD4+ T cells of ATG+ patients compared with ATG− patients, suggesting that CMV‐specific T cells were more abundant following ATG treatment. However, a similar tendency was observed in CD8+ T cells under both conditions (Figure 5a and b and Supplementary figure 6). While there were more CMV‐specific T cells in the CD28− subset than in the CD28+ subset, CMV‐specific T cells were comparable between the CD28− subsets of ATG+ and ATG− patients (Figure 5c). Following stimulation with CMV peptides, IFN‐γ‐ and TNF‐α‐producing CD28+CD4+ T cells were significantly increased in ATG+ patients (Figure 5c). Polyfunctional T cells producing various immune mediators, such as cytokines, provide a more efficient immune response to a pathogen. 46 , 47 , 48 Figure 5d shows the polyfunctionality profile of CD4+ T cells in response to CMV peptides based on their ATG treatment. The bar graphs represent the average frequency of the listed mediator combination (Figure 5d lower panel). We found that CD4+ and CD8+ T cells had a higher polyfunctionality in ATG+ patients than ATG− patients regardless of CD28 expression (Figure 5e). Our results demonstrate that ATG+ patients have increased CMV‐specific CD4+ T cells, which possess potent polyfunctionality, as evidenced by cytokine production, and, except for CD8+CD28+ T cells, have preserved proliferative capacity.
Figure 5.
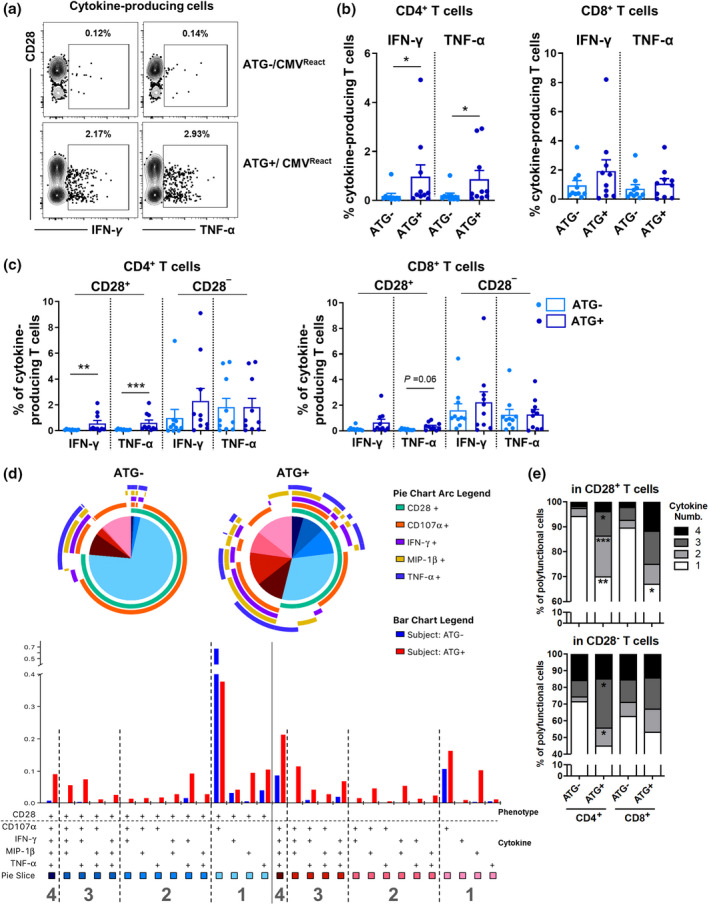
Increased CMV‐specific CD4+CD28− T cells possessing potent polyfunctional cytokine production in ATG+ patients. Peripheral blood mononuclear cells (PBMCs) of ATG+ (n = 10) and ATG− (n = 10) kidney transplant (KT) patients were stimulated for 6 h with CMV overlapping peptide mixtures of pp65 and IE‐1, followed by intracellular cytokine staining (ICS). (a) Representative FACS plot of cytokine‐producing CD4+ T cells upon stimulation with CMV peptides (b) Frequency (%) of cytokine‐producing CD4+ and CD8+ T cells. (c) Frequency (%) of cytokine‐producing CD28+ or CD28− cells in CD4+ and CD8+ T cells. (d) The cytokine production profile was analysed by Boolean combination gates of FlowJo software and SPICE programme using ICS data from a–c. Pie charts demonstrate the relative contribution of each subset to the total functional response, with each colour representing the number of cytokines or cytotoxic mediators simultaneously produced in CD4+ T cells of ATG+ and ATG− KT patients. Bar graphs represent the average frequency (%) of all 15 functional mediator combinations among CD28+CD4+ or CD28−CD4+ T cells of the patients [ATG+ (n = 10) and ATG− (n = 10)] upon stimulation with CMV peptides. (e) Frequency of the relative contribution of subsets representing the number (1–4) of cytokines or cytotoxic mediators produced by the indicated T‐cell subsets upon stimulation with CMV peptides. Bar graphs (b, c) and stacked bar graphs (e: n = 10) show the mean. * P < 0.05, ** P < 0.01 and *** P < 0.001 by the two‐tailed paired nonparametric t‐test (b–d).
Reduced TCR diversity in KT patients following ATG treatment
Our next question was whether the senescent changes in T cells seen in KT patients following ATG treatment influenced TCR diversity. To this end, NGS‐based repertoire analysis of the complementarity‐determining region (CDR) 1, 2 and 3 of the TCRβ‐chain was conducted using PBMCs purified from ATG+ and ATG− KT patients. Representative treemaps show that ATG treatment causes a dramatic reduction of TCR diversity in KT patients. This reduction was more apparent in KT patients with a higher frequency of CD4+CD28− T cells (Figure 6a). The number of unique CDR3 genes and diversity 50 (D50) index was also lower in ATG+ patients than ATG− patients (Figure 6b and c). Moreover, the frequency of CD28− T cells and D50 index were inversely correlated in both CD4+ and CD8+ T cells, suggesting that accumulated CD28− T cells of ATG+ patients are responsible for the reduced TCR diversity (Figure 6d).
Figure 6.

Decreased T‐cell receptor (TCR) diversity in KT patients following ATG treatment. TCR diversity in ATG+ and ATG− KT patients (n = 3 of each) was evaluated by Next‐Generation Sequencing (NGS)‐based TCRβ‐chain repertoire analysis. (a) Representative treemaps of TCR repertoire in ATG+ and ATG− KT patients with a high or low frequency of CD28− cells in CD4+ T cells. Each dot represents a unique sequence and the dot size is proportional to the number of cells with that sequence. Colours were randomised. (b) The number of unique CDR3 sequences in ATG+ and ATG− KT patients. (c) Diversity 50 (D50) index of ATG+ and ATG− KT patients. (d) Correlation analysis between frequency (%) of CD28− T cells and D50 index in ATG+ and ATG− KT patients. P‐values were obtained using the Spearman correlation analysis. Bar graphs show the mean ± sem.
Discussion
Anti‐thymocyte globulin has been used worldwide as induction therapy in both solid organ and haematopoietic cell transplantation for more than 40 years. 3 , 38 Nevertheless, its utilisation remains largely empirical and many clinically unsolved questions remain, including its long‐term effects. Thus, there is a need to investigate the underlying mechanisms and immune monitoring of patients is required. 2 T cells are a major target of ATG therapy. However, only recently has ATG‐mediated alteration of T‐cell immunity been investigated in KT patients. 5 , 33 , 49 , 50 Further, a majority of these studies are on immune reconstitution observed over a relatively short period post‐transplantation. T cells rapidly and robustly proliferate to reconstitute the immune compartment following ATG treatment. Replicative stress accompanying intensive cell division during immune reconstitution provokes various effects on the features of T‐cell senescence in patients under different transplant settings. 48 , 51 In this context, we aimed to investigate the effect of ATG treatment on the alteration of phenotypic and functional senescence of T cells over a long‐term perspective (median 65 months) and the possible underlying mechanisms in KT recipients.
Accumulation of CD28− T cells, particularly within the CD8+ subset, is a hallmark of age‐associated immunological changes in humans. Loss of CD28 is intimately associated with changing expression patterns of several regulatory surface molecules responsible for the modulation of functional activity. 14 , 15 Our data reveal that CD28− T cells are significantly expanded not only in CD8+ but also in the CD4+ T‐cell subset of KT patients compared with age‐ and gender‐matched healthy controls (Figure 1c). We also found other immunosenescent features including an increased frequency of CD57+ or CD85j+ T cells and altered distribution of functional T‐cell subsets (Figure 1c and d). Of note, these senescence‐associated phenotypic changes were magnified in KT patients treated with ATG (Figure 2). A growing body of evidence reveals that there is an increase in CD28− T cells in patients under different transplant settings. 33 , 48 , 52 , 53 Yap et al. 53 demonstrated that the expansion of terminally differentiated effector memory (EMRA) CD8 T cells, which include a majority of senescent cells, is a risk factor for long‐term graft dysfunction in KT patients. CKD and related immunosuppressive therapies in paediatric patients accelerate immune senescence, including causing increases in CD57+ or CD28−CD8+ T cells. 54 In paediatric KT patients, ATG induction is also associated with an increase in CD4+ effector memory and senescent CD57+ T cells that are associated with early event‐free survival, suggesting its short‐term clinical benefits. 55 In addition, it has been demonstrated that T‐cell exhaustion correlates with improved outcomes in KT recipients. 56 Since ATG treatment causes increased accumulation of CD28−CD8+ EMRA T cells (Figures 2c and d), we sought to scrutinise the effect of ATG on immunosenescent changes of T cells. Late‐stage differentiated CD8+ (CD28− or CD57−CD28−) T cells increased in a relatively short time, 1‐year post‐transplant, in KT patients treated with depleting ATG therapy, but not in patients treated with nondepleting anti‐CD25 mAb therapy. 33 This suggests that ATG is associated with the induction of immune senescence. Thus, our analysis focussed on comparing immunosenescent features among HCs, ATG+ and ATG− KT patients. Furthermore, we explored the possible mechanism underlying the expansion of senescent T cells in ATG+ KT patients and their functionality, which may contribute to graft survival and related pathogenic conditions over the long term.
Thymopoiesis and homeostatic proliferation mainly contribute to T‐cell reconstitution in a T‐cell‐depleted situation 6 ; however, the effect of ATG on the thymus remains controversial. 33 An early study showed that thymopoiesis in ATG‐treated patients is comparable to patients receiving anti‐CD25 mAb and those without induction therapy at 6 months after transplantation. 5 , 50 By contrast, other studies have shown that thymic output, assessed by CD31+ naïve T cells and T‐cell receptor excision circles (TREC), is markedly decreased in ATG+ patients at 1‐year post‐transplant. 33 It has been suggested that the age of recipients or the elapsed time after transplantation may influence thymopoiesis in ATG‐treated patients. 33 Presumably, ATG‐treated patients must have increased homeostatic proliferation to achieve T‐cell reconstitution at 1‐year post‐transplantation, as the T‐cell decline is still present. 49 IL‐7 and IL‐15 are critical cytokines for regulating the homeostatic proliferation of T cells. 57 , 58 Severe lymphopenic conditions cause an elevation of circulating IL‐7 and IL‐15 because of diminished consumption of these cytokines by lymphocytes expressing the relevant receptors. Further, IL‐15 production can also be enhanced by inflammatory signals. 59 , 60 In haematopoietic cell transplantation, an increased level of IL‐7 and IL‐15 is linked to successful T‐cell repopulation, although there is also an increased risk of acute graft versus host disease (GvHD) and relapse. 61 , 62 It has been well known that IL‐15 is critical for antigen‐independent expansion and survival of senescent CD28− T cells. 21 , 39 , 40 A recent study demonstrated that IL‐15 is a potent inducer of the proinflammatory function of CD8 EMRA T cells from KT patients even in the immunosuppressive milieu. 63 Our data illustrate that plasma IL‐15 is higher in KT patients than in HCs (Figure 3a), implying the presence of lymphopenic and/or inflammatory milieu. However, plasma IL‐15 was comparable between ATG+ and ATG− patients, and the correlation of IL‐15 level with the frequency of CD28− T cells was observed only in ATG− patients (Figure 3d). Previous studies have shown that circulating IL‐15 rapidly increases within 2 weeks after ATG treatment or myeloablative conditioning and then gradually subsides. 60 , 64 Likely, the lymphopenia‐mediated elevation of IL‐15 had already subsided by the time we collected samples and the chronic inflammatory environment contributes to maintaining an elevated level of IL‐15 in both ATG+ and ATG− patients. It should be noted that CD28− T cells are more expanded in ATG+ patients, regardless of the IL‐15 concentration, than in ATG− patients, probably reflecting ATG‐mediated early elevation of IL‐15 as described previously. 60
Cytomegalovirus (CMV) infection is an important factor in post‐transplant treatment‐related morbidity and mortality. 65 The association between ATG therapies and CMV infection (primary or reactivation) as a result of delayed reconstitution of lymphocytes and prolonged time to absolute lymphocyte count recovery after ATG treatment has been previously reported. 66 , 67 Our data demonstrate that ATG treatment of KT patients is associated with an increased incidence of CMV reactivation (CMVReact group), which results in an accumulation of CD28− T cells (Figure 4b and d). Under various inflammatory conditions, CMV reactivation drives the expansion of terminally differentiated CD28− T cells, and antiviral therapy limits this expansion. 68 It has been demonstrated that repeated antigen stimulation during CMV reactivation provokes increases in memory T cells (so‐called memory T‐cell inflation) and decreased TCR repertoires, features typical of an aged immune system (Figures 2d and 6). 69 , 70 Our data illustrate that CMV‐IgG titre is significantly higher in KT patients than in HCs (Figure 4a). Recent studies have demonstrated that patients with end‐stage renal disease (ESRD) have a higher titre of CMV‐specific IgG, suggesting repetitive antigenic stimulation by subclinical CMV reactivation under uraemia‐associated inflammatory milieu. 71 , 72 Our retrospective cohort study makes it difficult to determine whether increased CMV‐IgG was present in patients before transplantation or was caused by transplantation. Considering a potential mechanistic link between CMV reactivation, T‐cell immunosenescence and coronary artery disease in ESRD patients, it is necessary to continue monitoring the long‐term impact of immune responses against CMV in KT patients.
Senescent CD28− T cells have aberrant functional features, including enhanced cytotoxic potential and increased secretion of proinflammatory cytokines, including IFN‐γ and TNF‐α, which may cause tissue damage and development of pathogenesis in many inflammatory disorders. 14 , 35 , 73 More importantly, CD28− T cells potentiate TCR‐independent effector functions in response to stimulation with cytokines such as IL‐15, whereas their TCR‐dependent responses are generally reduced. 14 , 39 , 73 As seen in Figure 2c, a profound expansion of CD28− T cells, especially CD4+CD28− T cells, was found in ATG‐treated patients. An increase in CD4+CD28− T cells is also seen in patients after solid organ and haematopoietic cell transplantation and their expansion after kidney and liver transplantation is associated with chronic graft rejection. 48 In our cohort, ATG‐treated patients had several phenotypic features of senescent T cells such as accumulated CD28−, CD57+ or CD85j+ T cells and expanded CMV‐specific T cells (Figures 2 and 4); however, there was no obvious impairment of T‐cell functionality compared with ATG− patients (Figure 5 and Supplementary figure 5). We recently reported that in paediatric and adolescent patients with haploidentical haematopoietic stem cell transplantation reconstituted T cells exhibit senescence‐associated phenotypes and altered cytokine profiles, but intact proliferative capacity compared to that of patient donors. Thus, this suggests that these T cells undergo premature immunosenescent changes. Although in our study CD28− T cells were not found to be functionally typical senescent T cells, accumulation of functionally intact CD28− T cells also may have an adverse long‐term effect in KT patients because of their potent cytotoxic and proinflammatory features, such as the higher cumulative incidence of cardiovascular disease in ATG‐treated patients. 74 , 75
Our study has limitations associated with experimental design, including the relatively small size of the cohort, especially the number of samples in the functional analysis of T cells in ATG+ and ATG− patients. A lack of laboratory parameters, such as a complete blood count (CBC) with differential, made it impossible to measure changes in the absolute number of senescent T cells, which limits data interpretation. Samples were collected after maintenance immunosuppression therapy was stabilised and kidney function was normalised. However, when interpreting the results, it should be considered that the samples were collected only once at very different times for each patient after KT. We also cannot exclude the possibility that other immunosuppressant treatments affect the immunosenescent feature of T cells. Thus, further studies using well‐designed larger cohorts will be needed to address these issues.
In summary, senescent CD28− T cells are expanded in ATG+ KT patients, which is likely to be associated with increased IL‐15 and CMV reactivation. T cells of ATG+ KT patients have senescence‐associated phenotypic changes and markedly shrunken oligoclonality, but relatively intact functionality. Overall, our findings suggest that ATG treatment contributes to eliciting premature T‐cell ageing, which may have lifelong clinical implications in KT patients. Therefore, long‐term, comprehensive immune monitoring of these patients is necessary.
Methods
Study population and design
Study patients in the KT group were recruited from the CMERC‐HI (Cardiovascular and Metabolic Disease Etiology Research Center–High Risk) cohort study, including 3270 subjects from December 2013 to June 2018. 76 KT group patients were seen at Severance Hospital, Yonsei University Health System, Seoul, Korea, more than 3 month post‐KT with stabilised kidney function and no ongoing infection or rejection. Study subjects in the healthy control (HC) group were selected from the CMERC cohort, a sister cohort of the CMERC‐HI cohort, to match the age and gender of the patients in the KT group. In the CMERC cohort, the following exclusion criteria apply. (1) The individual is diagnosed with cancer within 2 years or is still undergoing cancer treatment. (2) The individual has a history of myocardial infarction, stroke or heart failure. (3) The individual is participating in any randomised clinical trials. (4) The individual is currently pregnant. 76 The characteristics of HCs are summarised in Table 3. For T‐cell analysis, peripheral blood samples were collected from patients and HCs. This study was approved by the institutional review board of Yonsei University Health System Clinical Trial Center (4‐2013‐0581), and all patients and donors provided written informed consent or assent before the study.
Table 3.
Characteristics of healthy controls (HC)
| Characteristics | Healthy controls (N = 116) |
|---|---|
| Age (years old) | 50.3 ± 9.6 |
| Gender (N, %) | |
| Male | 76 (65.5%) |
| Female | 40 (34.5%) |
| Obesity (25 > BMI) | 50 (43.1%) |
| Hypertension a | 13 (11.2%) |
| DM b | 5 (4.31%) |
Systolic blood pressure (SBP) of > 140 mm Hg or a diastolic blood pressure (DBP) of > 90 mm Hg.
Diabetes mellitus.
Transplantation protocol and supportive care
Patients received 20 mg of basiliximab as the induction agent on the day of the operation and day 4 after transplantation. Thymoglobulin® (Sanofi, Paris, France), rabbit anti‐thymocyte globulin was used as an induction immunosuppressant to reduce the risk of acute rejection for high‐immunologic risk recipients. The treatment dose of ATG was 1.5–2.5 mg kg−1 according to our centre protocol. A triple regimen of tacrolimus or cyclosporine A, steroids and mycophenolic acid was administered as a maintenance immunosuppressant.
All patients were monitored for CMV viraemia by PCR each year, and for patients that received ATG, the CMV viraemia was monitored every 2 weeks for 1 month. Over 1000 copies mL−1 of CMV viraemia was defined as CMV infection. For patients diagnosed with CMV infection and showing clinical symptoms, ganciclovir or valganciclovir was administrated for 7–14 days as initial therapy and maintained until the CMV titre was negative.
Cell preparation and flow cytometric analysis
Peripheral blood mononuclear cells (PBMCs) were isolated from blood by density gradient centrifugation (Bicoll Separating Solution; BIOCHROM, Cambridge, UK). After centrifugation, four vials with 1 mL plasma each were stored in a − 80°C deep freezer. Phenotypic staining and other experiments were processed on the day of isolation and the remaining cells were frozen in cryovials in liquid nitrogen until use. PBMCs were stained at 4°C for 30 min with the antibodies (Abs) to CD4, CD8, CD28, CCR7 (BD Biosciences, Franklin Lakes, NJ, USA), CD3, CD45RA, PD‐1 (BioLegend, San Diego, CA, USA), CD57 and CD85j (eBiosciences, San Diego, CA, USA). To detect CMV‐specific CD8 T cells, PBMCs of prescreened HLA‐A2+ patients were stained at 4°C for 30 min with CMV pp65495‐504 pentamer (Proimmune, Oxford, UK) and the Abs to CD3, CD4, CD8, CD28, CCR7, CD45RA, CD57 and CD85j. Stained cells were acquired by Fortessa‐X20 or LSRFortessa (BD Biosciences) and analysed using FlowJo software (Tree Star, Ashland, OR, USA).
Carboxyfluorescein succinimidyl ester dilution assay
Freshly isolated PBMCs were labelled with carboxyfluorescein succinimidyl ester (CFSE; Invitrogen, Carlsbad, CA) and stimulated for 6 days in 96‐flat bottom plates coated with 1 μg mL−1 of anti‐CD3 Abs (OKT3, eBiosciences) or with 25 ng mL−1 of soluble IL‐15 in RPMI 1640 medium supplemented with 10% FBS, 100 U mL−1 penicillin, 100 μg mL−1 streptomycin and 2 mm L‐glutamine (henceforth, complete RPMI 1640) at 37°C and 5% CO2. After 6 days, cells were stained at 4°C for 30 min with the Abs to CD3, CD4, CD8 and CD28. 7‐AAD was added to the cell/Abs mixtures after 20 min of staining, and cells were then incubated for 10 additional minutes. Stained cells were acquired by Fortessa‐X20 or LSRFortessa and analysed using FlowJo software.
ELISA
Frozen vials of plasma for 82 KT patients and 34 HCs were thawed, and the IL‐15 concentration was measured using the human IL‐15 quantikine ELISA kit (R&D system, Minneapolis, MN, USA). The concentration of CMV‐specific IgG was measured using the same plasma sample that was used for IL‐15 measurement by Cytomegalovirus IgG ELISA Kit (Abnova, Taipei, Taiwan) in 53 KT patients and 27 HC. All procedures were as according to the manufacturer's protocol, and absorbance was measured at a wavelength of 450 nm using a microplate reader.
Intracellular staining
Frozen PBMCs were thawed and incubated overnight in complete RPMI 1640 at 37°C and 5% CO2. Cultured cells were stimulated for 6 h with 1 μg mL−1 of human CMV pp65 and IE‐1 peptide mixture (Peptivator CMV pp65 and IE‐1; Miltenyi Biotec, Auburn, CA, USA) in the presence of anti‐CD107a Ab (BD Bioscience) and Brefeldin A for 5 h (Cell Signaling Technology, Danvers, MA, USA). Stimulated cells were stained with Abs to CD3, CD4, CD8, CD28 and CD45RA followed by fixation and permeabilisation (BD Cytofix/Cytoperm Solution Kit; BD Biosciences). Fixed cells were stained with Abs to IFN‐γ, TNF‐α and MIP‐1β. Stained cells were acquired by Fortessa‐X20 or LSRFortessa and analysed using FlowJo software and the SPICE programme (Version 5.0, NIH, Bethesda, MD, USA).
T‐cell receptor repertoire
For analysis of the immune repertoire, frozen PBMCs from 6 KT patients (ATG+, n = 3; ATG‐, n = 3) were analysed using next‐generation sequencing (NGS)‐based TCR gene sequencing, a commercially available service (iRepertoire Inc., Huntsville, AL, USA). Briefly, RNA was extracted from PBMCs and amplified by amplicon‐rescued multiplex PCR (arm‐PCR) performed with multiplex primers. Genes of the complementarity‐determining region (CDR) 3 of the TCR beta chain were sequenced. Sequencing data were visualised using the web programme (iRweb) provided by the company. Treemaps were randomly generated, and the colour has no meaning. Every single dot represents a unique CDR, and the size of the dot denotes the relative frequency of the unique sequence. The diversity of the TCR repertoire is depicted by the number of unique CDR3 molecules and is calculated based on the diversity 50 (D50) value. 77
Statistical analysis
The unpaired t‐test or Pearson correlation analysis was performed to analyse data, and the Mann–Whitney U‐test or the Spearman correlation analysis was performed when the number of patients was fewer than 20. For this, Prism 7 software (GraphPad Software Inc., La Jolla, CA) was utilised as indicated in the figure captions. P‐values less than 0.05 were considered statistically significant.
Author contributions
Ga Hye Lee: Conceptualization; data curation; formal analysis; investigation; methodology; writing – original draft. Jee Youn Lee: Conceptualization; data curation; formal analysis; investigation; methodology; validation; writing – original draft; writing – review and editing. Jiyeon Jang: Data curation; formal analysis; investigation; methodology. Yeon Jun Kang: Data curation; formal analysis; investigation; methodology. Seung Ah Choi: Data curation; formal analysis; investigation; methodology. Hyeon Chang Kim: Conceptualization; data curation; resources. Sungha Park: Conceptualization; data curation; resources; validation. Myoung Soo Kim: Conceptualization; data curation; project administration; resources; supervision; validation; writing – review and editing. Won‐Woo Lee: Conceptualization; data curation; funding acquisition; investigation; project administration; resources; supervision; validation; writing – original draft; writing – review and editing.
Conflict of interest
The authors declare that no conflict of interest exists.
Supporting information
Supplementary figure 1
Supplementary figure 2
Supplementary figure 3
Supplementary figure 4
Supplementary figure 5
Supplementary figure 6
Acknowledgments
This work was supported in part by a grant (HI13C0715 to W‐WL) from the Korean Health Technology R&D Project, Ministry of Health and Welfare and by grants (Grant no: 2021M3A9I2080493, 2022R1A4A1033767 and 2022R1A2C3011243 to W‐WL) from the National Research Foundation of Korea (NRF) funded by Ministry of Science and ICT (MSIT), Republic of Korea.
Contributor Information
Myoung Soo Kim, Email: ysms91@yuhs.ac.
Won‐Woo Lee, Email: wonwoolee@snu.ac.kr.
References
- 1. Lim MA, Kohli J, Bloom RD. Immunosuppression for kidney transplantation: where are we now and where are we going? Transplant Rev (Orlando) 2017; 31: 10–17. [DOI] [PubMed] [Google Scholar]
- 2. Ducloux D, Bamoulid J, Daguindau E, Rebibou JM, Courivaud C, Saas P. Antithymocytes globulins: time to revisit its use in kidney transplantation? Int Rev Immunol 2018; 37: 183–191. [DOI] [PubMed] [Google Scholar]
- 3. Mohty M. Mechanisms of action of antithymocyte globulin: T‐cell depletion and beyond. Leukemia 2007; 21: 1387–1394. [DOI] [PubMed] [Google Scholar]
- 4. Rebellato LM, Gross U, Verbanac KM, Thomas JM. A comprehensive definition of the major antibody specificities in polyclonal rabbit antithymocyte globulin. Transplantation 1994; 57: 685–694. [DOI] [PubMed] [Google Scholar]
- 5. Gurkan S, Luan Y, Dhillon N et al. Immune reconstitution following rabbit antithymocyte globulin. Am J Transplant 2010; 10: 2132–2141. [DOI] [PMC free article] [PubMed] [Google Scholar]
- 6. Williams KM, Hakim FT, Gress RE. T cell immune reconstitution following lymphodepletion. Semin Immunol 2007; 19: 318–330. [DOI] [PMC free article] [PubMed] [Google Scholar]
- 7. Ducloux D, Courivaud C, Bamoulid J et al. Prolonged CD4 T cell lymphopenia increases morbidity and mortality after renal transplantation. J Am Soc Nephrol 2010; 21: 868–875. [DOI] [PMC free article] [PubMed] [Google Scholar]
- 8. Ducloux D, Challier B, Saas P, Tiberghien P, Chalopin JM. CD4 cell lymphopenia and atherosclerosis in renal transplant recipients. J Am Soc Nephrol 2003; 14: 767–772. [DOI] [PubMed] [Google Scholar]
- 9. Porter DL, June CH. T‐cell reconstitution and expansion after hematopoietic stem cell transplantation: ‘T’ it up! Bone Marrow Transplant 2005; 35: 935–942. [DOI] [PubMed] [Google Scholar]
- 10. Pawelec G, Larbi A, Derhovanessian E. Senescence of the human immune system. J Comp Pathol 2010; 142(Suppl 1): S39–S44. [DOI] [PubMed] [Google Scholar]
- 11. Vallejo AN, Weyand CM, Goronzy JJ. T‐cell senescence: a culprit of immune abnormalities in chronic inflammation and persistent infection. Trends Mol Med 2004; 10: 119–124. [DOI] [PubMed] [Google Scholar]
- 12. Pawelec G, Akbar A, Caruso C, Solana R, Grubeck‐Loebenstein B, Wikby A. Human immunosenescence: is it infectious? Immunol Rev 2005; 205: 257–268. [DOI] [PubMed] [Google Scholar]
- 13. Goronzy JJ, Weyand CM. Successful and maladaptive T cell aging. Immunity 2017; 46: 364–378. [DOI] [PMC free article] [PubMed] [Google Scholar]
- 14. Lee GH, Lee WW. Unusual CD4+CD28− T cells and their pathogenic role in chronic inflammatory disorders. Immune Netw 2016; 16: 322–329. [DOI] [PMC free article] [PubMed] [Google Scholar]
- 15. Yu HT, Park S, Shin EC, Lee WW. T cell senescence and cardiovascular diseases. Clin Exp Med 2016; 16: 257–263. [DOI] [PubMed] [Google Scholar]
- 16. Posnett DN, Sinha R, Kabak S, Russo C. Clonal populations of T cells in normal elderly humans: the T cell equivalent to "benign monoclonal gammapathy". J Exp Med 1994; 179: 609–618. [DOI] [PMC free article] [PubMed] [Google Scholar]
- 17. Fagnoni FF, Vescovini R, Mazzola M et al. Expansion of cytotoxic CD8+CD28− T cells in healthy ageing people, including centenarians. Immunology 1996; 88: 501–507. [DOI] [PMC free article] [PubMed] [Google Scholar]
- 18. Azuma M, Phillips JH, Lanier LL. CD28− T lymphocytes antigenic and functional properties. J Immunol 1993; 150: 1147–1159. [PubMed] [Google Scholar]
- 19. Batliwalla F, Monteiro J, Serrano D, Gregersen PK. Oligoclonality of CD8+ T cells in health and disease: aging, infection, or immune regulation? Hum Immunol 1996; 48: 68–76. [DOI] [PubMed] [Google Scholar]
- 20. Monteiro J, Batliwalla F, Ostrer H, Gregersen PK. Shortened telomeres in clonally expanded CD28−CD8+ T cells imply a replicative history that is distinct from their CD28+CD8+ counterparts. J Immunol 1996; 156: 3587–3590. [PubMed] [Google Scholar]
- 21. Alonso‐Arias R, Moro‐Garcia MA, Vidal‐Castineira JR et al. IL‐15 preferentially enhances functional properties and antigen‐specific responses of CD4+CD28null compared to CD4+CD28+ T cells. Aging Cell 2011; 10: 844–852. [DOI] [PubMed] [Google Scholar]
- 22. Posnett DN, Edinger JW, Manavalan JS, Irwin C, Marodon G. Differentiation of human CD8 T cells: implications for in vivo persistence of CD8+CD28− cytotoxic effector clones. Int Immunol 1999; 11: 229–241. [DOI] [PubMed] [Google Scholar]
- 23. Avice MN, Demeure CE, Delespesse G, Rubio M, Armant M, Sarfati M. IL‐15 promotes IL‐12 production by human monocytes via T cell‐dependent contact and may contribute to IL‐12‐mediated IFN‐gamma secretion by CD4+ T cells in the absence of TCR ligation. J Immunol 1998; 161: 3408–3415. [PubMed] [Google Scholar]
- 24. Itsumi M, Yoshikai Y, Yamada H. IL‐15 is critical for the maintenance and innate functions of self‐specific CD8+ T cells. Eur J Immunol 2009; 39: 1784–1793. [DOI] [PubMed] [Google Scholar]
- 25. Traitanon O, Gorbachev A, Bechtel JJ et al. IL‐15 induces alloreactive CD28− memory CD8 T cell proliferation and CTLA4‐Ig resistant memory CD8 T cell activation. Am J Transplant 2014; 14: 1277–1289. [DOI] [PMC free article] [PubMed] [Google Scholar]
- 26. Schmidt D, Goronzy JJ, Weyand CM. CD4+CD7−CD28− T cells are expanded in rheumatoid arthritis and are characterized by autoreactivity. J Clin Invest 1996; 97: 2027–2037. [DOI] [PMC free article] [PubMed] [Google Scholar]
- 27. Zhao Y, Shao Q, Peng G. Exhaustion and senescence: two crucial dysfunctional states of T cells in the tumor microenvironment. Cell Mol Immunol 2020; 17: 27–35. [DOI] [PMC free article] [PubMed] [Google Scholar]
- 28. Qiu MK, Wang SC, Dai YX, Wang SQ, Ou JM, Quan ZW. PD‐1 and Tim‐3 pathways regulate CD8+ T cells function in atherosclerosis. PLoS One 2015; 10: e0128523. [DOI] [PMC free article] [PubMed] [Google Scholar]
- 29. Fernandez DM, Rahman AH, Fernandez NF et al. Single‐cell immune landscape of human atherosclerotic plaques. Nat Med 2019; 25: 1576–1588. [DOI] [PMC free article] [PubMed] [Google Scholar]
- 30. Simons KH, de Jong A, Jukema JW, de Vries MR, Arens R, Quax PHA. T cell co‐stimulation and co‐inhibition in cardiovascular disease: a double‐edged sword. Nat Rev Cardiol 2019; 16: 325–343. [DOI] [PubMed] [Google Scholar]
- 31. Pawelec G, Derhovanessian E. Role of CMV in immune senescence. Virus Res 2011; 157: 175–179. [DOI] [PubMed] [Google Scholar]
- 32. De Keyzer K, Van Laecke S, Peeters P, Vanholder R. Human cytomegalovirus and kidney transplantation: a clinician's update. Am J Kidney Dis 2011; 58: 118–126. [DOI] [PubMed] [Google Scholar]
- 33. Crepin T, Carron C, Roubiou C et al. ATG‐induced accelerated immune senescence: clinical implications in renal transplant recipients. Am J Transplant 2015; 15: 1028–1038. [DOI] [PubMed] [Google Scholar]
- 34. Betjes MG. Immune cell dysfunction and inflammation in end‐stage renal disease. Nat Rev Nephrol 2013; 9: 255–265. [DOI] [PubMed] [Google Scholar]
- 35. Kim HY, Yoo TH, Hwang Y et al. Indoxyl sulfate (IS)‐mediated immune dysfunction provokes endothelial damage in patients with end‐stage renal disease (ESRD). Sci Rep 2017; 7: 3057. [DOI] [PMC free article] [PubMed] [Google Scholar]
- 36. Czesnikiewicz‐Guzik M, Lee WW, Cui D et al. T cell subset‐specific susceptibility to aging. Clin Immunol 2008; 127: 107–118. [DOI] [PMC free article] [PubMed] [Google Scholar]
- 37. Preville X, Flacher M, LeMauff B et al. Mechanisms involved in antithymocyte globulin immunosuppressive activity in a nonhuman primate model. Transplantation 2001; 71: 460–468. [DOI] [PubMed] [Google Scholar]
- 38. Bamoulid J, Staeck O, Crepin T et al. Anti‐thymocyte globulins in kidney transplantation: focus on current indications and long‐term immunological side effects. Nephrol Dial Transplant 2017; 32: 1601–1608. [DOI] [PubMed] [Google Scholar]
- 39. Broux B, Mizee MR, Vanheusden M et al. IL‐15 amplifies the pathogenic properties of CD4+CD28− T cells in multiple sclerosis. J Immunol 2015; 194: 2099–2109. [DOI] [PubMed] [Google Scholar]
- 40. Chiu WK, Fann M, Weng NP. Generation and growth of CD28nullCD8+ memory T cells mediated by IL‐15 and its induced cytokines. J Immunol 2006; 177: 7802–7810. [DOI] [PMC free article] [PubMed] [Google Scholar]
- 41. Ku CC, Murakami M, Sakamoto A, Kappler J, Marrack P. Control of homeostasis of CD8+ memory T cells by opposing cytokines. Science 2000; 288: 675–678. [DOI] [PubMed] [Google Scholar]
- 42. Mortier E, Woo T, Advincula R, Gozalo S, Ma A. IL‐15Rα chaperones IL‐15 to stable dendritic cell membrane complexes that activate NK cells via trans presentation. J Exp Med 2008; 205: 1213–1225. [DOI] [PMC free article] [PubMed] [Google Scholar]
- 43. Fulop T, Larbi A, Pawelec G. Human T cell aging and the impact of persistent viral infections. Front Immunol 2013; 4: 271. [DOI] [PMC free article] [PubMed] [Google Scholar]
- 44. Ouyang Q, Wagner WM, Zheng W, Wikby A, Remarque EJ, Pawelec G. Dysfunctional CMV‐specific CD8+ T cells accumulate in the elderly. Exp Gerontol 2004; 39: 607–613. [DOI] [PubMed] [Google Scholar]
- 45. Sylwester AW, Mitchell BL, Edgar JB et al. Broadly targeted human cytomegalovirus‐specific CD4+ and CD8+ T cells dominate the memory compartments of exposed subjects. J Exp Med 2005; 202: 673–685. [DOI] [PMC free article] [PubMed] [Google Scholar]
- 46. Seder RA, Darrah PA, Roederer M. T‐cell quality in memory and protection: implications for vaccine design. Nat Rev Immunol 2008; 8: 247–258. [DOI] [PubMed] [Google Scholar]
- 47. Kannanganat S, Ibegbu C, Chennareddi L, Robinson HL, Amara RR. Multiple‐cytokine‐producing antiviral CD4 T cells are functionally superior to single‐cytokine‐producing cells. J Virol 2007; 81: 8468–8476. [DOI] [PMC free article] [PubMed] [Google Scholar]
- 48. Lee GH, Hong KT, Choi JY, Shin HY, Lee WW, Kang HJ. Immunosenescent characteristics of T cells in young patients following haploidentical haematopoietic stem cell transplantation from parental donors. Clin Transl Immunol 2020; 9: e1124. [DOI] [PMC free article] [PubMed] [Google Scholar]
- 49. Weimer R, Ettrich M, Renner F et al. ATG induction in renal transplant recipients: long‐term hazard of severe infection is associated with long‐term functional T cell impairment but not the ATG‐induced CD4 cell decline. Hum Immunol 2014; 75: 561–569. [DOI] [PubMed] [Google Scholar]
- 50. Bouvy AP, Kho MM, Klepper M et al. Kinetics of homeostatic proliferation and thymopoiesis after rATG induction therapy in kidney transplant patients. Transplantation 2013; 96: 904–913. [DOI] [PubMed] [Google Scholar]
- 51. Wynn RF, Cross MA, Hatton C et al. Accelerated telomere shortening in young recipients of allogeneic bone‐marrow transplants. Lancet 1998; 351: 178–181. [DOI] [PubMed] [Google Scholar]
- 52. Lin YX, Wang LL, Yan LN et al. Analysis of CD8+CD28− T‐suppressor cells in living donor liver transplant recipients. Hepatobiliary Pancreat Dis Int 2009; 8: 241–246. [PubMed] [Google Scholar]
- 53. Yap M, Boeffard F, Clave E et al. Expansion of highly differentiated cytotoxic terminally differentiated effector memory CD8+ T cells in a subset of clinically stable kidney transplant recipients: a potential marker for late graft dysfunction. J Am Soc Nephrol 2014; 25: 1856–1868. [DOI] [PMC free article] [PubMed] [Google Scholar]
- 54. George RP, Mehta AK, Perez SD et al. Premature T cell senescence in pediatric CKD. J Am Soc Nephrol 2017; 28: 359–367. [DOI] [PMC free article] [PubMed] [Google Scholar]
- 55. Shaw BI, Lee HJ, Chan C et al. Relationship between antithymocyte globulin, T cell phenotypes, and clinical outcomes in pediatric kidney transplantation. Am J Transplant 2021; 21: 766–775. [DOI] [PMC free article] [PubMed] [Google Scholar]
- 56. Fribourg M, Anderson L, Fischman C et al. T‐cell exhaustion correlates with improved outcomes in kidney transplant recipients. Kidney Int 2019; 96: 436–449. [DOI] [PMC free article] [PubMed] [Google Scholar]
- 57. Schluns KS, Lefrancois L. Cytokine control of memory T‐cell development and survival. Nat Rev Immunol 2003; 3: 269–279. [DOI] [PubMed] [Google Scholar]
- 58. Tan JT, Dudl E, LeRoy E et al. IL‐7 is critical for homeostatic proliferation and survival of naive T cells. Proc Natl Acad Sci USA 2001; 98: 8732–8737. [DOI] [PMC free article] [PubMed] [Google Scholar]
- 59. Fehniger TA, Caligiuri MA. Interleukin 15: biology and relevance to human disease. Blood 2001; 97: 14–32. [DOI] [PubMed] [Google Scholar]
- 60. Kielsen K, Oostenbrink LVE, von Asmuth EGJ et al. IL‐7 and IL‐15 levels reflect the degree of T cell depletion during lymphopenia and are associated with an expansion of effector memory T cells after pediatric hematopoietic stem cell transplantation. J Immunol 2021; 206: 2828–2838. [DOI] [PubMed] [Google Scholar]
- 61. Dean RM, Fry T, Mackall C et al. Association of serum interleukin‐7 levels with the development of acute graft‐versus‐host disease. J Clin Oncol 2008; 26: 5735–5741. [DOI] [PMC free article] [PubMed] [Google Scholar]
- 62. Thiant S, Yakoub‐Agha I, Magro L et al. Plasma levels of IL‐7 and IL‐15 in the first month after myeloablative BMT are predictive biomarkers of both acute GVHD and relapse. Bone Marrow Transplant 2010; 45: 1546–1552. [DOI] [PubMed] [Google Scholar]
- 63. Tilly G, Doan‐Ngoc TM, Yap M et al. IL‐15 harnesses pro‐inflammatory function of TEMRA CD8 in kidney‐transplant recipients. Front Immunol 2017; 8: 778. [DOI] [PMC free article] [PubMed] [Google Scholar]
- 64. Thiant S, Labalette M, Trauet J et al. Plasma levels of IL‐7 and IL‐15 after reduced intensity conditioned Allo‐SCT and relationship to acute GVHD. Bone Marrow Transplant 2011; 46: 1374–1381. [DOI] [PubMed] [Google Scholar]
- 65. Razonable RR, Humar A. Cytomegalovirus in solid organ transplant recipients‐guidelines of the American Society of Transplantation infectious diseases community of practice. Clin Transplant 2019; 33: e13512. [DOI] [PubMed] [Google Scholar]
- 66. Issa NC, Fishman JA. Infectious complications of antilymphocyte therapies in solid organ transplantation. Clin Infect Dis 2009; 48: 772–786. [DOI] [PubMed] [Google Scholar]
- 67. Ramanan P, Razonable RR. Cytomegalovirus infections in solid organ transplantation: a review. Infect Chemother 2013; 45: 260–271. [DOI] [PMC free article] [PubMed] [Google Scholar]
- 68. Chanouzas D, Sagmeister M, Faustini S et al. Subclinical reactivation of cytomegalovirus drives CD4+CD28null T‐cell expansion and impaired immune response to pneumococcal vaccination in Antineutrophil cytoplasmic antibody‐associated Vasculitis. J Infect Dis 2019; 219: 234–244. [DOI] [PMC free article] [PubMed] [Google Scholar]
- 69. Iancu EM, Corthesy P, Baumgaertner P et al. Clonotype selection and composition of human CD8 T cells specific for persistent herpes viruses varies with differentiation but is stable over time. J Immunol 2009; 183: 319–331. [DOI] [PubMed] [Google Scholar]
- 70. Klenerman P, Oxenius A. T cell responses to cytomegalovirus. Nat Rev Immunol 2016; 16: 367–377. [DOI] [PubMed] [Google Scholar]
- 71. Yang FJ, Shu KH, Chen HY et al. Anti‐cytomegalovirus IgG antibody titer is positively associated with advanced T cell differentiation and coronary artery disease in end‐stage renal disease. Immun Ageing 2018; 15: 15. [DOI] [PMC free article] [PubMed] [Google Scholar]
- 72. Betjes MG, Huisman M, Weimar W, Litjens NH. Expansion of cytolytic CD4+CD28− T cells in end‐stage renal disease. Kidney Int 2008; 74: 760–767. [DOI] [PubMed] [Google Scholar]
- 73. Broux B, Markovic‐Plese S, Stinissen P, Hellings N. Pathogenic features of CD4+CD28− T cells in immune disorders. Trends Mol Med 2012; 18: 446–453. [DOI] [PubMed] [Google Scholar]
- 74. Ducloux D, Courivaud C, Bamoulid J et al. Polyclonal antithymocyte globulin and cardiovascular disease in kidney transplant recipients. J Am Soc Nephrol 2014; 25: 1349–1356. [DOI] [PMC free article] [PubMed] [Google Scholar]
- 75. Opelz G, Dohler B. Lymphomas after solid organ transplantation: a collaborative transplant study report. Am J Transplant 2004; 4: 222–230. [DOI] [PubMed] [Google Scholar]
- 76. Shim JS, Song BM, Lee JH et al. Cardiovascular and metabolic diseases etiology research center (CMERC) cohort: study protocol and results of the first 3 years of enrollment. Epidemiol Health 2017; 39: e2017016. [DOI] [PMC free article] [PubMed] [Google Scholar]
- 77. Wu J, Liu D, Tu W, Song W, Zhao X. T‐cell receptor diversity is selectively skewed in T‐cell populations of patients with Wiskott‐Aldrich syndrome. J Allergy Clin Immunol 2015; 135: 209–216. [DOI] [PubMed] [Google Scholar]
Associated Data
This section collects any data citations, data availability statements, or supplementary materials included in this article.
Supplementary Materials
Supplementary figure 1
Supplementary figure 2
Supplementary figure 3
Supplementary figure 4
Supplementary figure 5
Supplementary figure 6