

Abstract

The hydrochlorination process is a necessary technological step for the production of polycrystalline silicon using the Siemens method. In this work, the adsorption behaviors of silicon tetrachloride (SiCl4), silicon dichloride (SiCl2), dichlorosilane (SiH2Cl2), trichlorosilane (SiHCl3), HCl, and H2 on the Si(100) surface were investigated by first-principles calculations. The different adsorption sites and adsorption orientations were taken into account. The adsorption energy, charge transfer, and electronic properties of different adsorption systems were systematically analyzed. The results show that all of the molecules undergo dissociative chemisorption at appropriate adsorption sites, and SiHCl3 has the largest adsorption strength. The analysis of charge transfer indicates that all of the adsorbed molecules behave as electron acceptors. Furthermore, strong interactions can be found between gas molecules and the Si(100) surface as proved by the analysis of electronic properties. In addition, SiCl2 can be formed by the dissociation of SiCl4, SiH2Cl2, and SiHCl3. The transformation process from SiCl4 to SiCl2 is exothermic without any energy barrier. While SiH2Cl2 and SiHCl3 can be spontaneously dissociated into SiHCl2, SiHCl2 should overcome about 110 kJ/mol energy barrier to form SiCl2. Our works can provide theoretical guidance for hydrochlorination of SiCl4 in the experimental method.
1. Introduction
Polycrystalline silicon has been regarded as the critical raw material for solar cell manufacturing,1,2 and the Siemens process is widely used to produce polycrystalline silicon.3 However, the entire process produces large amounts of silicon tetrachloride (SiCl4) and HCl as byproducts.4,5 By employing hydrogenation technology, this excess SiCl4 can be converted back into useful trichlorosilane (SiHCl3), which is the starting material for chemical vapor deposition of polycrystalline silicon.6,7 In general, there are two hydrogenation routes, namely, thermal hydrogenation8 and hydrochlorination.9 The first route involves the hydrogenation of SiCl4 at a high temperature (>1373 K).8 The overall reaction is
| 1 |
The second one is known as hydrochlorination,10,11 which has a lower energy consumption and higher conversion in comparison with thermal hydrogenation. The reacting system is as follows
| 2 |
However, the hydrochlorination of SiCl4 is relatively complex,12,13 and there are some intermediate products generated during the formation of SiHCl3, such as SiCl2,14 SiH2Cl2,15 and so on. There is still no consensus about the complex reactions which can occur, especially concerning the gas–silicon surface interactions. Currently, the first-principles calculations can effectively reveal the microcosmic interactions of the gas–silicon surface.
The Si(100) surface is proved to be very stable because of the low surface energy, and it undergoes reconstruction after full relaxation, i.e., the undercoordinated surface Si atom pair usually results in the formation of dimers.16,17 Therefore, the interactions between the active silicon surface and gas molecules have received extensive investigations. For instance, Hall et al.18 used the density functional theory (DFT) method to study the adsorption behaviors of chlorosilanes (SiH2Cl2, SiHCl3, and SiCl4) on the Si(100) surface and found that the scission of SiH2Cl2 and SiHCl3 is more inclined to pass through the Si–Cl bond instead of the Si–H bond. Ng et al.19 employed the DFT computation to investigate the microcosmic mechanism for disilane (Si2H6) adsorption on Si(100). They found that Si2H6 is dissociative adsorbed on the Si(100) surface, and the Si–H bonds are more prone to rupture compared with Si–Si bonds. Besides, some interesting phenomena can be observed after single-molecule adsorption on Si(100). For example, the SiCl2, SiCl3, and SiCl4 clusters can be formed after the Si atom is adsorbed on the chlorinated Si(100) surface.20 When the Cl atom is adsorbed on the Si(100) surface under ultrahigh vacuum conditions, the dissociated Cl2 and the active Cl radicals can lead to the formation of SiCl4.21 Additionally, in contrast with the dissociative adsorption suggested by some available kinetic models, Anzai et al.22 indicated that SiCl2 undergoes molecular adsorption at the Si(100) surface. However, the systematic investigations on the adsorption and reaction mechanism of byproducts generated by the Siemens process (including chlorosilanes, HCl, and H2) on the Si(100) surface are still lacking, which is difficult to be studied by the traditional experimental method.
Therefore, the first-principles calculations were adopted to simulate the adsorption behaviors of chlorosilanes (SiCl4, SiCl2, SiH2Cl2, and SiHCl3), H2, and HCl on the Si(100) surface in this work, which aims to reveal the gas–silicon surface interactions in the hydrochlorination process of SiCl4. The adsorption energy, charge transfer, and electronic properties, including total charge density (TCD), charge density difference (CDD), and density of states (DOS) of the gas–silicon surface, were also revealed. The results of this study help to provide a theoretical basis for exploring the reaction mechanism and experimental work of the hydrochlorination of SiCl4.
2. Calculation Methods and Models
2.1. Calculation Method
In this work, the Dmol3 package23,24 with the dual numerical plus polarization (DNP) basis set was used to perform all of the DFT calculations.25 To treat the electron change and correlation interactions,26 the Perdew–Burke–Ernzerhof (PBE)27−30 form of the generalized gradient approximation (GGA) functional31,32 was selected. Specifically, the Brillouin zone integrations were performed using a Monkhorst–Pack grid of 6 × 6 × 1 k points, and all calculations were nonspin polarized.33 We chose the 4.6 Å cutoff radius for geometry optimization, where a smearing value of 0.005 Ha was employed for rapid convergence. Effective core potential (ECP) of the Hartree–Fock potential is used to treat inner electrons.34 When the force of relaxed atoms is lower than 5 × 10⁻⁵ Ha, SCF tolerance is lower than 5 × 10⁻⁶ Ha, the force change between two steps is smaller than 0.02 Ha/Å, and the atomic structures tend to be stable. To avoid the interaction of each layer during the calculations, a vacuum layer thickness of 15 Å was added to the top of the Si(100) surface.35 The adsorption energy (Eads) is calculated as follows
| 3 |
where Egas/Si(100) is the total energy of Si(100) with gas adsorption and Egas and ESi(100) are the total energies of the isolated gas molecule and Si(100) surface, respectively.
The charge density difference (Δρ) is calculated using the following expression
| 4 |
where ρgas/Si(100), ρgas, and ρSi(100) are the charge density of gas adsorbed on the Si(100) surface, free gas molecule, and Si(100) surface, respectively.
2.2. Surface Model
Silicon (Si) has a diamond-like and tetrahedral structure, and the optimized lattice parameter (5.470 Å) and bulk modulus (91.1 GPa) in this work are consistent with the experimental result (5.500 Å36 and 97.8 GPa37). The adsorption energies of SiCl4 on seven and nine38−40 atomic layers (Figure 1a,b) at the top1 site were calculated. Both cases belong to dissociative adsorption (SiCl3* + Cl*), and the slab with seven atomic layers is large enough. Thus, to improve the calculated efficiency, seven atomic layers of Si(100) were selected in this work. Si(100) is modeled with p(3 × 3) supercells with seven atomic layers, and the surface energy is calculated to be 153 mJ/m2, which is also close to the theoretical values41 of 100–200 mJ/m2. Our calculation results are in good agreement with the experimental and theoretical values, which verifies the accuracy of this calculation. The bottom layer was passivated with two hydrogen atoms per silicon atom, as shown in Figure 1a. During the calculation process, the bottom two layer atoms are fixed,29,42 and the other layer atoms and adsorbed molecules are relaxed. Figure 1 shows the Si(100) surface structure, which contains the three dimers, and the middle dimer is selected as the adsorption site. To determine the most stable structure of gas molecules on Si(100), four possible adsorption sites are considered, including top1 (top of Si3), top2 (top of Si4), bridge (bridge site of the Si3–Si4 bond), and hole (central site of the middle dimer) sites, as shown in Figure 1b, and the four Si atoms in the first layer are marked with “Si1”, “Si2”, “Si3”, and “Si4”, respectively. Taking the SiCl4 molecule as an example, the adsorption styles of gas molecules are plotted in Figure 1d–f.
Figure 1.

(a) Nine atomic layers of the Si(100) structure and (b) side view and (c) top view of seven atomic layers of the Si(100) structure, and different adsorption styles for the SiCl4 molecule: (d) hole site, (e) top site, and (f) bridge site.
3. Results and Discussion
3.1. Stability and Geometric Structures
First, we calculate the adsorption energy of gas molecules on the Si(100) surface at different adsorption sites, as listed in Table 1. One can see that SiCl4, SiCl2, SiH2Cl2, SiHCl3, HCl, and H2 molecules are preferentially adsorbed at the bridge, top2, hole, hole, top1, and bridge sites with the Eads of −2.46, −2.18, −1.86, −2.63, −2.60, and −1.96 eV, respectively. Moreover, the adsorption strength of SiHCl3 is larger than those of the other gas molecules (SiCl4, SiCl2, SiH2Cl2, HCl, and H2) due to the higher adsorption energy.
Table 1. Adsorption Energies and Corresponding Adsorption Products on Different Adsorption Sites of the Si(100) Surfacea.
| molecule | adsorption site | reaction products | Eads (eV) |
|---|---|---|---|
| SiCl4 | top1 | SiCl3* + Cl* | –1.57 |
| top2 | SiCl3* + Cl* | –1.73 | |
| bridge | SiCl2* + 2Cl* | –2.46 | |
| hole | SiCl* + 3Cl* | –1.99 | |
| SiCl2 | top1 | SiCl2* | –1.88 |
| top2 | SiCl2* | –2.18 | |
| bridge | SiCl2* | –2.06 | |
| hole | SiCl* + Cl* | –2.17 | |
| SiH2Cl2 | top1 | SiH2Cl* + Cl* | –1.47 |
| top2 | SiH2Cl2* | –0.18 | |
| bridge | SiH2Cl2* | –0.19 | |
| hole | SiHCl2* + H* | –1.86 | |
| SiHCl3 | top1 | SiHCl2* + Cl* | –1.96 |
| top2 | SiHCl2* + Cl* | –1.91 | |
| bridge | SiHCl2* + Cl* | –1.82 | |
| hole | SiHCl* + 2Cl* | –2.63 | |
| HCl | top1 | H* + Cl* | –2.60 |
| top2 | HCl* | –0.10 | |
| bridge | HCl* | –0.11 | |
| hole | H* + Cl* | –2.59 | |
| H2 | top1 | H2* | –0.08 |
| top2 | H2* | –0.09 | |
| bridge | 2H* | –1.96 | |
| hole | H2* | –0.09 |
Here, * denotes a surface site.
Figure 2 gives the most stable configurations of SiCl4, SiCl2, SiH2Cl2, SiHCl3, HCl, and H2 adsorbed on the Si(100) surface. We can find that most of the molecules are dissociative adsorption on Si(100) except for the SiCl2 molecule, and all of the gas molecules strongly interact with the Si(100) surface by a chemical bond. This outcome indicates that those adsorption processes belong to chemisorption. The SiCl4 molecule can be spontaneously dissociated into SiCl2 and two Cl atoms as plotted in Figure 2a1,b1, and the bond length of Si–Cl1 and Si–Cl4 is stretched from 2.043 Å (experimental result is 2.090 Å43) to 5.177 and 3.906 Å, respectively. For the SiCl2 molecule, it is vertically adsorbed on the surface, and the Si atom of SiCl2 bonds with two nearest-neighbor Si atoms of the Si(100) surface, which matches well with the results obtained by Anzai.22 In addition, the SiH2Cl2 molecule spontaneously dissociates into SiHCl2 and one H atom, while the SiHCl3 molecule dissociates into SiHCl and two Cl atoms, as shown in Figure 2a3,a4. Also, the HCl and H2 molecules are spontaneously dissociated into a single atom (H and Cl) after full relaxation, and the decomposed H and Cl atoms bond with Si atoms of Si(100).
Figure 2.

Top view (a1–a6) and side view (b1–b6) of the lowest-energy structures of different gas molecules absorbed on the Si(100) surface. The unit of bond length is Å.
The charge transfer (ΔQ) can be employed to evaluate the interaction strength between gas molecules and the Si(100) surface,44,45 and it should be pointed out that the negative (positive) value means the gas molecule gains (loses) electrons. The charge transfer number for adsorption systems is correlated with different adsorption sites. Table 2 gives out the calculated ΔQ of the most stable adsorption systems based on the Hirshfeld charge. One can see that the electrons transferred from the Si(100) surface to SiCl4, SiCl2, SiH2Cl2, SiHCl3, HCl, and H2 molecules are 0.241, 0.061, 0.109, 0.288, 0.214, and 0.136 e, respectively. This outcome indicates that all of the gas molecules behave as electron acceptors, while the Si(100) surfaces act as electron donors. From Table 2, the SiHCl3 gas molecule obtains the maximum electrons and thus exhibits the largest adsorption strength, which agrees well with the above results of Eads.
Table 2. Charge Number (ΔQ, e) Transferred from the Si(100) Surface to Different Molecules for the Most Stable Adsorption Systemsa.
| molecule | adsorption site | reaction products | ΔQ (e) |
|---|---|---|---|
| SiCl4 | bridge | SiCl2* + 2Cl* | –2.46 |
| SiCl2 | top2 | SiCl2* | –2.18 |
| SiH2Cl2 | hole | SiHCl2* + H* | –1.86 |
| SiHCl3 | hole | SiHCl* + 2Cl* | –2.63 |
| HCl | top1 | H* + Cl* | –2.60 |
| H2 | bridge | 2H* | –1.96 |
Here, * denotes a surface site.
3.2. Adsorption of Chlorosilane Molecules on the Si(100) Surface
To further understand the microcosmic interactions of the gas–silicon surface, the total charge density (TCD) and charge density difference (CDD) of the SiCl4–Si(100) adsorption system were calculated and are shown in Figure 3. The strong overlapping of TCD can be found between SiCl4 and the Si(100) surface (shown in Figure 3a), which indicates that the SiCl4 molecule strongly interacts with the Si(100) surface. Moreover, from Figure 3b, there are large blue regions around SiCl4, which indicates that a large number of electrons are transferred from the Si(100) surface to SiCl4. Thus, the SiCl4 molecule acts as an electron acceptor, which agrees well with the results of Hirshfeld charge analysis.
Figure 3.
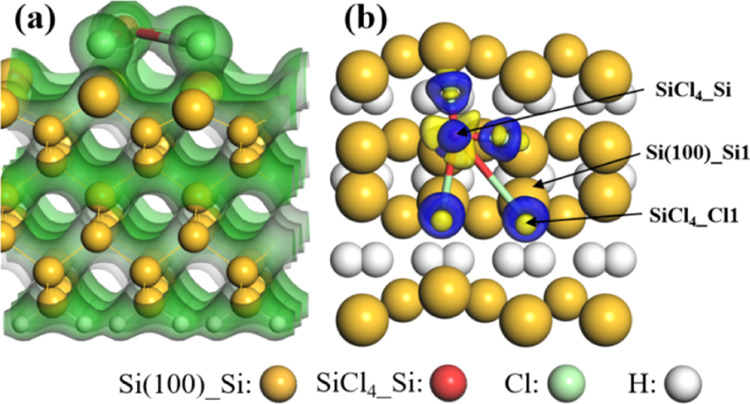
(a) Total charge densities (TCD) and (b) charge density differences (CDD) of SiCl4 adsorbed on the Si(100) surface. The green represents charge, and the blue (yellow) areas are electron aggregation (depletion). The isosurface values of TCD and CDD are 0.2 and ±0.02 e/Å3, respectively.
Figure 4 displays the total density of states (TDOS) of the SiCl4–Si(100) adsorption system. As presented in Figure 4a,b, the TDOS curve shifts to the left as a whole after SiCl4 adsorption, resulting in a decrease of total electron energy and making the electron more localized. After adsorption, the TDOS of SiCl4 shifts to lower energy and the peaks become broader and lower, making the electron more delocalized. Moreover, the number of peaks is reduced after SiCl4 adsorption, and the adsorbed SiCl4 molecule saturates the Si atoms of the Si(100) surface, which indicates that the SiCl4 molecule can be stably adsorbed on the Si(100) surface. As shown in Figure 4b,c, the orbital hybridizations between SiCl4 and Si(100) mainly occur in the range of −12.50 to 0 eV (the green slash box area), and two resonance peaks can be observed at about −15.60 and 1.88 eV (the blue dashed outline), leading to the strong interaction between SiCl4 and the Si(100) surface. Also, there are small peaks in the range of −17 to −15 eV (the red shaded area), and these peaks are contributed from SiCl4.
Figure 4.

Total density of states (TDOS) of SiCl4 before adsorption (a) and after adsorption (b), Si(100) surface before adsorption (c) and after adsorption (d). The vertical black dashed line represents the Fermi level.
The partial density of states (PDOS) of the SiCl4–Si(100) adsorption system is plotted in Figure 5. In Figure 5a,b, there is a resonance peak at −15.6 eV (the blue shaded area), which illustrates that the dissociated Cl1 atom from SiCl4 strongly interacts with the Si1 atom of the Si(100) surface. Meanwhile, it can be seen that there is an obvious electron orbital overlap between the p orbital of the Cl1 atom and s, p orbitals of the Si1 atom in the energy range of −7.5 to 0 eV (the violet slash box area), which also indicates that there are strong hybridizations among these atomic orbitals.
Figure 5.

PDOS for (a) Cl1 atoms of SiCl4 and (b) Si1 atoms of the Si(100) surface after adsorption. The vertical black dashed line represents the Fermi level.
For SiCl2, two different adsorption styles are considered. The first one is the SiCl2 molecule adsorbed on the top2 site of the Si(100) surface vertically. There is an obvious charge overlap between the SiCl2 molecules and Si(100) (Figure 6a), namely, the SiCl2 molecule interacts strongly with Si(100). From the CDD (Figure 6b), we can find that significant charge accumulation occurs around the SiCl2 molecule, indicating that extremely strong covalent bonds are formed on the surface; thus, SiCl2 acts as an electron acceptor. The results of PDOS (Figure 6d) show that there exist three resonance peaks at about −8.76, −1.70, and 1.24 eV (the shaded blue part) between Si atoms of the SiCl2 molecule and Si1 atoms of the Si(100) surface, which suggests that the strong interaction of Si–Si1 takes place. The other one is the SiCl2 molecule adsorbed on the Si(100) surface in a parallel manner (Figure 6c), and its Eads is calculated to be −1.80 eV. It should be noted that the SiCl2 molecule undergoes dissociative chemisorption, and the Si–Cl bonds of the SiCl2 molecule are stretched from 2.109 to 2.292 and 2.507 Å, respectively. Nevertheless, from the view of adsorption energy, the vertical adsorption style of SiCl2 is much more stable.
Figure 6.
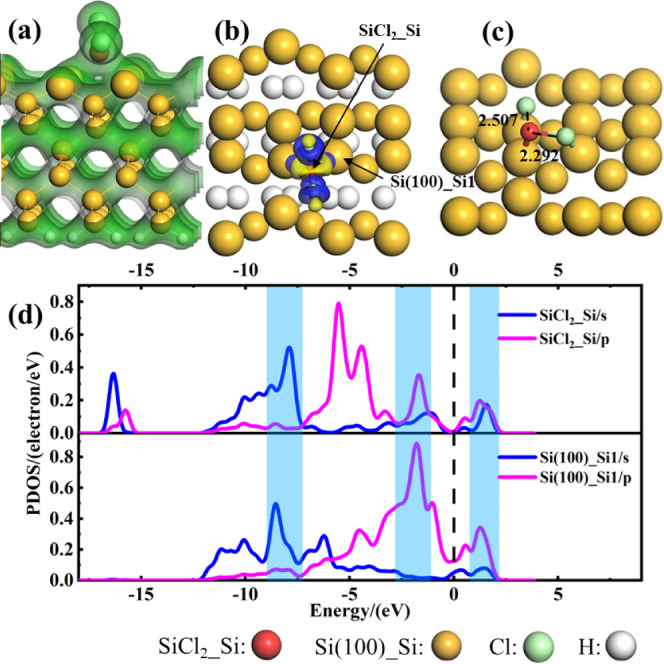
(a) TCD and (b) CDD of SiCl2 adsorbed on the Si(100) surface in a vertical adsorption style, (c) SiCl2 adsorbed on the Si(100) surface in a parallel adsorption style, (d) PDOS of Si atoms of SiCl2 and Si1 atoms of the Si(100) surface. The blue (yellow) areas in panel (b) represent electron aggregation (depletion). The vertical black dashed line represents the Fermi level. The unit of bond length is Å. The isosurface values of TCD and CDD are 0.2 and ±0.02 e/Å3, respectively.
When SiH2Cl2 is adsorbed on the Si(100) surface, the charge of SiH2Cl2 overlaps with the charge of Si(100) (Figure 7a), indicating that the SiH2Cl2 molecule interacts with the Si(100) surface. The CDD (Figure 7b) shows that the electron accumulation is mainly localized on the SiH2Cl2 molecule, manifesting the electron-withdrawing property of SiH2Cl2. As displayed in Figure 7c, the H2-s orbital is greatly hybrid with Si4-s,p orbitals ranging from −9.50 to 0 eV (the violet slash box area), which indicates that the interactions between SiH2Cl2 and the Si(100) surface are strong.
Figure 7.

(a) TCD and (b) CDD of SiH2Cl2 adsorbed on the Si(100) surface, (c) PDOS of H2 atoms of SiH2Cl2 and Si4 atoms of the Si(100) surface. The green areas in panel (a) represent the charge density, and the blue (yellow) areas in panel (b) represent electron aggregation (depletion). The vertical black dashed line represents the Fermi level. The isosurface values of TCD and CDD are 0.2 and ±0.02 e/Å3, respectively.
In Figure 8a, there are charge exchanges and overlaps between SiHCl3 and the Si(100) surface, indicating that the SiHCl3 molecule strongly interacts with the Si(100) surface. The electron density around the adsorbed SiHCl3 is significantly increased, as proved by the CDD in Figure 8b, and this suggests that many electrons of Si(100) are transferred to SiHCl3. Additionally, the strong charge transfer indicates the bonding effect. The results of PDOS (Figure 8d) show that there exist two strong resonance peaks (the blue shaded part) at −15.60 eV between Cl3-s and Si4-s orbitals and at −3.28 eV between Cl3-p and Si4-s,p orbitals, respectively, resulting in the strong interaction between SiHCl3 and the Si(100) surface.
Figure 8.

(a) TCD and (b) CDD of SiHCl3 adsorbed on the Si(100) surface, (c) top view of the optimized SiHCl3–Si(100) structure at the bridge site, (d) PDOS of Cl3 atoms of SiHCl3 and Si4 atoms of the Si(100) surface. The green areas in panel (a) represent the charge density, the blue (yellow) areas in panel (b) represent electron aggregation (depletion). The vertical black dashed line represents the Fermi level. The unit of bond length is Å. The isosurface values of TCD and CDD are 0.2 and ±0.02 e/Å3, respectively.
Based on the above results, both SiH2Cl2 and SiHCl3 are strongly adsorbed on the Si(100) surface at the hole site, and the adsorption strength of SiHCl3 is larger than that of SiH2Cl2. Moreover, SiH2Cl2 is chemically dissociated into the H atom and SiHCl2 molecule. The SiHCl3 molecule can dissociate into the SiHCl2 molecule and Cl atom after adsorption (Figure 8c). The corresponding adsorption energy is calculated to be −1.82 eV. When SiHCl3 is adsorbed at the bridge site, one of the Si–Cl bonds in the SiHCl3 molecule is stretched from 2.052 to 3.979 Å. It is worth noting that the calculated adsorption behavior of a single H atom and Cl atom on the hole site of the Si(100) surface is shown in Figure 9. These two atoms are bonding with the Si(100) surface, and the corresponding adsorption energies are calculated to be −3.82 and −4.21 eV, respectively. The Si(100) surface has a larger affinity with SiHCl3 in comparison with SiH2Cl2, and this difference may be due to the fact that the adsorption capacity of a single Cl atom is stronger than that of the H atom on the Si(100) surface.
Figure 9.

Lowest-energy structures of (a) single H atom and (b) single Cl atom absorbed on the Si(100) surface. The unit of bond length is Å.
3.3. Adsorption of HCl and H2 Molecules on the Si(100) Surface
From the TCD in Figure 10a, one can see that the charge overlaps between HCl and the Si (100) surface, which means that strong covalent bonds are formed between HCl and the Si(100) surface. Hou et al.46 found that HCl was dissociative adsorbed on the Si(100) surface and H and Cl atoms adhered to the Si(100) surface, which is consistent with our conclusions in this work. From the CDD (Figure 10b), the HCl molecule is electron-rich, which indicates that the loss charges of the Si(100) surface are transferred to the HCl molecule. The results of PDOS (Figure 10c) show that the hybridizations between the Cl-s and Si4-s,p orbitals are found from −9.50 to −3.70 eV (the violet slash box area) in the valance band, and one strong resonance peak can also be observed at −3 eV (the blue shaded part), which indicates that the covalent bonding is formed between HCl and the Si(100) surface.
Figure 10.

(a) TCD and (b) CDD of HCl adsorbed on the Si(100) surface, (c) PDOS of H atoms of HCl and Si4 atoms of the Si(100) surface. The green areas in panel (a) represent the charge density, the blue (yellow) areas in panel (b) represent electron aggregation (depletion). The vertical black dashed line represents the Fermi level. The isosurface values of TCD and CDD are 0.2 and ±0.02 e/Å3, respectively.
From the TCD in Figure 11a, the charge of the H2 molecule overlaps that of the Si(100) surface when H2 is adsorbed on the Si(100) surface, which indicates that there is an interaction between the H2 molecule and the Si(100) surface. From the CDD (Figure 11b), one can see that the H2 molecule adheres to the Si(100) surface after adsorption, which agrees well with the experimental observation by Dürr.47 Additionally, the results of charge transfer indicate that the H2 molecule acts as an electron acceptor, while the Si(100) surface acts as an electron donor. As shown in Figure 11c, the orbital hybridizations between the H2 molecule and Si(100) surface mainly occur in the range of −9.50 to −1.25 eV (the violet slash box area), meaning that the H2 molecule interacts strongly with the Si(100) surface.
Figure 11.
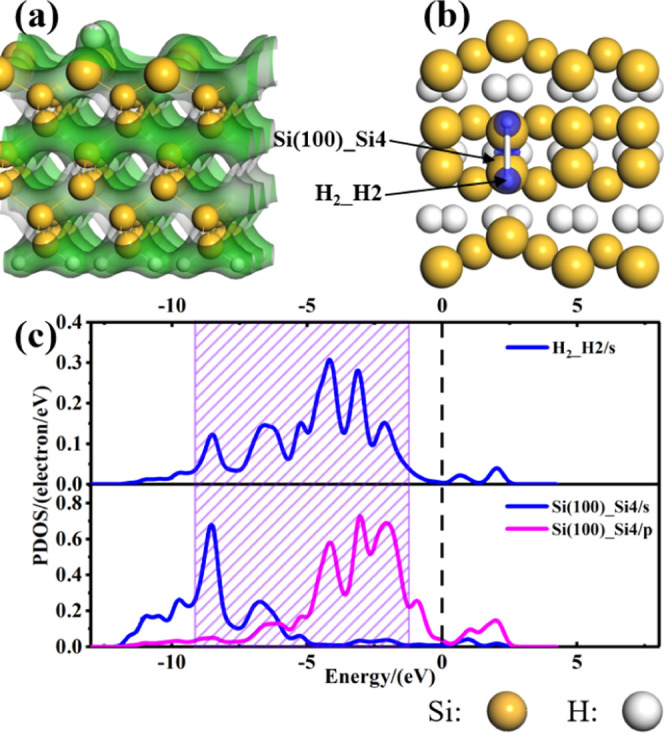
(a) TCD and (b) CDD of H2 adsorbed on the Si(100) surface, (c) PDOS of H2 atoms of H2 and Si4 atoms of the Si(100) surface. The green areas in panel (a) represent the charge density, the blue (yellow) areas in panel (b) represent electron aggregation (depletion). The vertical black dashed line represents the Fermi level. The isosurface values of TCD and CDD are 0.2 and ±0.02 e/Å3, respectively.
Both the HCl and H2 molecules undergo dissociative chemisorption. For HCl, the most stable adsorption site is the top1 site and the Eads is −2.60 eV; both H and Cl atoms form stable chemical bonds with the Si(100) surface. For H2, the most stable adsorption site is the bridge site and the Eads is −1.96 eV; H atoms form stable chemical bonds with the Si(100) surface. Moreover, the H2 adsorbed on other sites (top and hole sites) belongs to physical adsorption; thus, the adsorption of H2 is more inclined to adsorb on the bridge site instead of the top and hole sites. These results suggest that Si(100) has a stronger adsorption ability for HCl in comparison with H2. This difference could be due to the smaller radius of the H atom in comparison to the Cl atom, leading to the weaker interaction with surrounding Si surface atoms. Furthermore, the sticking coefficient of H2 on silicon surfaces is extremely small.48
3.4. SiCl2 Formation and SiHCl3 Formation Mechanism
It is known that SiCl2 is an essential intermediate product for the production of polysilicon by the Siemens process,46 which can promote the formation of SiHCl3.49 Yadav33 studied that the formation of SiCl2 may arise from the Si atoms of Si(100) and Cl atoms. There are three ways to form SiCl2, that is, the SiCl4/SiH2Cl2/SiHCl3 molecule dissociates into SiCl2. Our results show that SiCl4, SiH2Cl2, and SiHCl3 undergo dissociative chemisorption after they are adsorbed on the Si(100) surface. Moreover, the SiCl4 adsorption leads to the formation of SiCl2 (Figure 12a), which indicates that the SiCl2 molecule is spontaneously formed during SiCl4 adsorption. Specifically, the minimum energy path (MEP) to search for the involved transition state in SiCl2 formation was obtained by LST/QST tools34,50 in DMol3 code 8.0. The barrier energy Ea reported herein was calculated as follows
| 5 |
where EIS and ETS represent the total energy of the initial state (IS) and transition state (TS), respectively.
Figure 12.

Pathway for the (a) SiCl4 molecule dissociates into SiCl2* + 2Cl*, (b) SiHCl3 molecule dissociates into SiHCl2 + Cl, and (c) SiH2Cl2 molecule dissociates into SiHCl2 + H.
For SiH2Cl2 and SiHCl3, they are only spontaneously dissociated into SiHCl2 after adsorptions on the Si(100) surface, as illustrated in Figure 12b,c, whereas SiHCl2 is hardly further dissociated on the Si(100) surface. Therefore, the transition of SiHCl2 to SiCl2 should overcome a certain energy barrier. As shown in Figure 13, the reaction of SiHCl2 to SiCl2 on Si(100) is exothermic with an energy of 44.38 kJ/mol, and the calculated reaction barrier is about 110.00 kJ/mol, which is smaller than that of SiHCl2 dissociating into SiCl2 on the Si(111) surface (147.90 kJ/mol).34 In conclusion, SiCl4 can be directly dissociated into SiCl2 on the Si(100) surface. By contrast, SiH2Cl2 and SiHCl3 molecules first dissociate into SiHCl2* without zero energy barrier, and then, the SiHCl2 molecule converted into SiCl2 needs to overcome an energy barrier of 110.00 kJ/mol. Thus, SiCl4 is more beneficial to promote the formation of SiCl2 compared with SiHCl3 and SiH2Cl2 molecules.
Figure 13.

Potential energy profiles of SiHCl2 dissociation into SiCl2 + H.
The primary purpose of the hydrochlorination process is to convert SiCl4 to SiHCl3. However, it is difficult to convert all SiCl4 to SiHCl3 directly. SiCl2 is a major intermediate in the hydrochlorination process, which is favorable to the formation of SiHCl3.48 Hence, SiCl2 is a prime candidate and can react with the surface-adsorbed Cl and H atoms to produce SiHCl3. The H and Cl required for SiCl2 and SiHCl3 would be supplied from HCl dissociative adsorption. Therefore, a possible reaction mechanism is proposed through the following basic processes
| 6 |
| 7 |
| 8 |
4. Conclusions
First-principles calculations were employed to investigate the adsorption behaviors of silicon tetrachloride (SiCl4), silicon dichloride (SiCl2), dichlorosilane (SiH2Cl2), trichlorosilane (SiHCl3), HCl, and H2 molecules on the Si(100) surface, and the electronic properties of different adsorption systems were analyzed. The results show that all of the gas molecules can bond with the Si(100) surface and even undergo dissociative chemisorption, and SiHCl3 has stronger adsorption strength compared with the other molecules. Hirshfeld charge analysis reveals that all of the adsorbed molecules on the Si(100) surface behave as electron acceptors. Moreover, strong interactions can be found between gas molecules and the Si(100) surface as proved by the analysis of TCD, CDD, and DOS. Additionally, SiCl2 can be formed by SiCl4 with zero barrier paths. However, SiH2Cl2 and SiHCl3 can be spontaneously dissociated into SiHCl2*, and then, the intermediate product SiHCl2* needs to overcome an energy barrier of 110 kJ/mol to produce SiCl2. Our results can provide a necessary theoretical basis for the reaction mechanism and experimental work of silicon tetrachloride hydrochlorination.
Acknowledgments
The authors gratefully acknowledge the National Natural Science Foundation of China (Grant No. 51904137), Special Basic Cooperative Research Programs of Yunnan Provincial Undergraduate Universities’ Association (Grant No. 202101BA070001-032), Basic Research Project of Yunnan Province (202201AT070017) and Scientific Research Funds of Yunnan Education Department (2022Y718 and 2022Y750) for financial support. The authors also thank the High-Level Talent Plans for Young Top-notch Talents of Yunnan Province (Grant No. YNWR-QNBJ-2020-017) and High-Level Talent Special Support Plans for Young Talents of Kunming City (Grant No. C201905002).
The authors declare no competing financial interest.
References
- Zou X.; Ji L.; Ge J.; Sadoway D. R.; Edward T. Y.; Bard A. J. Electrodeposition of crystalline silicon films from silicon dioxide for low-cost photovoltaic applications. Nat. Commun. 2019, 10, 5772 10.1038/s41467-019-13065-w. [DOI] [PMC free article] [PubMed] [Google Scholar]
- Villicaña-García E.; Ramírez-Márquez C.; Segovia-Hernández J. G.; Ponce-Ortega J. M. Planning of intensified production of solar grade silicon to yield solar panels involving behavior of population. Chem. Eng. Process.: Process Intensif. 2021, 161, 108241 10.1016/j.cep.2020.108241. [DOI] [Google Scholar]
- Nie Z.; Wang Y.; Wang C.; Guo Q.; Hou Y.; Ramachandran P. A.; Xie G. Mathematical model and energy efficiency analysis of Siemens reactor with a quartz ceramic lining. Appl. Therm. Eng. 2021, 199, 117522 10.1016/j.applthermaleng.2021.117522. [DOI] [Google Scholar]
- Wan Y.; Yan D.; Xiao J.; Chu D.; Zhang Y. Discussion on hydrogen quality detection methods for polysilicon production. J. Phys.: Conf. Ser. 2019, 1347, 012106 10.1088/1742-6596/1347/1/012106. [DOI] [Google Scholar]
- Braga A.; Moreira S.; Zampieri P.; Bacchin J.; Mei P. New processes for the production of solar-grade polycrystalline silicon: A review. Sol. Energy Mater. Sol. Cells 2008, 92, 418–424. 10.1016/j.solmat.2007.10.003. [DOI] [Google Scholar]
- Liu N.; Liu X.; Wang F.; Xin F.; Sun M.; Zhai Y.; Zhang X. CFD simulation study of the effect of baffles on the fluidized bed for hydrogenation of silicon tetrachloride. Chin. J. Chem. Eng. 2022, 45, 219–228. 10.1016/j.cjche.2021.04.003. [DOI] [Google Scholar]
- Ramírez-Márquez C.; Contreras-Zarazúa G.; Martín M.; Segovia-Hernández J. G. Safety, economic, and environmental optimization applied to three processes for the production of solar-grade silicon. ACS Sustainable Chem. Eng. 2019, 7, 5355–5366. 10.1021/acssuschemeng.8b06375. [DOI] [Google Scholar]
- Ding W.-J.; Wang Z.; Yan J.; Xiao W. CuCl-catalyzed hydrogenation of silicon tetrachloride in the presence of silicon: mechanism and kinetic modeling. Ind. Eng. Chem. Res. 2014, 53, 16725–16735. 10.1021/ie503242t. [DOI] [Google Scholar]
- Kunioshi N.; Moriyama Y.; Fuwa A. Kinetics of the conversion of silicon tetrachloride into trichlorosilane obtained through the temperature control along a plug-flow reactor. Int. J. Chem. Kinet. 2016, 48, 45–57. 10.1002/kin.20969. [DOI] [Google Scholar]
- Yadav S.; Chattopadhyay K.; Singh C. V. Solar grade silicon production: A review of kinetic, thermodynamic and fluid dynamics based continuum scale modeling. Renewable Sustainable Energy Rev. 2017, 78, 1288–1314. 10.1016/j.rser.2017.05.019. [DOI] [Google Scholar]
- Wu J.; Chen Z.; Ma W.; Dai Y. Thermodynamic estimation of silicon tetrachloride to trichlorosilane by a low temperature hydrogenation technique. Silicon 2017, 9, 69–75. 10.1007/s12633-015-9353-0. [DOI] [Google Scholar]
- Lee J. Y.; Lee W. H.; Park Y.-K.; Kim H. Y.; Kang N. Y.; Yoon K. B.; Choi W. C.; Yang O.-B. Catalytic conversion of silicon tetrachloride to trichlorosilane for a poly-Si process. Sol. Energy Mater. Sol. Cells 2012, 105, 142–147. 10.1016/j.solmat.2012.06.009. [DOI] [Google Scholar]
- Wang C.; Wang T.; Li P.; Wang Z. Recycling of SiCl4 in the manufacture of granular polysilicon in a fluidized bed reactor. Chem. Eng. J. 2013, 220, 81–88. 10.1016/j.cej.2013.01.001. [DOI] [Google Scholar]
- Vorotyntsev A. V.; Petukhov A. N.; Vorotyntsev I. V.; Sazanova T. S.; Trubyanov M. M.; Kopersak I. Y.; Razov E. N.; Vorotyntsev V. M. Low-temperature catalytic hydrogenation of silicon and germanium tetrachlorides on the modified nickel chloride. Appl. Catal., B 2016, 198, 334–346. 10.1016/j.apcatb.2016.06.017. [DOI] [Google Scholar]
- Ding W.-J.; Yan J.; Xiao W. Hydrogenation of silicon tetrachloride in the presence of silicon: thermodynamic and experimental investigation. Ind. Eng. Chem. Res. 2014, 53, 10943–10953. 10.1021/ie5019222. [DOI] [Google Scholar]
- Buehler E. J.; Boland J. J. Dimer preparation that mimics the transition state for the adsorption of H2 on the Si (100)-2 × 1 surface. Science 2000, 290, 506–509. 10.1126/science.290.5491.506. [DOI] [PubMed] [Google Scholar]
- Kuzmin M.; Lehtiö J.-P.; Rad Z.; Mäkelä J.; Lahti A.; Punkkinen M.; Laukkanen P.; Kokko K. Dimer-vacancy defects on Si (100): The role of nickel impurity. Appl. Surf. Sci. 2020, 506, 144647 10.1016/j.apsusc.2019.144647. [DOI] [Google Scholar]
- Hall M. A.; Mui C.; Musgrave C. B. DFT Study of the adsorption of chlorosilanes on the Si (100)-2 × 1 Surface. J. Phys. Chem. B 2001, 105, 12068–12075. 10.1021/jp0118874. [DOI] [Google Scholar]
- Ng R. Q. M.; Tok E.; Kang H. C. Molecular mechanisms for disilane chemisorption on Si (100)-(2 × 1). J. Chem. Phys. 2009, 130, 114702 10.1063/1.3089623. [DOI] [PubMed] [Google Scholar]
- Pavlova T. V.; Skorokhodov E. S.; Zhidomirov G. M.; Eltsov K. N. Ab initio study of the early stage of Si epitaxy on the chlorinated Si(100) surface. J. Phys. Chem. C 2019, 123, 19806–19811. 10.1021/acs.jpcc.9b06128. [DOI] [Google Scholar]
- Andryushechkin B. V.; Eltsov K.; Kuzmichev A.; Shevlyuga V. Electron-induced interaction of condensed chlorine with Si (100). Phys. Wave Phenom. 2010, 18, 303–312. 10.3103/S1541308X10040138. [DOI] [Google Scholar]
- Anzai K.; Kunioshi N.; Fuwa A. Analysis of the dynamics of reactions of SiCl2 at Si (100) surfaces. Appl. Surf. Sci. 2017, 392, 410–417. 10.1016/j.apsusc.2016.09.039. [DOI] [Google Scholar]
- Delley B. Time dependent density functional theory with DMol3. J. Phys.: Condens. Matter 2010, 22, 384208 10.1088/0953-8984/22/38/384208. [DOI] [PubMed] [Google Scholar]
- Delley B. From molecules to solids with the DMol3 approach. J. Chem. Phys. 2000, 113, 7756–7764. 10.1063/1.1316015. [DOI] [Google Scholar]
- Chen L.; Cheng Dg.; Chen F.; Zhan X. A density functional theory study on the conversion of polycyclic aromatic hydrocarbons in hydrogen plasma. Int. J. Hydrogen Energy 2020, 45, 309–321. 10.1016/j.ijhydene.2019.10.208. [DOI] [Google Scholar]
- Li K.; Li N.; Yan N.; Wang T.; Zhang Y.; Song Q.; Li H. Adsorption of small hydrocarbons on pristine, N-doped and vacancy graphene by DFT study. Appl. Surf. Sci. 2020, 515, 146028 10.1016/j.apsusc.2020.146028. [DOI] [Google Scholar]
- Hammer B.; Hansen L. B.; Nørskov J. K. Improved adsorption energetics within density-functional theory using revised Perdew-Burke-Ernzerh of functionals. Phys. Rev. B 1999, 59, 7413. 10.1103/PhysRevB.59.7413. [DOI] [Google Scholar]
- Shao X.; Li L.; Huang S.; Song Z.; Wang K. First-Principles Calculations of Magnetic Moment Modulation of 3d Transition Metal Atoms Encapsulated in C60/C70 Cages on Si (100) Surfaces: Implications for Spintronic Devices. ACS Appl. Nano Mater. 2021, 4, 12356–12364. 10.1021/acsanm.1c02827. [DOI] [Google Scholar]
- Pavlova T. V.; Shevlyuga V. M.; Andryushechkin B. V.; Eltsov K. N. Dangling bonds on the Cl-and Br-terminated Si (100) surfaces. Appl. Surf. Sci. 2022, 591, 153080 10.1016/j.apsusc.2022.153080. [DOI] [Google Scholar]
- Baek S. B.; Kim D. H.; Kim Y. C. Adsorption and surface reaction of bis-diethylaminosilane as a Si precursor on an OH-terminated Si (001) surface. Appl. Surf. Sci. 2012, 258, 6341–6344. 10.1016/j.apsusc.2012.03.033. [DOI] [Google Scholar]
- Orazi V.; Bechthold P.; Jasen P. V.; Faccio R.; Pronsato M. E.; Gonzalez E. A. DFT study of methanol adsorption on PtCo (111). Appl. Surf. Sci. 2017, 420, 383–389. 10.1016/j.apsusc.2017.05.159. [DOI] [Google Scholar]
- Grimme S. Semiempirical GGA-type density functional constructed with a long-range dispersion correction. J. Comput. Chem. 2006, 27, 1787–1799. 10.1002/jcc.20495. [DOI] [PubMed] [Google Scholar]
- Yadav S.; Singh C. V. Molecular adsorption and surface formation reactions of HCl, H2 and chlorosilanes on Si (100)-c(4 × 2) with applications for high purity silicon production. Appl. Surf. Sci. 2019, 475, 124–134. 10.1016/j.apsusc.2018.12.253. [DOI] [Google Scholar]
- Peng M.; Shi B.; Han Y.; Li W.; Zhang J. Crystal facet dependence of SiHCl3 reduction to Si mechanism on silicon rod. Appl. Surf. Sci. 2022, 580, 152366 10.1016/j.apsusc.2021.152366. [DOI] [Google Scholar]
- Nie Z.; Wang C.; Xue R.; Xie G.; Xiong H. Two-dimensional FePc and MnPc monolayers as promising materials for SF6 decomposition gases detection: Insights from DFT calculations. Appl. Surf. Sci. 2023, 608, 155119 10.1016/j.apsusc.2022.155119. [DOI] [Google Scholar]
- Tang Q.; Shen H.; Yao H.; Jiang Y.; Li Y.; Zhang L.; Ni Z.; Wei Q. Formation mechanism of inverted pyramid from sub-micro to micro scale on C-Si surface by metal assisted chemical etching temperature. Appl. Surf. Sci. 2018, 455, 283–294. 10.1016/j.apsusc.2018.05.023. [DOI] [Google Scholar]
- Hannah D. C.; Yang J.; Podsiadlo P.; Chan M. K.; et al. On the origin of photoluminescence in silicon nanocrystals: pressure-dependent structural and optical studies. Nano Lett. 2012, 12, 4200–4205. 10.1021/nl301787g. [DOI] [PubMed] [Google Scholar]
- Lim T. B.; McNab I. R.; Polanyi J. C.; Guo H.; Ji W. Multiple Pathways of Dissociative Attachment: CH3Br on Si (100)-2×1. J. Am. Chem. Soc. 2011, 133, 11534–11539. 10.1021/ja201060z. [DOI] [PubMed] [Google Scholar]
- Czekala P. T.; Lin H.; Hofer W. A.; Gulans A. Acetylene adsorption on silicon (100)-(4 × 2) revisited. Surf. Sci. 2011, 605, 1341–1346. 10.1016/j.susc.2011.03.024. [DOI] [Google Scholar]
- Nachimuthu S.; Chen T. R.; Yeh C. H.; Hong L. S.; Jiang J. C. Combined density functional theory and microkinetics study to predict optimum operating conditions of Si (100) surface carbonization by acetylene for high power devices. J. Phys. Chem. Lett. 2021, 12, 4558–4568. 10.1021/acs.jpclett.1c01044. [DOI] [PubMed] [Google Scholar]
- Pabianek K.; Krukowski P.; Polański K.; Ciepielewski P.; Baranowski J. M.; Rogala M.; Kozłowski W.; Busiakiewicz A. Interactions of Ti and its oxides with selected surfaces: Si (100), HOPG (0001) and graphene/4H-SiC (0001). Surf. Coat. Technol. 2020, 397, 126033 10.1016/j.surfcoat.2020.126033. [DOI] [Google Scholar]
- Yao X.; Wang J.; Wu G.; Goh S. S.; Zhu H.; Yang S. W. Theoretical study on the self-assembly of 1, 3, 5-triethynylbenzene on Si (100) 2 × 1 and in situ polymerization via reaction with CO to fabricate a single surface-grafted polymer. J. Mater. Chem. C 2017, 5, 3585–3591. 10.1039/C7TC00678K. [DOI] [Google Scholar]
- Ishikawa H.; Fujima K.; Adachi H.; Miyauchi E.; Fujii T. Calculation of electronic structure and photoabsorption spectra of monosilane molecules SiH4, SiF4, and SiCl4. J. Chem. Phys. 1991, 94, 6740–6750. 10.1063/1.460251. [DOI] [Google Scholar]
- Cao M.; Gao A.; Liu Y.; Zhou Y.; Sun Z.; Li Y.; He F.; Li L.; Mo L.; Liu R.; et al. Theoretical study on electronic structural properties of catalytically reactive metalloporphyrin intermediates. Catalysts 2020, 10, 224. 10.3390/catal10020224. [DOI] [Google Scholar]
- Brohi R. O. Z.; Khuhawar M. Y.; Mahar R. B.; Ibrahim M. A. Novel bimetallic nano particles for sorption of mercury (II) from drinking water: adsorption experiment and computational studies. J. Water Process Eng. 2021, 39, 101727 10.1016/j.jwpe.2020.101727. [DOI] [Google Scholar]
- Hou H.-Y.; Wu H.; Chung J.; Lin D. Adsorption of diatomic interhalogens on the Si (100) and Ge (100) surfaces. J. Phys. Chem. C 2011, 115, 13262–13267. 10.1021/jp201248u. [DOI] [Google Scholar]
- Dürr M.; Hu Z.; Biedermann A.; Höfer U.; Heinz T. Real-space study of the pathway for dissociative adsorption of H2 on Si(001). Phys. Rev. Lett. 2002, 88, 046104 10.1103/PhysRevLett.88.046104. [DOI] [PubMed] [Google Scholar]
- Kunioshi N.; Anzai K.; Ushijima H.; Fuwa A. Effects of cluster size on calculation of activation energies of silicon surface reactions with H2 and HCl. J. Cryst. Growth 2015, 418, 115–119. 10.1016/j.jcrysgro.2015.02.068. [DOI] [Google Scholar]
- Yadav S.; Singh C. V. First principles investigation of HCl, H2, and chlorosilane adsorption on Cu3Si surfaces with applications for polysilicon production. J. Phys. Chem. C 2018, 122, 20252–20260. 10.1021/acs.jpcc.8b04460. [DOI] [Google Scholar]
- Wang Z.; Zhao J.; Cai Q.; Li F. Computational screening for high-activity MoS2 monolayer-based catalysts for the oxygen reduction reaction via substitutional doping with transition metal. J. Mater. Chem. A 2017, 5, 9842–9851. 10.1039/C7TA00577F. [DOI] [Google Scholar]