

Abstract
The paper examines the impact of GVC participation and position on overall employment creation and skill composition of the Indian workforce during 1990–2015. Arellano-Bond GMM dynamic panel estimation reveals that the expansion of size of a sector (in terms of higher value added) failed to generate employment opportunities, especially for the educated unemployed. However, stronger backward linkage is found to have labour displacing effect whereas stronger forward linkage has created employment opportunities but for the unskilled workers. Furthermore, the downstream sectors are found to generate more employment opportunities, whereas the upstream sectors are more skill intensive.
Keywords: GVC, Upstreamness, Employment, GMM dynamic panel, Labour quality
Introduction
Classical theories of trade including the Ricardian and Heckscher-Ohlin models have established that global output is maximized when countries engage in free trade. However, the distribution of the overall gain is related to demand conditions and its implications for terms of trade. These models are based primarily on trade in final goods, whereas trade in intermediate goods came to the fore from the early 1980’s, followed by intra-industry trade in differentiated products. Since then, international trade that started with the exchange of goods like cloth, wine, metals and raw materials has grown complex in nature over time. In the recent years, for about two-thirds of global trade, the stage of production crosses at least one border, and usually many borders, before final assembly takes place (World Bank & World Trade Organization Report, 2019). The highly fragmented production processes with different stages of production being carried out in different countries, has given rise to the phenomenon of Global Value Chains (GVCs). This is largely driven by investment strategies of the multinational corporations (MNCs) to outsource resources from cheaper sources and stay competitive in this highly globalized world.
The COVID-19 pandemic has disrupted global trade in both final good and intermediate goods, the latter being the main driver of GVCs. However, India’s relatively low participation in GVC along with the varied nature of GVC linkage could make Indian exports less vulnerable to disruptions in GVCs caused by the pandemic (Veeramani, 2020). Reduced world demand, nonetheless, is a cause of concern for growth of Indian exports and GDP growth. In the post-pandemic era, the sectors which have the potential to recover faster and create more employment opportunities for the domestic economy would require careful policy prescription. Given the predominance of the informal sector in the labour market, the pandemic has a greater negative impact on informal workers who often belong to the low skill category. Employment creation is now one of the topmost priorities of policy makers in India. Therefore, policy formulation in this regard must focus on ensuring maximum gains by participating in GVC and generating more livelihood opportunities.
Most of the existing studies analyzing the impact of GVC on trade and labor market outcomes mainly consider the importance of the extent of participation in value chain. Veeramani and Dhir [13] conducted a study of the Indian economy for 112 sectors spanning the period 1999–2013. They found that increased participation in global production sharing (GPS), as measured by the sectoral ratio of domestic value added (DVA) to gross exports led to job creation for the domestic economy due to the scale and productivity effects of a larger global market. Banga [5] examined the sectoral level impact of GVC participation on employment growth of India during 1995–2011. Using Fixed effects (FE) and GMM estimation, negative association was obtained between growth in backward linkages and growth in employment whereas forward linkage growth is found to have statistically insignificant impact on employment growth.
However, Guha-Khasnobis and Aditya [9] showed that mere participation in value chains is not enough, the exact position of countries/sectors in the value chain is important. A sector and/or country’s active participation in the value chain can have different implications on the domestic economy depending on its position in value chain – whether the sector and/or the country is near to the final consumer or it is supplying intermediate inputs. Guha-Khasnobis and Aditya [9] estimated the impact of participation in GVCs along with the average ‘upstreamness’ of exports as potential determinants of export diversification (both with respect to product and destination) after controlling for the impacts of income, human capital, and physical capital for the Commonwealth member countries. GMM dynamic panel Arellano-Bond (1991) estimation for the period 1990–2016 revealed that both extent of participation in the value chain and the position of a country are significant determinants of export diversification.
However, most of the studies which examine the implication of participation in GVC on employment only consider the impact of the extent of GVC participation on employment, not the position of the sectors in the value chain. Some exceptions include the study by Ma, Lianmg & Zhang (2019), Hagemejer et al. (2017), Szymczak et al. [14] and Gagliardi et al. [8]. Our study, on the other hand, considers both the extent of participation and the position of a sector in value chain, that is, whether it is up/downstream to analyze their impacts on employment generation of the sector. For this purpose, we use the measure of upstreamness index (UI) developed by Antras (2017) and Fally [7]. In this study, some sectors are required to be aggregated while matching data sources. The UI for these aggregated sectors is calculated by a weighted average of the Upstreamness indices of individual sectors, with the gross outputs ( of the sector are used as weights (Antras et al. 2017). Further, we also examine how the impact of GVCs may differ depending on the skill levels of the workers.
Thus, the objective of this study is to generate evidence on the interaction among growth, trade and employment in India. In particular, we examine whether since the 1990 growth has generated adequate employment for workers across different skill levels. Our main research question, nonetheless, is to investigate the impact different measures of GVC and the position of a sector in the GVC on employment opportunities for both skilled and unskilled workers. Rigorous empirical evidence on the above would be useful for targeting revival interventions by sector, with the twin purpose of generating more growth as well as employment across skill levels.
The paper is organized as follows. Section II specifies our model by describing the variables, data sources and sample. This is followed by the sector-wise analysis of the GVC indicators along with employment and labour quality elasticities in Section III. Section IV discusses the methodology of empirical estimation and the estimation results. Finally, Section V concludes the paper by summarizing the findings and the policy implications.
Model specification
In this section, we specify our model by describing the dependent and independent variables, data sources and sample. To evaluate the impact of GVC participation (both extent of participation and position) on the labour market, we estimate the following dynamic equation:
| 1 |
where i represents sector, t represents time, Y is the dependent variable. We estimate two alternative specifications with two dependent variables—one with employment (total number of persons employed in an industry) and the other with labour quality index. Labour quality is measured using the Tornqvist index that uses education and wages to gauge labour quality in a sector.The index uses 1980 as the base and takes the value 100 in the base year. X is the vector of sector-year specific explanatory variables which includes the GVC related measures of forward and backward linkages (FWL, BWL), GVC participation index (GVC), and upstreamness index (UI). We also investigate the impact of trade in gross exports instead of trade in intermediate input by replacing the GVC indicators and UI by export (gross) intensity. The set of explanatory variables also includes other potential determinants of employment and labour quality such as the size of sector (in terms of value-added—VA), capital stock (CAP) and the use of intermediate inputs (energy, material, and services). Finally, is the composite error term where . The term is an unobserved sector-specific time-invariant effect whereas is the random disturbance term that varies across both sectors and years and is assumed to be uncorrelated over time.
Note that alternative estimations are used for the different GVC variables (refer to Eqs. (2) and (3)). We also investigate the impact of gross exports which includes final as well as intermediate goods instead of trade in intermediate inputs only by replacing the GVC indicators and UI by export (gross) intensity (see Eq. (4)).
| 2 |
| 3 |
| 4 |
The GVC variables and upstreamness index used in this study are as follows:
Backward linkage (BWL)
It is represented by the ratio of the foreign value added (FVA) in (India’s) exports and (India’s) gross exports. Global comparisons often shed light on different reasons for high backward linkage. For instance, in the Asia Pacific region, Singapore has strong backward linkages due to its well-developed oil refining and trading hub. Therefore, Singapore first imports significant amounts of crude oil from other countries (high FVA), processes it at home, and re-exports it. Vietnam’s exports of electrical equipment require high technology imports and thus shows strong backward linkages but for different reasons from Singapore altogether.1
Forward linkage (FWL)
This measure indicates the value which a country’s/sector’s exports contributes to the exports of the foreign country. FWL is the ratio of value added by India in the exports of other countries (DVX) and its (India’s) own gross exports (GE). Thus, it is the supply side component of global value chains reflecting the extent to which a country, or a sector therein, contributes directly and indirectly to foreign country production processes. “Gainful participation” in GVCs requires strong forward linkage in a country. In such a case, forward linkages can potentially have positive impacts on employment in the domestic country. In addition, they also provide market access to domestic firms beyond their country which makes a strong case for strengthening GVC participation. Again, as was the case in backward linked country/sectors, different countries can have strong forward linkages for different reasons. Brunei, for instance, exports primary inputs and has a high forward participation rate compared to a country like Singapore.
GVC participation
The GVC participation index combines both forward and backward linkages to provide a complete picture of the extent of participation the global value chains. It is defined as GVC = (FVA + DVX)/GE. Higher values this metric indicate higher participation in GVCs: in other words, greater integration into the world trading architecture.
Upstreamness index (UI)
Intuitively, the UI can be thought of as the distance of a product from final use. A sector that sells a large proportion of its output for final use appears downstream in the value chain. A good example of downstream industries is merchandise exports (such as clothes) by India for final consumption in other countries. Similarly, sectors that are further away from the final consumer are more upstream in the value chain. Petroleum (unprocessed) industries, for instance, may contribute more as intermediate inputs as opposed to final consumption and appear higher up in the value chain. A higher UI values indicates that the sector is further away from the final consumer, therefore, more upstream in the GVC.
In a world with N countries and H economic sectors, I is the NH x NH identity matrix, A is the NH x NH Technical Coefficient Matrix, Y is the NH × 1 column vector of gross outputs and is the gross output of country i sector j in the Y matrix.
The data for the dependent variables and all the explanatory variables apart from the GVC indicators are obtained from the India KLEMS database. The data for GVC indicators is compiled using the EORA26 database which provides Input–Output tables and final demand tables for 26 sectors for the years from 1990 to 2015.2
For our study, we consider data from 1990 to 2015 to match EORA26 data availability. The sector classifications could be directly matched across the two data sources for 12 sectors. For the remaining sectors, those which were available at a higher level of disaggregation were aggregated to match the sectors in the other database. Finally, we carry out the analysis for 18 sectors after removing the outliers.
GVC metric rankings, employment and value-added across sectors of India
Evidence suggests that India’s participation in GVCs, especially in manufacturing, is low compared to its counterpart in the East and Southeast Asia [5, 12]. Compared to other labour abundant Asian countries like Bangladesh, Vietnam and China, India has lower level of backward participation (exports based on imported inputs or foreign value added—FVA) than forward participation (exports of raw materials and intermediate inputs or domestic value added, DVA). However, as far as the growth rates are concerned, during 1995–2011, India has experienced a decline in forward linkage (the share of domestic value added in gross exports of intermediate inputs) by 15% and increase in backward linkage (share of FVA in gross exports) by 14.7% [5].
To understand the sectoral variations, the 18 industries are ranked in terms of average FWL, BWL, Upstreamness and GVC Participation. India’s service sector industries such as trade, finance and business, post and telecommunications rank relatively high in terms of forward linkages as shown in Fig. 1. Despite low direct exports, these industries contribute indirectly to the output of other countries’ exports. Moreover, these industries also have low reliance on foreign inputs and rank lower in backward linkages (see Fig. 2) compared to manufacturing industries. Services such as hospitality, education and health rank in the middle in terms of both forward and backward linkages. Unlike trade and business, these services contribute less to exports of other countries. As far as upstreamness is concerned, India’s service sector industries are at the mid to lower range of the rankings and provide services directly to the final consumer (refer to Fig. 3).
Fig. 1.

Sectoral variation in forward linkages
Fig. 2.

Sectoral variation in backward linkages
Fig. 3.

Sectoral variation in upstreamness index
Second, a closer look at India’s manufacturing industries shows high dependency on foreign intermediate inputs. This is reflected in the high ranks they occupy in the backward linkages in Fig. 2. Extractive industries are relatively upstream in nature whereas manufacturing industries such as textiles, food and beverages, transport equipment which meet final demand and are closer to the final consumer. Overall, GVC participation ranks figure in the middle in Fig. 4 – bottom range for Indian manufacturing sector.
Fig. 4.

Sectoral variation in GVC participation
Finally, mining and agriculture both rank high in forward linkages and low in backward linkages. However, they are poles apart in the upstreamness index plotted in Fig. 3, mining being among the most upstream industries and agriculture being the most downstream.
It is worthwhile to note that the I-O tables as well as the GVC measures show little variation over time for each sector. The variation is evident across sectors. The same is true of employment patterns. Agriculture is the highest employer followed by manufacturing, construction and (internal) trade (PLFS 2018–19). Therefore, the GVC participation indices of these industries (and sub-categories) can provide useful details in the post-COVID scenario for regeneration of employment.
To analyze the employment potential, we calculated the elasticity of employment, and labor quality, with respect to value added of each of these 18 sectors, using the simple compound annual average growth (CAGR) method.3 Figure 5 presents the average elasticities over the period 1990–2016. It is interesting to note that the two elasticities reveal very different characteristics. Sectors with high employment elasticities have very low labor quality elasticities and vice versa (see Table 1). For example, Agriculture has the lowest employment elasticity (-0.5). This sector has the potential to move up the GVC through backward linkages. The high elasticity of labour quality points towards the need to move towards a technologically skilled agricultural sector. The high employment elasticity of services like Education and Health, Financial and Business services can potentially pave the way for India to achieve its goal of employment growth for the skilled workers. Construction sector has the highest employment elasticity in India. This is partly due to the large public works schemes run by the government. Transportation and Storage facilities also have higher employment elasticity. It is important to mention that this sector lays the foundation for participating in GVCs. The linkages with every sector, especially agriculture contribute to its strong forward linkages and the sector is relatively downstream. Further, against the backdrop of the pandemic, large-scale transport and storage of medical equipment and vaccines place it in a position to capitalize on its closeness to the final consumer. Mining, on the other hand, has high labour quality elasticity. However, the employment elasticity in mining is found to be marginally negative. The high FWL places mining in a unique position to generate mass employment. The employment elasticity of trade is 0.3. Wholesale trade can bridge the distance between production and final consumption4 by selling to retailers. Retailers may also connect manufacturers to final consumers both domestically and abroad.5 The remaining sectors like Post and Telecommunications; Public Administration, Defence and Social Security; Metal; Food, Beverages and Tobacco; Machinery and Electrical Equipment; Textiles; Transport Equipment; Wood and Paper have moderate to low elasticity. Hence, mere expansion of size of sector may lead to jobless growth.
Fig. 5.
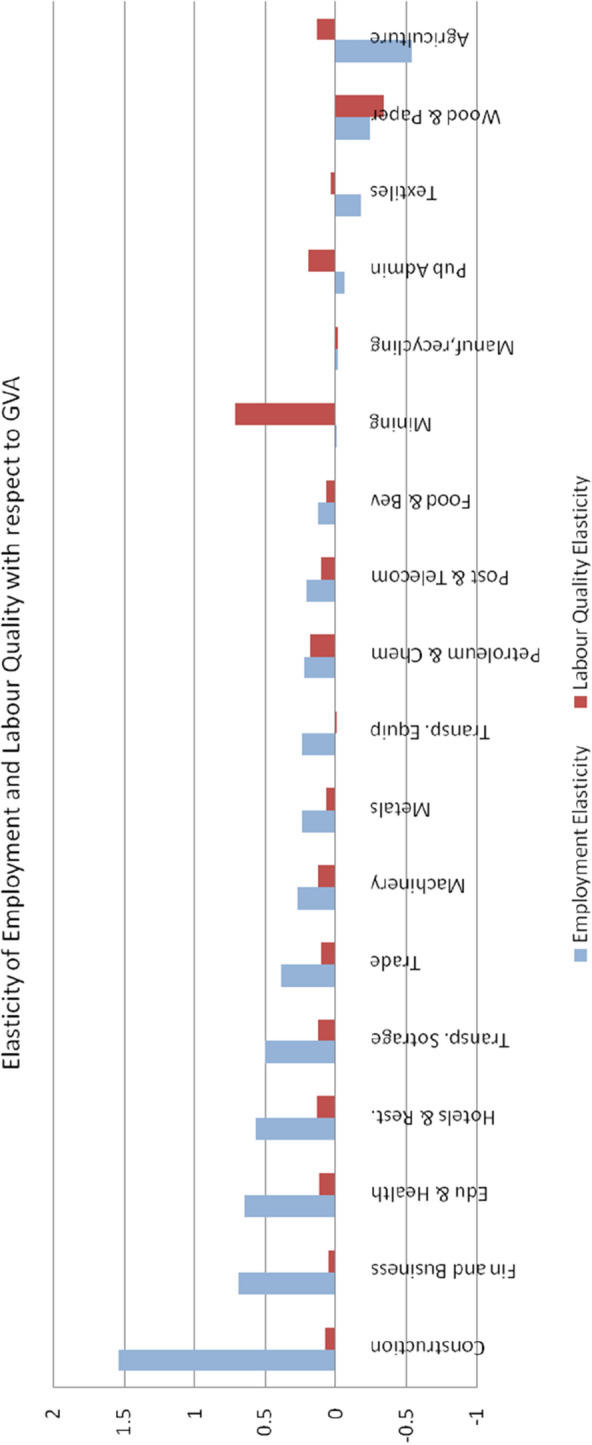
Average employment elasticity and labour quality elasticity across sectors
Table 1.
Average employment elasticity and labour quality elasticity across sectors
| Industry | Employment elasticity | Labour quality elasticity |
|---|---|---|
| Construction | 1.536 | 0.075 |
| Finance and business | 0.688 | 0.050 |
| Education and health | 0.646 | 0.121 |
| Hotels and restaurants | 0.568 | 0.134 |
| Transport and storage | 0.500 | 0.124 |
| Trade | 0.387 | 0.103 |
| Machinery | 0.266 | 0.123 |
| Metals | 0.241 | 0.064 |
| Transport equipment | 0.241 | − 0.006 |
| Petroleum and chemicals | 0.221 | 0.174 |
| Post and telecommunication | 0.208 | 0.105 |
| Food and beverages | 0.124 | 0.066 |
| Mining | − 0.004 | 0.707 |
| Manufacturing, n.e.c recycling | − 0.016 | − 0.017 |
| Public administration | − 0.062 | 0.195 |
| Textiles | − 0.183 | 0.037 |
| Wood and paper | − 0.239 | − 0.342 |
| Agriculture | − 0.546 | 0.136 |
The outlying observations have been removed (24 employment elasticity and 23 labour quality elasticity values)
Econometric analysis and estimation results
In this section, we discuss the estimation methodology and the results. Due to the inclusion of the lagged dependent variable the standard Fixed Effects and the Random Effects will lead to biased and inconsistent estimates. This is because in the dynamic framework, the unobserved effect is correlated with the lagged dependent variable. Hence, we used GMM dynamic panel Arellano-Bond (1991) method for estimation. The estimation method takes first differences of the regression Eq. (1), which eliminates the unobserved country-specific time-invariant effects. Therefore, the following generalized equation is estimated:
| 5 |
Apart from accounting for the omitted variable bias, the other advantage of the method is that it uses the lagged values of the explanatory variable as instruments to tackle the problem of endogeneity. The validity of the instruments is checked by the Sargan test of over-identifying restrictions. The null hypothesis of the Sargan test is that the instrumental variables are uncorrelated with the error term. Failure to reject the null hypothesis indicates the validity of the instruments. The AR(2) test ensures the absence of second-order serial correlation in the error term.
After discussing the estimation methodology, now we discuss the major findings of labour market implications of GVC participation on Indian workforce both in terms of employment and skill composition. Note that in all the specifications, the two tests—Sargan test and AR (2) test are satisfied implying that the instruments are valid and there is absence of second-order serial correlation in the error terms. In all the models, the past values of employment and labour quality, as applicable, are highly positively significant implying that there is a strong path dependence. That means the historical pattern of employment scenario and skill composition of a sector influence the present situation.
We discuss the results below related to the main research questions that we mentioned earlier. First, we discuss the implication of GVC participation on employment and then we bring in the skill composition to analyze how GVC participation has affected skilled and unskilled workers differentially (reported in Tables 2 and 3, respectively).
Table 2.
GMM dynamic panel estimation (dependent variable: log of employment)
| Variables | (1) | (2) | (3) | (4) | (5) |
|---|---|---|---|---|---|
| LEMPt-1 | 0.99*** | 1.04*** | 1.01*** | 0.99*** | 1.03*** |
| LVA | − 0.01* | − 0.01 | − 0.01 | − 0.01 | − 0.01 |
| LCAP | − 0.03*** | − 0.04*** | − 0.03 | − 0.03*** | − 0.04*** |
| LINTM | 0.002 | − 0.0006 | 0.003 | 0.002 | − 0.001 |
| LINTE | 0.003 | − 0.003 | − 0.0003 | 0.002 | − 0.001 |
| LINTS | 0.03*** | 0.03*** | 0.03** | 0.03*** | 0.03*** |
| FWL | 0.05*** | 0.05** | |||
| BWL | − 0.13*** | − 0.1** | |||
| GVCP | 0.04*** | ||||
| UI | − 0.01** | − 0.01*** | − 0.02*** | − 0.02*** | |
| EXPI | 0.05* | ||||
| AR(2) P val | 0.56 | 0.55 | 0.57 | 0.56 | 0.53 |
| Sargan Test P val | 0.78 | 0.77 | 0.77 | 0.77 | 0.77 |
| No. of Instr | 31 | 31 | 32 | 31 | 30 |
***p < 0.01, **p < 0.05, *p < 0.1
No. of obs. 432
Variable description LQt-1 = lagged value of labour quality, LCAP = Log of capital, LVA = Log of VA, LINTM = Log of intermediate inputs: materials, LINTE = Log of intermediate inputs: energy & LNTIS = Log of intermediate inputs: services, FWL = (DVX/GE), BWL = FVA/GE, GVCP = [(DVX + FVA)/GE], UI = Upstreamness index, EXPI = Export intensity
Table 3.
GMM dynamic panel Arellano-Bond estimation (dependent variable: labour quality)
| Variables | (1) | (2) | (3) | (4) | (5) |
|---|---|---|---|---|---|
| LQt-1 | 1*** | 1.04*** | 0.95*** | 1.02*** | 1.05*** |
| LVA | − 0.6** | − 1.1*** | − 0.109 | − 0.7*** | − 0.7*** |
| LCAP | 0.62 | 0.52 | 1.08** | 0.61** | − 0.48 |
| LINTM | − 0.17 | − 0.2 | − 0.16 | − 0.31 | 0.34* |
| LINTE | − 0.06 | − 0.0314 | − 0.197 | − 0.13 | 0.02 |
| LINTS | 0.21** | 0.27** | 0.04 | 0.47*** | 0.38*** |
| FWL | − 1.47** | − 1.85*** | |||
| BWL | − 0.91* | 1.16 | |||
| GVCP | − 1.09*** | ||||
| UI | 1.114*** | 1.196*** | 0.96*** | 1.2*** | |
| EXPI | − 5.28*** | ||||
| AR(2) P val | 0.4 | 0.42 | 0.48 | 0.4 | 0.54 |
| Sargan Test P val | 0.96 | 0.99 | 0.99 | 0.9 | 0.99 |
| No. of Instr | 31 | 31 | 32 | 31 | 30 |
***p < 0.01, **p < 0.05, *p < 0.1
No. of obs. 432
Variable description LQt-1 = lagged value of labour quality, LCAP = Log of capital, LVA = Log of VA, LINTM = Log of intermediate inputs: materials, LINTE = Log of intermediate inputs: energy & LNTIS = Log of intermediate inputs: services, FWL = (DVX/GE), BWL = FVA/GE, GVCP = [(DVX + FVA)/GE], UI = Upstreamness index, EXPI = Export intensity
Value added and employment
We find that mere scale expansion did not lead to employment creation for the Indian workforce as a whole. The change in size of a sector measured in terms of value-added did not have any impact on employment during 1990–2015 as shown in Table 2. This result is consistent with our elasticity values reported in Table 1. The growing adoption of more capital and technology intensive techniques of production can be attributed to growth without creation of mass employment opportunities. Increase in output is possible due to increase in capital or other inputs, such as energy, material that we have considered here (that is, for the normal inputs having positive marginal productivities). This jobless nature of growth of the Indian economy, is a matter of concern for the policy maker and more so in the post-COVID scenario where the economy is adversely hit. Herein comes the importance of international trade, mainly in terms of participation in GVC and reaping the benefits of competitive advantages spread across the stages of production.
GVC participation and employment
From the earlier discussion, it is evident that expansion of the domestic economy has not been successful to tackle the problem of unemployment in the post-liberalization era (1990–2015). The period also saw the rapid growth in India’s integration in global trade and an influx of FDI across sectors. The next question one would like to seek answer to is whether participation in the process of globalization helped India in creating new jobs. To address this issue, we proceed in two ways: first in terms of gross exports; and second, in terms of trade in intermediate inputs. We observe from column 5 of Table 2 that greater export-oriented sectors (in terms of ratio of gross exports of goods & services to output) have a positive impact on employment (significant at 10% level).
Next, to measure the impact of trade in intermediate inputs, we estimated separate models with 4 different elements of value chain participation measures we discussed earlier. We find that higher share of domestic value-added (DVX) in gross exports (i.e., higher forward linkage) has been able to generate employment opportunities. However, backward linkage is found to have labour displacing effects (see column 2 of Table 2). Our calculation of the GVC indicators indicates that India’s share of indirect domestic value added of intermediate exports in gross exports (forward linkage) has been very high in agriculture and service sectors such as Public Administration and Defence, Hotels and Restaurants, Education, Health and Other Services, Financial Intermediation and Business Activities, and Post and Telecommunication. Therefore, increasing the domestic value-added content in these industries can lower the domestic labour displacing effect of higher foreign value addition. In contrast, high foreign value added as a share of gross exports (backward linkage) is found for the manufacturing sectors like Textiles, Textile Products, Leather and Footwear, Transport Equipment, Metals, Basic Metals and Fabricated Metal Products, Manufacturing, nec (not elsewhere classified), recycling, Electrical and Machinery, and Wood and Paper. Consequently, expansion in the manufacturing sector has not been accompanied by commensurate employment creation.
We obtain evidence in support of favourable impact on job market from overall GVC participation, measured by the GVC participation index (see column 4 of Table 2). Positive significance of the net impact of the different sub-components of GVC index implies that though foreign value added in gross exports has labour displacing impact, that is more than compensated by the favourable impact of greater domestic value addition of intermediate exports. Hence, our findings suggest that stronger forward linkage and lower backward linkage can go a long way in addressing the problem of mass unemployment, more so when the economy is reviving from the aftermath of the COVID-19 pandemic.
Upstreamness and employment
A unique contribution of the present study is estimating the impact of the position of a sector in GVC on employment. We find that the relatively downstream sectors (the sectors those are nearer to the final consumer) have more employment generation potential. That is, lower is the position of a sector in the value chain, faster will be the employment growth of the sector.6 Our calculation of the UI index for Indian economy reveals service sectors like Public Administration and Defence, Compulsory Social Security; Construction; Education, Health and Other Services have low values. That means, the service sectors have been instrumental in creating job opportunities.
In the next sub-section, we examine the impacts of scale expansion, trade in final goods and trade in intermediate inputs for the skilled and unskilled workers during the post reform era of the Indian economy.
Value added and labour quality
When we consider skill composition by taking the labour quality as the dependent variable, expansion in size of sector in terms of greater value added absorbs more unskilled workers. This in turn implies relatively less employment opportunities for the high-skilled workers for the expanding sectors. It is interesting to note the difference in the coefficient on capital. In Table 2 with overall employment as dependent variable, capital replaces labor. However, in Table 3 with quality of labor as the dependent variable, capital works in favour of high-skilled workers. Jointly, it may be concluded that the expansion of value added has an overall negative effect on both low and high-skilled workers, but capital intensity counters this negative effect for high-skilled workers.
When both forward and backward linkages are incorporated in one specification, scale expansion may not be associated with new jobs. This labour displacing effect of scale expansion, mainly for the skilled workers (column 3 of Table 3), reaffirms the much talked about phenomenon of jobless growth for the educated Indians. It is evident that mere scale expansion may not be enough for jobs suitable for the educated unemployed. Hence, greater integration of the domestic economy with the world market can be a potential solution to solve the problem of unemployment. However, with the complex nature of global trade due to fragmentation of the production process and trade in intermediate inputs, optimal participation in global value chains needs to be strategized.
GVC participation and labour quality
From the earlier discussion it is evident that increased expansion of the domestic economy has not been successful to tackle the problem of unemployment of the educated population in the post-liberalization era. When we explicitly account for the skill composition of Indian workforce, it is revealed in Table 3 that Indian exports of gross exports have been relatively low skill intensive (see column 5 of Table 3).
Next, we consider how trade in intermediate inputs has affected skilled and unskilled workers. We find that both forward and backward linkages of exports of the domestic economy are not conducive for skilled workers. That means, greater foreign value added in gross exports as well as higher share of domestic value added in intermediate exports have created employment opportunities for mostly the unskilled workers. It is not only the manufacturing industries but also the service sectors have not been able to absorb the high-skilled workers. When taken together in column 3 of Table 3, FWL has negative impact whereas BWL has no impact on the domestic economy. The combined impact of GVC participation, when the two linkages are considered together by the GVC index, is found to have adverse impact on skilled workers.
GVC position and labour quality
Interestingly, the implications of GVC position of a sector are found to have polar opposite impact on employment (the number of total workforce) and skill composition of workforce. When the labour quality index is considered, the sectors which are further away from the final consumer, i.e., sell more inputs to the upstream industries, support faster skill acquisition.
This supports the finding of Ma et al. (2019) who showed that moving upstream in GVCs raises demand for high-skilled labour for the developed countries, whereas for the developing countries, this can be due to the increasing demand for both high-skilled and medium-skilled labour. The impacts are stronger for the capital-intensive sectors.
For India, we see that more upstream sectors boost employment of skilled labour. Our UI values indicate Basic Metals and Fabricated Metal Products, primary sectors like Mining and Quarrying; and public utilities like are more upstream. The labour market implications of GVC position shows that the service sectors like education, health, public administration have been important in mass employment generation whereas primary sectors like mining, and public utilities have been relatively skill intensive. This result has very strong policy implication as far as the importance of the manufacturing sector is considered. In the post-liberalization era, the process of industrialization has not been very successful in tackling problem of unemployment.
Though the service sector has been the largest employment generator, one ought to be mindful of the fact that greater reliance of ICT and artificial intelligence (AI) enabled techniques in the post-COVID-19 era may prove to be detrimental in India’s service sector employment. Paul Krugman in 2018 warned that with the advent of AI India could end up with huge mass unemployment if it does not grow its manufacturing sector. India’s weak manufacturing industries have not been able to generate the jobs required to sustain the projected growth in her demography.7
Concluding remarks
Today, the production of a final good is fragmented with different intermediate parts being produced at different countries depending on costs. With globalization, decline of transport costs and easier flow of investment across borders, trade in final goods was increasingly replaced by that in intermediate goods. Trade in such intermediate goods has given rise to the inexorable phenomenon of global value chains (GVC). GVCs have important effects on growth and employment creation of both skilled and unskilled labor in participating countries. The restriction of movement caused by the COVID-19 pandemic led to a breakdown of GVCs. In this context we examined the trade-growth-employment nexus concerning livelihood of Indian workforce. We unpacked the notion of global value chains by calculating the forward and backward linkages, upstreamness and overall GVC participation of 18 main economic sectors of India to assess their impact on both overall employment creation as well as that of skilled labor. Our findings indicate that expansion of size of a sector in terms of more value added failed to generate employment opportunities, especially for the educated. We observe scale expansion has either no impact on employment or adverse labour market implications by reducing employment or only absorbing more unskilled workers. Technological improvement or use of relatively capital-intensive technology seems to be the reason behind expansion of output even with fall in employment or improvement of skill composition. Higher exports of gross exports may not ensure better livelihood opportunities for the skilled Indian workforce. Stronger backward linkage, that is, higher share of foreign value added in gross export has labour displacing effect and the sectors with stronger backward linkage are more unskilled labour intensive. Fourth, stronger forward linkage measured in terms of higher domestic value added in gross export has created employment opportunities but for the unskilled workers. Finally, the position of the sector on the value chain is important and can have different implication on overall employment and skill composition of the workforce. The sectors that sell more to final consumers are found to generate more employment opportunities whereas the sectors those are located higher in the value chain and provide inputs to more upstream industries, are more skill intensive. A more detail sector level analysis is warranted on the capital–labour intensity and FDI inflow at the sector level to shed light on the complex implications of GVC position on overall employment and skill level.
Acknowledgements
This study was funded by the UNDP India.
Appendix A1
Calculating GVC Metrics: DVX, FVA, gross exports
To calculate trade in value added we follow Casella et al. [6] and Aslam (2017).
Using the IO Tables, we define E, the NH x NH diagonal matrix of gross exports. Each element on the diagonal of this matrix represents the gross exports for the corresponding country-sector.
L is the NH x NH Leontief matrix.
V is obtained by summing across the rows of the A matrix and putting these elements on the diagonal of the square matrix and subtracting it from the identity matrix.
Finally, we define our matrix of interest, call it Tv.
Let us call this matrix the Tv matrix which is (NH x NH).
“Trs is a (H x H) matrix showing inter-sector flows between country r and country s (domestic flows in the case that r and s are the same country). The matrix Tv is the key matrix of our analysis. The matrix describes how the value added contained in the exports of each country (and industry) is generated (by column) and distributed (by row) across countries. Henceforth, to simplify the intuitive understanding, we will describe the elements of Tv as if they were scalars (this is equivalent to considering an economy with only one product) rather than (H x H) matrices as in the general case. Thus, the first column of the matrix describes the value added contained in the export of country 1. This is composed of two parts:
First, the term T11 (in the matrix multiplication we have that T11 = V 1L 11E 1) denotes.
the Domestic Value Added (DVA) content of exports of country 1;
Second the generic term F r1(in matrix notation Tr1 = VrL r1E 1) denotes the Foreign Value Added (FVA) content of exports of country s generated by country r (with r ≠ 1). Recall that the production of output by country s (part of which is exported) requires inputs from other countries. In producing these inputs, the other countries also generate value added. Hence, this term represents the share of value added that has been generated in country r (Vr) and that has been imported by country 1 (Lr1) to produce its exports (E 1).
Finally, by reading the matrix along the row rather than along the column (and excluding the diagonal terms Frr), we have an indication of how much of each country’s domestic value added enters as an intermediate input in the value added exported by other countries. The latter terms are what Koopman et al. (2014) call indirect value-added exports” (DVX).
See Table 4.
Table 4.
Structure of the Tv Matrix

Funding
This study was funded by the UNDP India.
Declarations
Conflict of interest
The authors have no relevant financial or non-financial interests to disclose.
Ethical approval
The manuscript is not submitted elsewhere for simultaneous consideration. The work is original and is not published elsewhere.
Footnotes
Global Value Chains Part 3. 2018. Asian Development Bank.
EORA 26 database: https://worldmrio.com/eora26/.
Elasticity value is classified as an outlier if value > quartile3 + 10*(interquartile range) or if value < quartile1—10*(interquartile range) This removes 24 values from employment elasticity series and 23 values from labour quality elasticity series (out of a total of 486 observations or each series).
EXIM Bank Working Paper, 2019: Global Value Chain Integration: Enhancing India’s Exports.
OECD Trade Policy Papers, 2017: Services and Performance of the Indian Economy: Analysis and Policy Options.
Note that the way the UI index is defined it implies that a sector that sells more directly to final consumers would appear to be downstream in value chains, while a sector that sells little to final consumers is more likely to be upstream in value chains.
Economic Times (2017), Krugman warns India story could end with mass unemployment.
Publisher's Note
Springer Nature remains neutral with regard to jurisdictional claims in published maps and institutional affiliations.
References
- 1.Antras, P. (2020). Conceptual Aspects of Global Value Chains. Background paper for the 2020 World Development Report. Trading for Development in the Age of Global Value Chains.
- 2.Antras P, Chor D, Fally T, Hillberry R. Measuring the upstreamness of production and trade flows. American Economic Review. 2012;102(3):412–416. doi: 10.1257/aer.102.3.412. [DOI] [Google Scholar]
- 3.Arellano M, Bond S. Some tests of specification for panel data: monte carlo evidence and an application to employment equations. The Review of Economic Studies. 1991;58:277–297. doi: 10.2307/2297968. [DOI] [Google Scholar]
- 4.Aslam, A., Novta, N. & Rodrigues-Bastos, F. (2017). Calculating trade in value added. International Monetary Fund.
- 5.Banga K. Impact of Global Value chains on Employment in India. Journal of Economic Integration. 2016;31(3):631–673. doi: 10.11130/jei.2016.31.3.631. [DOI] [Google Scholar]
- 6.Casella B, Bolwijn R, Moran D, Kanemoto K. Improving the analysis of global value chains: The UNCTAD-Eora Database. Transnational Corporations. 2019;26(3):115–142. doi: 10.18356/3aad0f6a-en. [DOI] [Google Scholar]
- 7.Fally, T (2012). Production Staging: Measurement and Facts. mimeo University of Colorado Boulder.
- 8.Gagliardi N, Mahy B, Rycx F. Upstreamness, wages and gender: equal benefits for all? British Journal of Industrial Relations. 2021;59(1):52–83. doi: 10.1111/bjir.12486. [DOI] [Google Scholar]
- 9.Guha-Khasnobis, B., Aditya, A. (2020). Export Diversification, Upstreamness and Global Value Chains: Experience of Commonwealth Member Countries. International Trade Working Paper 2020/07. Commonwealth Secretariat, London.
- 10.Hagemejer, J., Tyrowicz, J. (2017). Upstreamness of employment and global financial crisis in Poland: the role of position in global value chains. In Economics of European Crises and Emerging Markets: 217–236. Palgrave, Singapore.
- 11.Ma S, Liang Y, Zhang H. The Employment Effects of Global Value Chains. Emerging Markets Finance and Trade. 2019;55:2230–2253. doi: 10.1080/1540496X.2018.1520698. [DOI] [Google Scholar]
- 12.Ray, S., Miglani, S. (2020). India’s GVC integration: An analysis of upgrading efforts and facilitation of lead firms. ICRIER WP: 386.
- 13.Veeramani, C., Dhir, G. (2019). Reaping Gains from Global Production Sharing: Domestic Value addition and Job Creation by Indian Exports. IGIDR Working Paper-2019–04.
- 14.Szymczak, S., Wolszczak-Derlacz, J., Parteka, A. (2019). Position in global value chains: the impact on wages in Central and Eastern European Countries (No. 1/2019 (53)). GUT FME Working Paper Series.