

Abstract
In the present study, the operation performance of an ultralow-temperature cascade refrigeration freezer is experimentally researched. The natural refrigerants R290-R170 are adopted as high-temperature and low-temperature fluids. The experimental test is conducted in a type laboratory with a dry bulb temperature of 32.0 °C and a wet bulb temperature of 26.5 °C. Different state monitors are set to display the system operation performance, and several temperature monitors are arranged to study the pull-down performance and temperature variations in the freezer. Based on the established experimental rig, three freezing temperatures, including − 40 °C, − 80 °C, and − 86 °C, are measured and compared. The results show that it takes about 240 min for the freezer to be pulled down to − 80 °C. During the pull-down period, different monitors all experience rapid temperature drop, and the power consumption reduces from 1461.4 W to 997.5 W. Once the target temperature is achieved, the freezer comes into periodic start–stop operation. With the set temperature ranging from – 40 °C to – 86 °C, the inlet temperature of two compressors gradually decreases, while the discharge temperature has an increase trend. The cooling effect of the pre-cooled condenser reduces with the freezing temperature, while the long connection pipe has opposite variation profile. Moreover, it is observed that for different freezing temperatures, most of the space in the freezer can be cooled down to the target temperature. It is confirmed that the present ultralow-temperature freezer can be used for the storage and transportation of COVID-19 vaccines. However, it is also found that the cascade refrigeration system is not suitable for high freezing temperature, due to high power consumption and extensive start–stop switch of refrigeration system.
Keywords: Cascade refrigeration system, Natural refrigerants R290-R170, Ultralow-temperature, Experimental measure
Introduction
More recently, there is an obvious demand on ultralow-temperature freezer, especially in vaccine storage, biomedical, scientific test, electronic communication and chemical field. According to ASHRAE (2014), the freezing temperature from − 50 °C to − 80 °C belongs to the ultralow-temperature refrigeration range. In some extreme conditions, the freezing temperature could reduce to − 100 °C (Mota-Babiloni et al. 2020). To cooperate with the production and storage of COVID-19 vaccines, the cascade refrigeration unit plays key roles in generating low-temperature environment and in cold chain transportation, as some researchers (Pan et al. 2020, Mateu-Royo et al. 2021) suggested the two-stage cascade refrigeration system (CRS) has great operation efficient on commercial low-temperature supermarkets and industrial sectors and can realize freezing temperature < − 60 °C.
As for CRS, researchers adopted carbon dioxide R744 as low-temperature refrigerant and investigated the energy and exergy performance of a refrigeration unit. Lee et al. (2006) made a thermodynamic evaluation on a R744-R717 (ammonia) CRS with energy and exergy analyses. It was shown the optimal coefficient of performance (COP) increases with evaporation temperature of low-temperature cycle and decreases with condensation temperature of high-temperature cycle. Getu and Bansal (2008) also conducted a theoretical analysis on a R744-R717 CRS. Llopis et al. (2015) compared performances of four two-stage refrigeration systems and a CRS with R744 as low-temperature refrigerant. They found that the CRS with R744 working in low-temperature cycle can be used for commercial refrigeration in warm regions. Eini et al. (2016) made a multi-objective optimization on the CRS performance from economic, exergetic, and environmental aspects. They found that the R744-R717 CRS almost has same economic and exergy efficiency as the R744-R290 CRS, but the R744-R717 CRS is inherent safety. Amaris et al. (2019) performed energy and exergy analysis on a typical R744 booster refrigeration unit, a R744 parallel-compressor booster refrigeration unit, and a R717-R744 CRS. It showed that the R717-R744 CRS has better operation performance among three refrigeration configurations. After comparing performances of a R744-R717 CRS, a R744-R134a CRS, and a R744-R1234yf CRS based on energy and exergy analysis, Turgut and Turgut (2019) found that the R744-R1234yf CRS has a high efficiency and low annual cost. Adebayo et al. (2021) conducted a theoretical comparative analysis on the performance of a CRS with R744 as low-temperature fluid. It was concluded that the R717-R744 CRS has the highest COP and HFE7000 is a promising refrigerant and could be a substitute to R134a. Alkhulaifi and Mokheimer (2022) adopted water as high-temperature fluid and R744, N2O, R41, R717, R290, and R1270 as low-temperature fluids and performed detail thermodynamic assessments on a CRS. It was found that refrigerant pair R717-R718 has a better performance with a COP lift of 2.9–8.6%.
Apart from thermodynamic analysis, some experimental researches were also conducted on CRS with R744 as low-temperature refrigerant. Bingming et al. (2009) experimentally measured the operation performance of a R744-R717 CRS. Compared with a R717-R717 CRS and a single-stage R717 system, it was found that the R744-R717 CRS obtained the highest COP with evaporating temperature < − 40 °C. Dopazo and Fernández-Seara (2011) experimentally measured the operation of a R744-R717 CRS by changing evaporation and condensation temperatures of CO2 to obtain the optimum COP. Cabello et al. (2017) experimentally compared system performance of a R744-R134a CRS and a R744-R152a CRS. They found that the operation performances of two CRSs are almost the same. It implied that R134a can be replaced with R152a in the high-temperature cycle of a CRS.
Alongside refrigerant R744, some investigators also adopted R23, R41, and R170 as low-temperature refrigerants and conducted performance research on CRS. Kilicarslan and Hosoz (2010) conducted energy and irreversibility analysis on a CRS with R23 as low-temperature refrigerant. Sun et al. (2016) carried out detail analysis on performance comparison between a R41-R404A CRS and a R23-R404A CRS based on the first and second law of thermodynamics. They indicated that refrigerant couple R41-R404A may be a better replacement for R23-R404A. Aktemur et al. (2021) adopted refrigerant R41 in low-temperature cycle and refrigerants R1243zf, R423A, R601, R601A, R1233zd(E), and RE170 in high-temperature cycle and conducted detailed performance comparison on a CRS. It was found that R41-RE170 refrigerant pair has the best operation COP and exergy efficiency. Sarkar et al. (2013) built a theoretical model to compare CRS performance with refrigerant pairs R717-R170, R717-R1150, and R717-R744A. The results showed that the R717-R170 CRS has an optimal operation performance, and the R717-R744A CRS has the highest volumetric cooling capacity. Sun et al. (2019) made the energy and exergy evaluations on low GWP refrigerants in a CRS with R23, R41, and ethane R170 as low-temperature fluids. They concluded that R161 is best used in high-temperature cycle, and R41 and R170 are suggested to being low-temperature refrigerants. Roy and Mandal (2019) compared the operation performance of a R41-R404A CRS and a R170-R161 CRS, and the R170-R161 CRS was turned out to have higher optimal COP exergetic efficiency. Meanwhile, Roy and Mandal (2020) performed a comprehensive thermodynamic analysis on a CRS from energetic, exegetic, economic, and environment aspects. By adopting R41 and R170 as low-temperature fluids and R404A and R161 as high-temperature fluids, it turned out that the best exergetic efficiency of CRS is achieved by refrigerant pair R41-R161. Aktemur and Ozturk (2021) performed a performance evaluation of a CRS with refrigerants R41-R601, R41-R601, and R41-cyclopentane. They found that the R41-R601 CRS has the best thermodynamic performance. Mouneer et al. (2021) adopted R170 as low-temperature fluid and conducted thermodynamic analysis on a CRS with R32, R123, R134A, R404A, R407C, R410, and R290 as high-temperature refrigerants. They suggested that natural refrigerants R290-R170 is recommended for CRS to generate ultralow-temperature. Rodriguez-Criado et al. (2022) retrofitted a package R290 refrigeration unit and charged with R170 to generate ultralow-temperature cooling. With an evaporating temperature from − 65 °C to − 80 °C, the COP of the retrofitted refrigeration unit ranges from 0.6 to 1.6. Udroiu et al. (2022) utilized refrigerants R290-R170 and developed detailed thermodynamic model to compare performances of 42 different refrigeration system configurations.
As mentioned above, it is easy to see most of investigations related to CRS are focused on thermodynamic analysis, and the experimental research is relatively few. In 2020, Wang et al. (2020) experimentally investigated the operation performance of a CRS freezer by using refrigerant pair R404A-R508A. The pull-down performance of the freezer was measured with a freezing temperature of − 80 °C. There is still a lack of experimental investigations on ultralow-temperature CRS. Hence, it is crucial to perform more experimental measurements on ultralow-temperature freezer and accumulate more low-temperature experimental data.
Under the constraint of the Montreal Protocol, the hydrofluorocarbon HFC refrigerants will be replaced in refrigeration industry gradually, and the hydrocarbon HC refrigerants seem to be valid alternative in refrigeration and air-conditioning fields. To reduce refrigerants’ equivalent carbon emission, the natural refrigerants R290-R170 are adopted to build a CRS and applied in an ultralow-temperature freezer in the present study. The pull-down process of the freezer is measured with a freezing temperature Tfreezing of − 80 °C. Meanwhile, the periodic operation performance of the freezer is investigated under three freezing temperatures. Some different state monitors are arranged in high-temperature cycle (HTC) and low-temperature cycle (LTC) to reflect variations of different operation parameters. The air temperature distribution in the freezer is monitored to study the temperature drop and fluctuation variations. The power consumption of the CRS is measured as well. With some important conclusions obtained, the present study is significant to comprehensively understand the operation mechanism of the ultralow-temperature CRS freezer.
Experimental rig and settings
Experimental schematic diagram
Figure 1 shows the schematic diagram of CRS (Liu et al. 2023). It is easy to see the CRS consists of a HTC by using refrigerant R290 and a LTC by using refrigerant R170. The main components of the HTC include a high-temperature compressor, a condenser, and a high-temperature capillary, and the LTC is mainly composed of a low-temperature compressor, an evaporator, and a low-temperature capillary. The cascade heat exchanger (CHE) is set to connect HTC and LTC. Specially, a pre-cooled condenser is set after the LTC compressor. This setting can reduce the inlet temperature of the CHE and is beneficial to realize much lower evaporating temperature. Moreover, in the present experiment, a coil is wrapped around the sealing band of the freezer door and the high-temperature discharging gas from the HTC compressor flows into the coil to prevent water vapor condensation occurring. That is to say, an anti-condensation coil is set in the HTC. Except above components, some accessory devices, including drying filters, liquid reservoirs, oil separators, process seals, and pressure switches, are arranged in the CRS. In addition, as the LTC capillary is embedded into foam layer, a drying filter is set before the CHE.
Fig. 1.

Diagram of cascade refrigerant experiment system (Liu et al. 2023)
Different temperature monitors are attached to the inlet and outlet connection pipe of different components for measuring fluid temperature variations. As marked in Fig. 1, five monitors are set in the LTC including the inlet temperature T1 and outlet temperature T2 of LTC compressor, inlet temperature T2′ and outlet temperature T3 of LTC condenser, and inlet temperature T3′ of capillary tube. Meanwhile, seven monitors are set in the HTC. T5 means the outlet temperature of LTC evaporator, T5′ and T6 mean the inlet and outlet temperature of HTC compressor, T6′ and T6″ refer to the inlet and outlet temperatures of anti-condensation coil, and T6″ also reflects the inlet temperature of HTC condenser. T7 and T7′ mean the outlet temperature of HTC condenser and the inlet temperature of drying filter. As it is difficult to set temperature monitor in LTC evaporator and CHE, monitors T4 and T8 are not set.
Experimental setup
Figure 2 shows the experimental apparatus of the ultralow-temperature freezer (Liu et al. 2023). The experiment measurements are carried out in a type laboratory. The experimental rig is mainly composed of the freezer, refrigeration system, data acquisition device, power supply, and other connections and structures. The inner and outer boxes of the freezer are made by iron sheet. The size of the freezer is 976 × 828 × 1979 mm (length × width × height). The inner storage volume of the freezer is 549 L. The freezer consists of four cabinets, as shown in Fig. 2a. Each cabinet has an inner door, and the freezer has an outer door. This setting is mainly to reduce the ambient heat leakage. The main components, such as two compressors, a condenser, a fan, a CHE, and a pre-cooled condenser, are arranged at the bottom of the CRS. It can increase the operation stability and save cooling space of the freezer. As for LTC evaporator, it is manually made by copper tube with a diameter of 9.52 mm and a length of 36 m, and the cooling coil is wound on the top, back, left, and right side of the inner box, shown as Fig. 2b. The CHE, which is also known as evaporative condenser, is adopted with a casing heat exchanger. The insulating tape is tied to the evaporator coil, and a fixed trestle is used to restrict movement of the cooling coil. To reduce cold loss, the interval between the inner and outer boxes is sprayed and filled with foam. As the capillary is connected with the evaporator coil, both two components are embedded in the foam layer. The detailed sizes of main components in CRS are listed in Table 1.
Fig. 2.
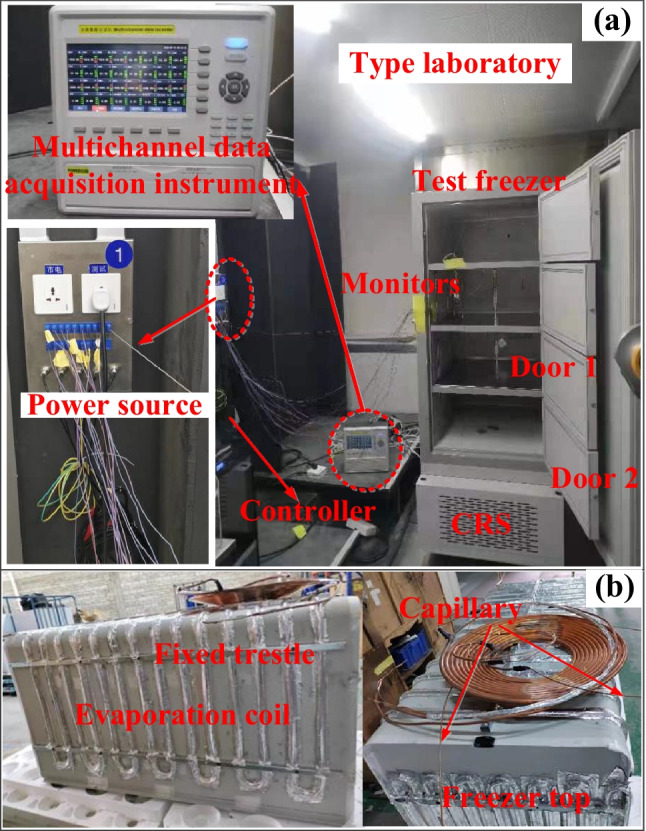
Experimental rig of a low-temperature freezer and b evaporation coil
Table 1.
Dimension parameters of main components
| Component | Size and material |
|---|---|
| Two compressor | Displacement: 20.95 cm3, cooling capacity: 962 W@-23.3 °C, operation pressure: 0.01 ~ 0.25 MPa |
| Condenser | Finned heat exchanger made by copper pipe and Aluminum fin, diameter of copper pipe: φ7*0.35 mm, thickness of fin: 0.2 mm, dimension: 350 × 130 × 225 mm (L × W × H) |
| Evaporator | Coil heat exchanger made by copper pipe and aluminum fin, diameter of copper pipe: φ9.52*0.8 mm, length of coil: 36 m |
| Cascade heat exchanger | Casing heat exchange made by copper pipe, diameter of the sleeve: 512 mm, diameter of inner coil pipe: φ6.35*0.65 mm, length of the inner coil: 15.6 m |
| Capillary pipe | Made by copper tube, diameter: φ2.7*0.65 mm, length of HTC and LTC capillaries: 3.4 m and 5.6 m |
| Pre-cooled condenser | Finned heat exchanger made by copper pipe and aluminum fin, diameter of copper pipe: φ7*0.35 mm, thickness of fin: 0.2 mm, dimension: 350 × 130 × 75 mm (L × W × H) |
The SC21CNX.2 LBP compressor is adopted for HTC and LTC. The charging quantities of R290 and R170 are 155 g and 103 g. A finned tube heat exchanger is utilized for condensing high-temperature refrigerant gas. Driven by a fan, cold air flows through the finned tube heat exchanger and brings heat rejection. Cooled by external air stream, high-temperature refrigerant gas is condensed and becomes pure liquid. To enhance cooling performance and reduce evaporating temperature of the LTC, a small finned tube condenser is used as pre-cooled heat exchanger. High-temperature R170 gas is cooled to low-temperature R170 in pre-cooled condenser. High-temperature R170 gas conducts heat exchange with low-temperature R290 liquid in CHE.
The voltage of power supply is 220 V, and the frequency is 50 Hz. In this experiment, a power meter is set to measure the power consumption of the CRS, including power demands of two compressors and a condensation fan. The measure accuracy of the power meter is 0.3%FS. Moreover, both pressure and temperature test points are set to monitor the operation status of the CRS.
A multichannel data acquisition instrument (Liu et al. 2019; Liu and Tan 2019) is utilized to record temperature variations of different monitors, shown as Fig. 2. The experimental rig is fully instrumented with T-type thermocouples to test temperature variations of refrigerants at the inlet and outlet of different components and air in the freezer. The test uncertainty of T-type thermocouple is ± 0.5 °C with a temperature range of − 150–350 °C. In this experiment, as the CRS is packaged with the freezer, it is difficult to accurately and directly test actual fluid temperature in different components. Hence, the thermocouple is pasted to the connection pipe and the equipment wall to reflect the fluid temperature variations. As Fig. 1 shows, 5 thermocouples are installed in the LTC, and 7 temperature monitors are attached to connection pipe of the HTC. To reduce test errors, the inlet and outlet pipes are grooved and the T-type thermocouples are buried into and covered with dielectric adhesive tape. Moreover, three temperature test points are attached to chamber walls of the high-temperature compressor, low-temperature compressor and oil separator, and labelled as THTC, TLTC, and TOS, respectively.
To research the pull-down performance of the freezer, 11 temperature test points are set. Figure 3 shows detailed monitor distributions. As introduced above, the selected freezer is composed of four compartments. Here, four cabinets are labeled as No.1–No.4 from top to bottom. Two thermocouples are arranged in the core and back of each compartment. A copper bar is set in the center of each compartment, so the thermocouple can be tied to the copper bar to test the air temperature in the core of each compartment. Four core monitors are marked Tcore1–Tcore4, and four back monitors are numbered Tback1–Tback4. Moreover, three thermocouples are set in the left, right, and top side of compartment No.1, and labeled as Tleft, Tright, and Ttop, respectively.
Fig. 3.
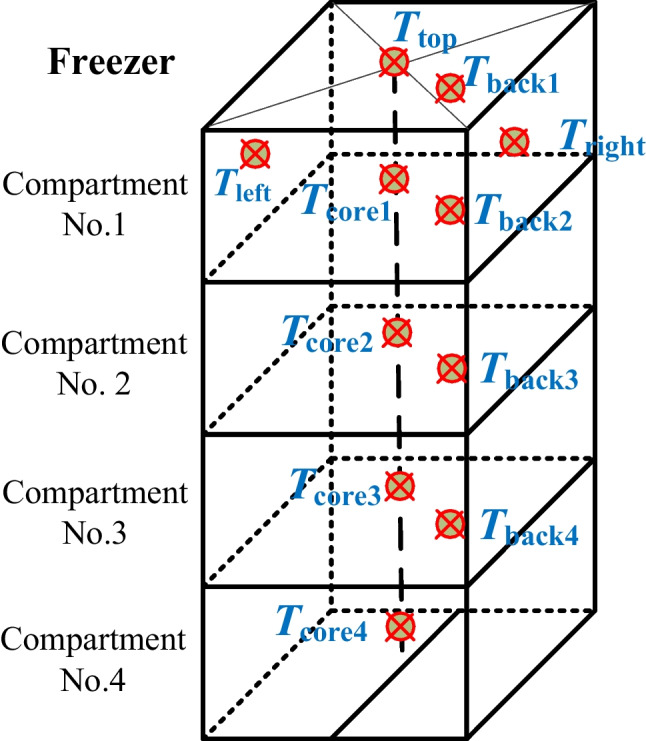
Temperature test point distribution in freezer
Results and discussion
The pull-down and cycle operation process of the freezer are experimentally investigated. The experimental measurement is carried out in a type laboratory with a dry bulb temperature of 32.0 °C and a wet bulb temperature of 26.5 °C. Under initial parameter settings, three freezing temperatures, namely, − 80 °C, − 86 °C, and – 40 °C, are experimentally tested, and related temperature variations of different test points are introduced.
− 80 °C freezing temperature
Temperature variation of different state monitors
Figure 4 presents temperature variations of different monitors in LTC. It can be seen that the refrigeration device starts from 14 min. Different monitors undergo an initial temperature rise and then reduce gradually. About 254 min later, − 80 °C target temperature is achieved and freezer stops. Thereafter, different temperature monitors enter into periodic fluctuation variations. This is to say the pull-down process approximately lasts for 4 h. For monitor T1, it experiences an initial slight temperature rise and then drops to − 3.7 °C rapidly. During temperature drop period, some unusual phenomenon occur, such as the temperature fluctuation and sudden temperature reduction, as described in Fig. 4b. Under the compression effect of LTC compressor, the discharge temperature T2 achieves a high value. After an initial temperature increase, T2 starts to reduce. As high-temperature discharge gas goes through long connection pipe from LTC compressor to pre-cooled condenser, obvious temperature drop occurs under external environment cooling. Thereafter, high-temperature discharge gas gets further cooled in pre-cooled condenser. Other monitors also experience an initial rapid temperature increase. The maximum temperatures of T2, T2′, T3, and T3′ are achieved in 52–60 s with values of 127.1 °C, 101.2 °C, 45.0 °C, and 43.8 °C, respectively. Afterwards, four monitors experience the temperature drop and finally reach 100.2 °C, 70.3 °C, 37.9 °C, and 35.9 °C. The temperature reductions are 26.9 °C, 30.9 °C, 7.1 °C, and 7.9 °C. The temperature drop of refrigerant gas in pre-cooled condenser reduces from 56.2 °C to 32.4 °C during pull-down process, while the temperature variation range of refrigerant passing through CHE is 1.2–2.0 °C.
Fig. 4.

Temperature distribution of monitors T1, T2, and T2’
While − 80 °C is achieved, the refrigeration system is shut down. Subjected to external heat invasion, air temperature within the freezer rises correspondingly. When it increases to certain temperature limit, the refrigeration system will restart. Thereafter, the refrigeration unit comes into periodic start–stop variations, and different test points experience extensive temperature fluctuations. Generally, during stable operation of the freezer, different monitors basically maintain in relatively stable temperature ranges. The average temperature values of T1, T2, and T2′ are − 3.6 °C, 94.2 °C, and 67.4 °C, as shown in Fig. 4a, and the average temperature values of T3 and T3′ are 37.1 °C and 36.0 °C, as shown in Fig. 5a. It is easy to obtain that during periodic operation of the freezer, the temperature declined from the outlet of compressor to the inlet of pre-cooled condenser is 26.8 °C, and the temperature drop of refrigerant gas in pre-cooled condenser is about 30.3 °C. The cooling effect generated by the long connection pipe is close to that generated by the pre-cooled condenser. However, there is only 1.1 °C temperature reduction generation while refrigerant fluid passes through CHE. That is because the latent heat exchange is the main heat exchange mode in CHE. Moreover, with time continuing, the average temperatures of different monitors have slight reductions, and it is obviously reflected by the temperature profile of monitor T1. This phenomenon may be attributed to the increase of refrigeration efficiency after long-term operation.
Fig. 5.

Temperature distribution of monitors T3 and T3′
Figure 6 displays temperature distributions of different monitors in HTC. Similar to temperature variations in LTC, different temperature monitors in HTC also undergo an initial temperature rise once the freezer is activated. While the maximum temperatures are achieved, different monitors start to experience temperature decline with different reduction rates. If the air temperature within the freezer reduces to the required freezing temperature, the CRS is shut down and then comes into periodic start-stop fluctuations, as shown in Fig. 6a. Different from T5, monitor T5′ is close to high-temperature compressor and its temperature experiences slight reduction during pull-down phase, while monitor T5 undergoes obvious temperature rise and rapid temperature drop. Once high-temperature vapor flows out of HTC compressor, it goes through a long way and comes into the anti-condensation coil. The maximum temperature difference between T6 and T6′ is about 33.2 °C. While high-temperature vapor flows into the anti-condensation coil, it undergoes continuous temperature reduction cooled by external air. Moreover, the inlet and outlet vapor temperature monitors also have similar variation profile. As Fig. 6 shows, temperature variation profiles of T6′ and T6″ are almost parallel except the initial stage. The temperature reduction is about 25.4 °C after high-temperature vapor goes through the anti-condensation coil. As HTC condenser is close to drying filter, monitors T7 and T7’almost have same temperature variation profile, with a difference of 0.4 °C. After 4 h pull-down, − 80 °C is achieved and final values of different monitors are − 10.3 °C, 14.1 °C, 107.9 °C, 74.7 °C, 49.3 °C, 39.1 °C, and 38.7 °C, respectively. 254 min later, the CRS enters periodic start–stop switching phase, and different monitors experience periodic temperature fluctuations. After 48 operation cycles, temperatures of different monitors tend to be certain values. For instance, T5 is about − 9.2 °C during periodic operation of the CRS. T5′ and T6 tend to be 19.8 °C and 107.5 °C. As for T6′ and T6″, two parameters maintain to 75.2 °C ad 47.3 °C. The associated temperature reduction through the anti-condensation coil is about 27.9 °C. This means that there is still an obvious thermal load at the sealing section of the freezer door and great insulation and sealing measure should be adopted to reduce external heat leakage. While for monitors T7 and T7′, both have almost same fluctuation profile during periodic operation process, and the average temperatures of two monitors are 42.2 °C and 42.1 °C.
Fig. 6.

Temperature distribution of different test points of HTC
After detailed comparison and analysis, it is easy to see the start-stop ratio of the CRS reduces with time. Once the target temperature is first achieved, the CRS stops for 2.5 min and then restarts and works for 19 min, the start–stop ratio is 7.6. With time continuing, the CRS works for short term and stops for long time. For the last operation cycle, the working time and resting time of the CRS are 8.5 min and 3.5 min, and the corresponding start–stop ratio is about 2.43. The main reason is given as follows. As time continuous, the operation efficiency of the CRS gets obviously improved and external heat invasion can be removed in short term. Correspondingly, the rest time of the freezer increases and the work time of the freezer decreases. Therefore, the start–stop ratio of the CRS reduces with time. That is to say, long-term operation of the CRS has positive effects on reducing power consumption and improving system operation efficiency.
As introduced above, three thermocouples are attached to chamber walls of two compressors and an oil separator. The related temperature variation profiles are depicted in Fig. 7. It can be seen that once the CRS is activated, the wall temperatures of three components experience sudden temperature rise firstly, then TLTC undergoes slight temperature decrease, and THTC and TOS drop rapidly along with obvious fluctuations during pull-down phase. When it comes into periodic operation stage, both TLTC and THTC fluctuate with time and have gradual reduction trend, while TOS almost keeps relative stable variation. During whole process, TLTC is < 70 °C, and the maximum value of THTC is obtained in the initial stage with a value of 66.9 °C. While the CRS stops, high-temperature vapor is still filled in compressor chamber. Heated by high-temperature vapor, both THTC and TLTC increase with time, as shown in Fig. 7. Moreover, TOS is always less than TLTC. The cooling effect of the lubricant oil on low-temperature compressor gets greatly reflected.
Fig. 7.

Temperature variations of two compressors and an oil separator
Temperature variation of different monitors in freezer
Figure 8 displays temperature variations of 4 core monitors and 3 side monitors in compartment No.1. As Fig. 8a shows, 4 core test points experience rapid temperature reduction during pull-down period. This is mainly because refrigerant flows from top to bottom, the air in compartment No.1 gets cooled firstly, and the air in compartment No.4 is cooled lastly. Therefore, monitor Tcore1 has the largest temperature reduction rate and monitor Tcore4 has the lowest temperature reduction rate during the first 60 min. However, as time continuous, cold air sinks and hot air moves up, which causes the temperature reduction rate of bottom monitor becomes larger than top monitor. Influenced by combination of direct cooling of evaporation coil and air circulation flow caused by natural convection within the freezer, the air in bottom section obtains lower temperature than that in top section. Once the CRS stops, temperatures of four core monitors are − 77.3 °C, − 78.7 °C, − 80.9 °C, and − 82.1 °C, respectively. When the CRS comes into start–stop switch phase, temperature fluctuation amplitudes of four monitors are so small that their temperature profiles almost linearly reduce with time. After 48-cycle operation, the final values of Tcore1–Tcore4 are − 80.2 °C, − 81.6 °C, − 82.8 °C, and − 83.1 °C, respectively. During > 10 h operation, the temperature reductions of four monitors are 2.9 °C, 2.9 °C, 1.9 °C, and 1.0 °C, respectively. 660 min later, temperatures of four core monitors all reduce to − 80.0 °C, which means that the entire space of the freezer is cooled to < − 80.0 °C. Figure 8b presents temperature variation profiles of the top, left and right monitors in compartment No.1. Meanwhile, temperature profile of Tcore1 is also added for detailed comparison. It is evident to see three side monitors experience rapid temperature drop firstly and then gradually reduce during pull-down stage. Their temperature reduction rates are higher than that of Tcore1. When it comes into periodic start–stop operation, temperatures of three side monitors experience fluctuating variations. Largely different from core monitors, temperature of side monitors experience extensive fluctuations. The main difference between the core monitor and side monitors is attributed to their locations. As monitors Ttop, Tleft, and Tright are set on the top, left and right side of compartment No.1, these three monitors are directly influenced by evaporation cooling coil, so three monitors have rapid temperature reduction during pull-down phase. While the CRS operate periodically, refrigerant R170 experiences alternating cooling and heating, so temperatures of Ttop, Tleft, and Tright undergo continuous fluctuations. However, as the core monitor is arranged in the core of compartment, the air in the core is not directly cooled by evaporation coil and only cooled by thermal conduction and convection. Due to low thermal conductivity of air and some conduction delay, the periodic operation of the CRS has not caused obvious effects on the temperature variations of core monitors. During periodic operation, three side monitors all vary from − 83.8 °C to − 87.2 °C.
Fig. 8.

Temperature variations of a core monitors and b monitors in compartment No.1
Figure 9 displays temperature variations of four back monitors. It is easy to see four monitors experience initially rapid temperature drop; then, their temperatures reduce gradually and come into fluctuation variations finally, as shown in Fig. 9a. As the evaporation coil is wound around the side of the freezer from top to bottom, so monitor Tback1 has the largest temperature reduction rate, and the temperature reduction rate of Tback4 is the lowest among four monitors, as shown in Fig. 9b. In general, as back monitors are directly attached to the back side of the freezer, their temperatures are largely influenced by evaporation cooling of refrigerant. When compared to core monitors, four back monitors have rapid temperature reduction rates. For instance, it only takes 134 min for monitor Tback1 reaching − 80 °C during pull-down period, and the time consumptions for monitors Tback2–Tback4 reducing to − 80 °C, are 141 min, 147 min, and 211 min, respectively. While for core monitors, it costs > 240 min their temperatures drop to − 80 °C. During periodic operation of the CRS, four back monitors have fluctuating temperature variation profiles. Moreover, among four back monitors, the bottom monitor Tback4 has a slower temperature reduction and a higher temperature variation profile. This is mainly because low-temperature refrigerant flows from top to bottom, when it arrives at compartment No.4, most of refrigerant liquid evaporates. There is less phase change heat capacity used for cooling. That is to say, the cooling effect becomes weaken when two-phase refrigerant flows through compartment No.4. Hence, monitor Tback4 has a low temperature reduction rate during pull-down phase and high-temperature values during periodic operation phase. The lowest temperature of four back monitors can reach − 86.8 °C.
Fig. 9.

Temperature variation of different back monitors
Based on above introduction, it is easy to find that 660 min later, all space of the freezer can reach < − 80 °C, including core sections of compartments No.1 and No.2. Moreover, the lowest temperature could reduce to − 87.2 °C. To sum up, the − 80 °C target temperature has been experimentally confirmed.
Power consumption
Figure 10 shows power consumption P of the freezer. During pull-down process, the freezer operates under high load, and P increases to 1461.4 W in 21.5 min, as shown in Fig. 10b.With the decrease of evaporating temperature and heat load, P almost linearly reduces. Certainly, some slight power fluctuations occur as well. Before the shutdown of the CRS, P reduces to 997.5 W. Thereafter, the CRS enters periodic switch period, and P experiences intermittent variations. During periodic start-stop phase, P reduces gradually and varies from 1082 to 997 W. The average power consumption is about 1040 W.
Fig. 10.

Power consumption of CRS
− 86 °C freezing temperature
About 120 min later, the CRS is reactivated with Tfreezing changing from − 80 °C to − 86 °C. Under the same dry bulb and wet bulb temperatures, different parameter variations are measured and introduced. Figure 11 displays temperature variations of different monitors of LTC. The CRS restarts since 1020 min, and the system does not experience pull-down phase. Here, two operation cycles are carried out and tested. Cycle 1 lasts for 955 min and cycle 2 operates for 292 min.
Fig. 11.

Temperature distribution of different test points of LTC
As Fig. 11 shows, the CRS enters stable operation after 10 min adjustment. Except suction temperature T1, other temperature monitors almost keep to stable operation states. For instance, the discharge temperature T2 of LTC compressor tends to be 94.8 °C, and the inlet temperature T2′ and outlet temperature T3 of pre-cooled condenser are kept to 63.2 °C and 36.8 °C. The temperature drop of R170 in the pre-cooled condenser is about 26.4 °C, while the temperature reduction through the long connection pipe caused by natural cooling is 31.6 °C. This implies that using long pipe connecting LTC compressor and CHE may be a good measure to reduce discharge gas temperature. While R170 refrigerant passes through CHE, the refrigerant temperature maintains at 35.0 °C, as shown in Fig. 11b. 1.8 °C temperature drop generates in CHE. As for T1, it undergoes obvious temperature fluctuations, shown as Fig. 11a. After detailed check, we found that the insulation layer of the inlet pipe connecting to compressor has some destructions and the ambient heat leakage leads to the temperature rise of T1. Another reason may be attributed that the suction gas is mixed with some liquid droplets. The evaporation of liquid droplets causes the temperature decrease of suction gas. Generally, T1 almost increases from − 54.2 °C to − 44.6 °C with obvious temperature fluctuation during cycle 1. When it comes into cycle 2, monitor T1 also has some slight temperature increases, and other monitors still maintain at same temperature values.
Figure 12 shows temperature variations of different monitors of HTC. It is evident to see after a short-term adjustment, the CRS enters stable operation and different monitors tend to certain temperatures. The inlet and outlet gas temperatures of HTC compressor are about − 10 °C and 113.4 °C. When high-temperature refrigerant flows into the anti-condensation loop, obvious temperature reduction occurs. Monitors T6′ and T6″ tend to be 72.6 °C and 45.2 °C. 27.4 °C temperature drop generates in the anti-condensation loop. The outlet temperature T7 of condenser is about 39.5 °C, which only has 0.1 °C difference with T7′. Moreover, it seems that 5.7 °C temperature difference forms between the inlet and outlet of condenser. The main reasons are given. (1) There is still a long distance from monitor T6″ to HTC condenser. (2) The refrigerant at the outlet of condenser may be in subcooled state. (3) Obvious pressure drop is generated while refrigerant flows through HTC condenser. All above reasons result in the temperature difference between T6″ and T7.
Fig. 12.

Temperature distribution of different test points of HTC
Figure 13 shows wall temperature variations of two compressors and one oil separator. It can be seen that once the CRS is activated, TLTC increases from 49.4 °C to 71.3 °C and maintains at 71.3 °C in cycle 1, while THTC increases from 35.0 °C and tends to 47.2 °C during stable operation. When it comes to cycle 2, both TLTC and THTC keep to 71.3 °C and 47.2 °C, respectively. As for TOS, it keeps stable temperature value after initial adjustment caused by restart of the CRS. When the CRS stops, TOS reduces to 32.4 °C. During stable operation, it maintains at 36.2 C. It is easy to find that the temperature difference between TLTC and TOS is 35.1 °C. The cooling effect of lubricant oil on low-temperature compressor is verified again.
Fig. 13.

Temperature variations of two compressors and an oil separator
Figure 14 shows temperature variations of different monitors in the freezer. Influenced by stable temperature distribution of different state monitors shown in Figs. 11 and 12, monitors in the freezer also have relatively stable temperature variations. For instance, since 1,020 min, four core monitors experience initial small amplitude temperature rise, then reduce slightly, and tend to be stable since 1170 min, as shown in Fig. 14a. That is to say, it takes about 150 min temperatures of four core monitors reach stable. Same temperature variations also occur in cycle 2. During stable operation, monitors Tcore1–Tcore4 finally maintain at − 84.6 °C, − 86.1 °C, − 87.1 °C, and − 87.4 °C, respectively. It can be seen the air temperature decreases from top to bottom. Moreover, it is easy to find that except some core space in compartment No.1, air temperatures of other space in the freezer all reduce to < − 86.0 °C. Hence, the structure optimism and winding arrangement should be conducted on the evaporation coil to reduce air temperature in compartment No.1 of the freezer. Figure 14b displays temperature distributions of four back monitors. Four back monitors experience sudden temperature rise firstly, then reduce and tend to be constant finally. After 150 min adjustment, the final temperature values of Tback1–Tback4 are − 90.2 °C, − 90.1 °C, − 89.9 °C, and − 89.2 °C, respectively. It is easy to find that temperatures of back monitors increase from top to bottom, which is opposite to the temperature variation trend of core monitors. This is mainly because the temperatures of back monitors reflect variations of refrigerant within the evaporation coil. However, the temperatures of core monitors are the direct reflection of air temperature within the freezer, which is influenced by the combination of evaporation coil cooling and thermal convection in the freezer. Based on temperatures of four back monitors, it can be concluded that the evaporating temperature of LTC must be < − 90 °C.
Fig. 14.

Temperature variations of different a core monitors and b back monitors
Figure 15 shows power consumption of the CRS with Tfreezing = − 86 °C. It is clear to find that the system power of the CRS is about 935 W during stable operation.
Fig. 15.

Power consumption of CRS
− 40 °C freezing temperature
While Tfreezing reduces to − 40 °C, temperature variations of different monitors are measured. As Fig. 16 shows, different monitors first undergo sudden temperature rise. When the target temperature is obtained, temperatures of different monitors start to reduce, and different monitors come into temperature fluctuations. Moreover, it seems that with time continuing, different monitors have temperature reduction trends. After 8 cycles, temperatures of different monitors gradually tend to be stable and maintain at certain values. The suction temperature T1 and discharge temperature T2 of compressor are 20.1 °C and 93.1 °C, as shown in Fig. 16a. The inlet temperature T3 of CHE is about 39.2 °C. Passing through CHE, 0.9 °C temperature drop forms and refrigerant temperature drops to 38.3 °C.
Fig. 16.

Temperature variations of different test points of LTC
Figure 17 shows temperature variations of different monitors of HTC. After initial temperature rise, temperature reduction and self-adjustment, the CRS enters stable operation and different monitors tend to be constant. The average temperature at the outlet of evaporator is about 9.4 °C, and the suction and discharge temperatures of compressor are 40.3 °C and 101.1 °C. With high-temperature vapor flowing through anti-condensation loop, remarkable temperature decrease occurs, and its temperature varies from 80.0 °C to 52.1 °C. The outlet temperature of CHE is about 47.0 °C. It is easy to find that there is still 5.1 °C temperature difference between the inlet and outlet fluid of CHE.
Fig. 17.

Temperature variations of different test points of HTC
Figure 18 shows variations of wall temperatures of three main components. It is clear to see the wall temperatures of two compressors always fluctuate and decrease with time, while TOS experiences an initial slight temperature reduction and then tend to be constant. By comparing TOS and TLTC, it can be found that during rest phase, TOS is always lower than TLTC. Hence, the cooling effect generated by lubricant oil has been greatly displayed.
Fig. 18.

Wall temperature variations of two compressors and an oil separator
Figure 19 displays temperature variations of different monitors in the freezer. Cooled by evaporation coil, different core monitors experience rapid temperature decrease and then decrease gradually (Tcore3 and Tcore4) or experience small amplitude fluctuations (Tcore1 and Tcore2), as shown in Fig. 19a. After several refrigeration cycles, the final temperatures of four core monitors are − 34.2 °C, − 37.8 °C, − 42.8 °C, and − 45.0 °C, respectively. Moreover, temperatures of core monitors decrease from top to bottom, which is opposite to above two experiment conditions. This phenomenon is mainly caused by temperature variations of back monitors. As Fig. 19b shows, four back monitors experience rapid temperature drop once the CRS is activated. Due to refrigerant flowing from top to bottom, monitor Tback1 has the fastest temperature decrease rate, and the temperature decrease rate of Tback4 is slowest. Cooled by the CRS, the lowest temperature of Tback1 can reach − 72.1 °C. Thereafter, Tback1 has slight temperature rise and fluctuates from − 48.2 °C to − 67.3 °C. Monitors Tback2 and Tback3 have similar temperature fluctuation profile. After initial temperature adjustment, Tback2 varies from − 45.1 °C to − 55.4 °C and Tback3 from − 42.0 °C to − 44.9 °C. While for Tback4, its lowest temperature reaches − 35.1 °C. Among four back monitors, Tback1 has the largest temperature fluctuation amplitude with a value of 19.1 °C, and temperature fluctuation amplitudes of Tback2 and Tback3 are 10.3 °C and 2.9 °C. Directly affected by back monitors, monitors Tcore1 and Tcore2 also suffer from small fluctuation variations, as shown in Fig. 19a. As fluctuation amplitudes of Tback3 and Tback4 are not obvious, their effects on the related core monitors are not clearly reflected, so temperatures of Tcore3 and Tcore4 reduce gradually. In addition, among four back monitors, only Tback4 is > − 40 °C. This is mainly because the operation time of the CRS is very short when the freezing temperature reaches − 40 °C. Short-term operation of the CRS causes that the whole connection pipe has not been fully cooled. Hence, Tback4 always has higher temperature. On the other hand, the temperature judgement that control the start and stop switching should be reset again.
Fig. 19.

Temperature variations of a different core monitors and b back monitors
As Fig. 20 shows, P also undergoes seriously fluctuations. During different operation cycles, P almost varies in the range of 1,346–1,444 W, and the average power consumption is about 1,394 W. Moreover, based on Fig. 20, it is easy to find that the rest time of the CRS increases gradually, which means the CRS only runs few time, − 40 °C low-temperature can be obtained.
Fig. 20.

Power consumption of CRS
Generally, CRS is not suggested to be used for generating − 40 °C low-temperature. On the one hand, it causes frequent start-stop of refrigeration system and obvious power increase. On the other hand, the rapid start-stop switch results in obvious temperature fluctuation and inadequate cooling in the freezer space. When CRS is applied for < − 80 °C low-temperature generation, the operation performance becomes much better, especially for − 86 °C.
Analysis and discussion
Based on the present experiment rig, operation performances of a freezer in three Tfreezing are investigated. The stable operation temperatures of some key test points are collected and listed in Table 2. It is easy to find that T1, T2′, T3, T5, T6′, and T7 decrease with Tfreezing, while T2 and T6 increase with Tfreezing. Certainly, some unusual phenomenon occurs as well. For instance, the minimum temperature of T5′ and the maximum temperature of T6″ are achieved with Tfreezing = − 80 °C. However, the temperature drop (T6′–T6″) through the anti-condensation loop also reduces with Tfreezing. For LTC, the cooling effects of the long connection pipe from LTC compressor to pre-cooled condenser, and the pre-cooled condenser, are compared. It is easy to find that with Tfreezing decreasing from − 40 °C to – 86 °C, (T2-T2′) increases from 16.8 °C to 31.2 °C, while (T2′-T3) decreases from 37.1 °C to 26.4 °C. That is to say, with low Tfreezing, the long connection pipe is found to have better cooling effect, while in high freezing temperature case, the pre-cooled condenser has better effects on refrigerant temperature drop. Moreover, apart from T1, temperatures of other state points of Tfreezing = − 80 °C are very close to that of Tfreezing = − 86 °C. With Tfreezing = − 86 °C, the inlet temperature of LTC compressor is about − 49.4 °C, while it is only − 3.6 °C for Tfreezing = − 80 °C. After detailed comparisons, it can be drawn that the suction temperature of two compressors generally decrease with Tfreezing, while the discharge gas temperature has an opposite variation trend.
Table 2.
Temperature comparison of different state monitors
| Tfreezing (°C) | − 40 | − 80 | − 86 |
| T1 (oC) | 20.1 | − 3.6 | − 49.4 |
| T2 (oC) | 93.1 | 94.2 | 94.4 |
| T2’ (°C) | 76.3 | 67.4 | 63.2 |
| T3 (°C) | 39.2 | 37.1 | 36.8 |
| (T2-T2′) (°C) | 16.8 | 26.8 | 31.2 |
| (T2′- T3) (°C) | 37.1 | 30.3 | 26.4 |
| T5 (°C) | 9.4 | − 9.2 | -10 |
| T5′ (°C) | 40.3 | 19.8 | 24.5 |
| T6 (°C) | 101.1 | 107.5 | 113.4 |
| T6’ (°C) | 80 | 75.2 | 72.6 |
| T6’’ (°C) | 47 | 47.3 | 45.2 |
| T7 (°C) | 52.1 | 42.2 | 39.5 |
| (T6′-T6″) (°C) | 33 | 27.9 | 27.4 |
To compare the cooling effect of the CRS, temperatures of different monitors in the freezer are collected. The lowest temperature of back monitors is chosen as well. As Table 3 shows, it is easy to see temperatures of core monitors all reduce with Tfreezing. For Tfreezing = − 40 °C, temperatures of core monitors decrease from top to bottom, while for the other two cases, opposite temperature distribution forms. As introduced above, this is mainly caused by short-term operation and long-term rest of the CRS, which leads to incomplete cooling of system pipe and evident temperature fluctuation. As for back monitors, the minimum temperature can reach − 67.3 °C for Tfreezing = − 40 °C. While for the other two cases, the minimum temperatures are − 86.8 °C and − 90.2 °C. The related heat transfer temperature differences of three cases are 27.3 °C, 6.8 °C, and 4.2 °C, respectively. With a large temperature difference, obvious energy and exergy destruction will form. Hence, adopting CRS to generate − 40 °C is uneconomical and not recommended.
Table 3.
Temperature comparison of different monitors in freezer
| Tfreezing (°C) | − 40 | − 80 | − 86 |
| Tcore1 (°C) | − 45 | − 78.75 | − 84.6 |
| Tcore2(°C) | − 42.8 | − 80.15 | − 86.1 |
| Tcore3 (°C) | − 37.8 | − 81.85 | − 87.1 |
| Tcore4 (°C) | − 34.2 | − 82.60 | − 87.4 |
| Minimum temperature of Tback(oC) | − 67.3 | − 86.8 | − 90.2 |
With Tfreezing varying from – 40 °C to – 86 °C, the average power consumption P of the CRS reduces from 1444 to 935 W. This is mainly because with the decrease of Tfreezing, the inlet temperature of compressor reduces, which results in the increase of suction specific volume of refrigerant and the decrease of mass flow rate of refrigerant. Although the specific compression work has some increases, the combination of the specific compression work and the inlet mass flow rate makes the total power consumption of the CRS reduce with Tfreezing.
Conclusions
In the present study, an experimental apparatus is established to investigate the pull-down and stable operation performance of a CRS with refrigerant pair R290-R170. Three freezing temperature (− 80 °C, − 86 °C, and − 40 °C) experiments are successively measured. Temperature variations of different state monitors of the CRS and monitors in the freezer are measured and analyzed. Some new findings are obtained.
The pull-down performance of the CRS has been study with Tfreezing = − 80 °C. It takes about 240 min the CRS can be pulled down from ambient temperature to − 80 °C. During pull-down process, different state monitors undergo an initial temperature rise and then decrease with different rates. Both core and back monitors in the freezer experience rapid temperature drop, and temperature reduction rate decreases from top to bottom. The power consumption reduces from 1,461.4 to 997.5 W.
While the target temperature is achieved, the CRS comes into periodic start-stop operation. With Tfreezing ranging from − 40 °C to − 86 °C, the inlet temperature gradually decreases, while the discharge temperature has an increase trend. The cooling effect of the pre-cooled condenser reduces with the decrease of Tfreezing, while the long connection pipe has better cooling effect in low freezing temperature case. The temperature reductions through the anti-condensation coil are 33 °C, 27.9 °C, and 27.4 °C with Tfreezing from − 40 °C to − 86 °C.
Most of the freezer space can be cooled to the target temperature. For Tfreezing = − 80 °C and − 86 °C, the air temperature in the freezer reduces from top to bottom, while for Tfreezing = − 40 °C, the highest air temperature appears in the bottom compartment. With the decrease of Tfreezing, the power consumption has an increase trend.
Conclusively, the developed ultralow-temperature freezer can meet the demand of COVID-19 vaccines storage, transportation and distribution. However, it seems that CRS is not suitable for high freezing temperature. To generate − 40 °C low temperature, the power consumption of CRS has obvious increase. Moreover, extensive start-stop switch of CRS causes serious temperature fluctuation in freezer and leads to incomplete cooling of freezer. In short, advantages of CRS cannot be displayed in high freezing temperature.
Abbreviations
- ASHRAE
American Society of Heating, Refrigeration and Air-conditioning Engineers
- CHE
Cascade heat exchanger
- COVID
Corona virus dieses
- COP
Coefficient of performance
- CRS
Cascade refrigeration system
- HFC
Hydrofluorocarbon
- HTC
High-temperature cycle
- LTC
Low-temperature cycle
- T
Temperature
Subscripts
- back
Back monitor
- core
Core monitor
- en
Environment
- freezing
Freezing temperature
- HTC
High-temperature compressor
- LTC
Low-temperature compressor
- left
Left side
- OS
Oil separator
- right
Right side
- top
Top side
Author contribution
All authors contributed to the study, conception and design were performed by Haihui Tan and Zhan Liu, experimental test and data collection were performed by Lingfei Xu, Linlin Yang and Minkai Bai, experiment analysis was performed by Zhan Liu and Haihui Tan. The first draft of the manuscript was written by Haihui Tan and Zhan Liu, and all authors commented on the previous version of the manuscript. All authors read and approved the final manuscript.
Funding
The present research was supported by the Regional Joint Fund-Youth Joint Fund Project of Guangdong Provincial (No.2019A1515110007), and the Normal Project of Zhongshan Social Public Welfare Science and Technology (No.2019B2067).
Data availability
The datasets used and/or analyzed during the current study are available from the corresponding author on reasonable request.
Declarations
Ethical approval
This paper does not contain any studies with human participants or animals performed by any of the authors.
Consent to participate
This is not applicable.
Consent to publish
Authors transfer to Springer the publication rights and warrant that our contribution is original.
Competing interest
The authors declare that they have no competing interests.
Footnotes
Publisher's note
Springer Nature remains neutral with regard to jurisdictional claims in published maps and institutional affiliations.
References
- Adebayo V, Abid M, Adedeji M. Comparative thermodynamic performance analysis of a cascade refrigeration system with new refrigerants paired with CO2. Appl Therm Eng. 2021;184:116286. doi: 10.1016/j.applthermaleng.2020.116286. [DOI] [Google Scholar]
- Aktemur C, Ozturk IT. Energy and exergy analysis of a subcritical cascade refrigeration system with internal heat exchangers using environmentally friendly refrigerants. J Energy Res Technol. 2021;143(10):102103. doi: 10.1115/1.4049271. [DOI] [Google Scholar]
- Aktemur C, Ozturk IT, Cimsit C. Comparative energy and exergy analysis of a subcritical cascade refrigeration system using low global warming potential refrigerants. Appl Therm Eng. 2021;184:116254. doi: 10.1016/j.applthermaleng.2020.116254. [DOI] [Google Scholar]
- Alkhulaifi YM, Mokheimer E. Thermodynamic assessment of using water as a refrigerant in cascade refrigeration systems with other environmentally friendly refrigerants. J Energy Res Technol. 2022;144(2):022101. doi: 10.1115/1.4050959. [DOI] [Google Scholar]
- Amaris C, Tsamos KM, Tassou SA. Analysis of an R744 typical booster configuration, an R744 parallel-compressor booster configuration and an R717/R744 cascade refrigeration system for retail food applications. Part 1: thermodynamic analysis. Energy Procedia. 2019;161:259–267. doi: 10.1016/j.egypro.2019.02.090. [DOI] [Google Scholar]
- ASHRAE (2014) ASHRAE handbook - refrigeration (SI edition). Atlanta, Georgia, US
- Bingming W, Huagen W, Jianfeng L. Experimental investigation on the performance of NH3/CO2 cascade refrigeration system with twin-screw compressor. Int J Refrig. 2009;32(6):1358–1365. doi: 10.1016/j.ijrefrig.2009.03.008. [DOI] [Google Scholar]
- Cabello R, Sánchez D, Llopis R. Energy evaluation of R152a as drop in replacement for R134a in cascade refrigeration plants. Appl Therm Eng. 2017;110:972–984. doi: 10.1016/j.applthermaleng.2016.09.010. [DOI] [Google Scholar]
- Dopazo JA, Fernández-Seara J. Experimental evaluation of a cascade refrigeration system prototype with CO2 and NH3 for freezing process applications. Int J Refrig. 2011;34(1):257–267. doi: 10.1016/j.ijrefrig.2010.07.010. [DOI] [Google Scholar]
- Eini S, Shahhosseini H, Delgarm N. Multi-objective optimization of a cascade refrigeration system: exergetic, economic, environmental, and inherent safety analysis. Appl Therm Eng. 2016;107:804–817. doi: 10.1016/j.applthermaleng.2016.07.013. [DOI] [Google Scholar]
- Getu HM, Bansal PK. Thermodynamic analysis of an R744–R717 cascade refrigeration system[J] Int J Refrig. 2008;31(1):45–54. doi: 10.1016/j.ijrefrig.2007.06.014. [DOI] [Google Scholar]
- Kilicarslan A, Hosoz M. Energy and irreversibility analysis of a cascade refrigeration system for various refrigerant couples. Energy Convers Manage. 2010;51(12):2947–2954. doi: 10.1016/j.enconman.2010.06.037. [DOI] [Google Scholar]
- Lee TS, Liu CH, Chen TW. Thermodynamic analysis of optimal condensing temperature of cascade-condenser in CO2/NH3 cascade refrigeration systems. Int J Refrig. 2006;29(7):1100–1108. doi: 10.1016/j.ijrefrig.2006.03.003. [DOI] [Google Scholar]
- Liu Z, Tan H. Thermal performance of ice-making machine with a multi-channel evaporator. Int J Green Energy. 2019;16(7):520–529. doi: 10.1080/15435075.2019.1597368. [DOI] [Google Scholar]
- Liu Z, Yan J, Gao P, Tan H. Experimental study on temperature distribution in an ice-making machine multichannel evaporator. Sci Technol Built Environ. 2019;25(1):69–82. doi: 10.1080/23744731.2018.1499382. [DOI] [Google Scholar]
- Liu Z, Bai M, Tan H, Ling Y, Cao Z (2023) Experimental test on the performance of a -80°C cascade refrigeration unit using refrigerants R290-R170 for COVID-19 vaccines storage. J Build Eng 63:105537
- Llopis R, Sánchez D, Sanz-Kock C. Energy and environmental comparison of two-stage solutions for commercial refrigeration at low temperature: fluids and systems. Appl Energy. 2015;138:133–142. doi: 10.1016/j.apenergy.2014.10.069. [DOI] [Google Scholar]
- Mateu-Royo C, Arpagaus C, Mota-Babiloni A. Advanced high temperature heat pump configurations using low GWP refrigerants for industrial waste heat recovery: a comprehensive study. Energy Convers Manage. 2021;229:113752. doi: 10.1016/j.enconman.2020.113752. [DOI] [Google Scholar]
- Mota-Babiloni A, Joybari MM, Navarro-Esbrí J. Ultralow-temperature refrigeration systems: configurations and refrigerants to reduce the environmental impact. Int J Refrig. 2020;111:147–158. doi: 10.1016/j.ijrefrig.2019.11.016. [DOI] [Google Scholar]
- Mouneer TA, Elshaer AM, Aly MH. Novel cascade refrigeration cycle for cold supply chain of COVID-19 vaccines at ultra-low temperature -80 °C using ethane (R170) based hydrocarbon pair. World J Eng Technol. 2021;9(2):309–336. doi: 10.4236/wjet.2021.92022. [DOI] [Google Scholar]
- Pan M, Zhao H, Liang D. A review of the cascade refrigeration system. Energies. 2020;13(9):2254. doi: 10.3390/en13092254. [DOI] [Google Scholar]
- Rodriguez-Criado JC, Expósito-Carrillo JA, Pérez BP. Experimental performance analysis of a packaged R290 refrigeration unit retrofitted with R170 for ultra-low temperature freezing. Int J Refrig. 2022;134:105–114. doi: 10.1016/j.ijrefrig.2021.11.015. [DOI] [Google Scholar]
- Roy R, Mandal BK. Energetic and exergetic performance comparison of cascade refrigeration system using R170–R161 and R41–R404A as refrigerant pairs. Heat Mass Transf. 2019;55(3):723–731. doi: 10.1007/s00231-018-2455-7. [DOI] [Google Scholar]
- Roy R, Mandal BK. Thermo-economic analysis and multi-objective optimization of vapour cascade refrigeration system using different refrigerant combinations. J Therm Anal Calorim. 2020;139(5):3247–3261. doi: 10.1007/s10973-019-08710-x. [DOI] [Google Scholar]
- Sarkar J, Bhattacharyya S, Lal A. Performance comparison of natural refrigerants based cascade systems for ultra-low-temperature applications. Int J Sustain Energ. 2013;32(5):406–420. doi: 10.1080/14786451.2013.765426. [DOI] [Google Scholar]
- Sun Z, Liang Y, Liu S. Comparative analysis of thermodynamic performance of a cascade refrigeration system for refrigerant couples R41/R404A and R23/R404A. Appl Energy. 2016;184:19–25. doi: 10.1016/j.apenergy.2016.10.014. [DOI] [Google Scholar]
- Sun Z, Wang Q, Xie Z. Energy and exergy analysis of low GWP refrigerants in cascade refrigeration system. Energy. 2019;170:1170–1180. doi: 10.1016/j.energy.2018.12.055. [DOI] [Google Scholar]
- Turgut MS, Turgut OE. Comparative investigation and multi objective design optimization of R744/R717, R744/R134a and R744/R1234yf cascade refrigeration systems. Heat Mass Transf. 2019;55(2):445–465. doi: 10.1007/s00231-018-2435-y. [DOI] [Google Scholar]
- Udroiu CM, Mota-Babiloni A, Navarro-Esbrí J. Advanced two-stage cascade configurations for energy-efficient–80 °C refrigeration. Energy Convers Manage. 2022;267:115907. doi: 10.1016/j.enconman.2022.115907. [DOI] [PMC free article] [PubMed] [Google Scholar]
- Wang H, Song Y, Cao F. Experimental investigation on the pull-down performance of a -80 °C ultra-low temperature freezer. Int J Refrig. 2020;119:1–10. doi: 10.1016/j.ijrefrig.2020.04.030. [DOI] [Google Scholar]
Associated Data
This section collects any data citations, data availability statements, or supplementary materials included in this article.
Data Availability Statement
The datasets used and/or analyzed during the current study are available from the corresponding author on reasonable request.