Abstract
We describe a method that permits the collection of very small samples (2 nl) from precisely defined positions within the gastric mucus of anesthetized mice. This method was used to study the in vivo local distribution of bacteria within the mucus of Helicobacter felis-infected mice. A total of 200 samples from 40 mice were analyzed. Each sample was microscopically analyzed, within less than 1 min, as a native preparation. To avoid changes in bacterial location within the mucus after collection and to improve the counting accuracy, bacterial motility was blocked by adjusting the pH inside the collecting pipette to 4.5. The mucus in a collected sample was subdivided into three layers, an epithelial layer (the first 25 μm of mucus from the tissue-mucus interface), a luminal layer (the last 25 μm to the mucus-lumen interface), and the remaining central mucus layer. The volume of the analyzed segments in the sample was between 4 and 9 pl. The concentration of bacteria inside the epithelial mucus layer was 3,400 per nl, but it was only 50 per nl inside the central mucus layer. The mean distance of H. felis to the epithelial surface was 16 μm. A total of 75% of all H. felis bacteria resided in the mucus zone between 5 and 20 μm from the tissue surface, with no bacteria closer than 5 μm to the epithelial surface. This method permits the study of factors determining the density of colonization and distribution of bacteria along chemical gradients with a high precision.
Helicobacter pylori is recognized as the most common pathogen of gastroduodenal ulcer disease (17) and is closely associated with the development of carcinomas and mucosa-associated lymphoid tissue lymphomas in the stomach (15, 16). The major ecological niche of H. pylori in the human stomach is the gastric mucus, a gel that coats the complete surface of the gastric mucosa in a continuous lining and that plays a major role in protecting the gastric mucosa from damage by acid and the proteolytic action of pepsin (1, 18). The bacteria can maintain a reservoir within the mucus gel due to their vigorous motility. Gastric Helicobacter spp. owe their motility to unipolar (H. pylori) or bipolar (H. felis) bundles of sheathed flagella, and their motility is essential for the ability to establish chronic colonization (2, 6, 8, 20).
Although considerable progress has been made in recent years in understanding the pathophysiology of Helicobacter infections (for reviews, see references 5, 12, and 21), there remain many questions regarding the ecology of gastric Helicobacter species in their natural environment. In particular, only scarce information exists about the spatial distribution of H. pylori bacteria in the stomach and within the gastric mucus layer and about factors that govern the density of colonization or the localization of bacteria in certain parts of the stomach.
A major reason for this lack of information has been that experimental systems for addressing such issues have not been available. Only a few biopsy samples can be taken from a single infected individual in the course of an endoscopy, making it difficult to obtain a representative impression of the density of colonization at different sites. More importantly, the regional distribution of bacteria within the mucus and, in particular, the distance from the epithelial surface have not been studied yet, since endoscopic biopsy techniques are not capable of preserving the natural distribution of Helicobacter. In fact, bacterial movement within a collected sample would disturb the in vivo distribution within seconds after collection. However, it seems likely that the distance of bacteria from the epithelial surface is an important parameter determining the severity of tissue reaction to the infection, because bacteria dwelling in mucus segments close to the epithelium are more likely to interact with host cells than those located in more remote mucus segments.
H. pylori strains display a remarkable genetic diversity due to extensive intraspecific recombination (11, 22), and it has been suggested that strains of H. pylori may differ with respect to the extent of bacterial-epithelial interaction. Some H. pylori strains that lacked the cag pathogenicity island and cagA knockout mutants were found to be more resistant to acid than cagA-positive strains (10); it is likely that this characteristic permits cagA mutant bacteria to colonize distant layers of the mucus (e.g., layers that are closer to the lumen and thus are more acidic) more effectively than cagA-positive strains, which are forced to stay closer to the epithelium due to their lower resistance to acid. This difference may be one reason for the more intense inflammation seen in most infections with cagA-positive H. pylori strains and for the higher association of such strains with severe disease, such as ulcers and gastric tumors (3, 4, 24).
In this study, we describe an experimental setup that permits study of the in vivo distribution of Helicobacter bacteria in the stomach by permitting the collection of very small mucus samples (a volume of 2 nl) from precisely defined positions within the gastric mucus of anesthetized animals. One of the most widely used animal models of gastric Helicobacter colonization is the infection of mice with H. felis (13). We have applied our experimental setup to the study of the in vivo distribution of H. felis within the gastric mucus of mice. We show that in the antrum of the murine stomach, the overwhelming majority of bacteria are found within a narrow zone of the mucus, close to the epithelial surface.
MATERIALS AND METHODS
Animals.
Young female CDR1 mice (average body mass, 25 g) were infected with 107 CFU of H. felis as described by Mohammadi et al. (14). The infected mice were kindly supplied by Bayer AG (PH-Research Antiinfectives, Wuppertal, Federal Republic of Germany [FRG]), which had shown by histology that the infection had persisted lifelong. At least 5 weeks were allowed after infection before the mice (n = 40) were used in this study.
Anesthesia.
The animals were anesthetized with halothane and spontaneously breathed a mixture of halothane and carbogen (5% CO2 and 95% O2) under semiclosed anesthesia. The respiratory frequency was reduced from the awake, eupneic level (200 ml · min−1) to about 150 ml · min−1 during stable anesthesia. The animals were kept under stable cardiorespiratory conditions for the entire experiment, which lasted 150 min.
Stomach preparation.
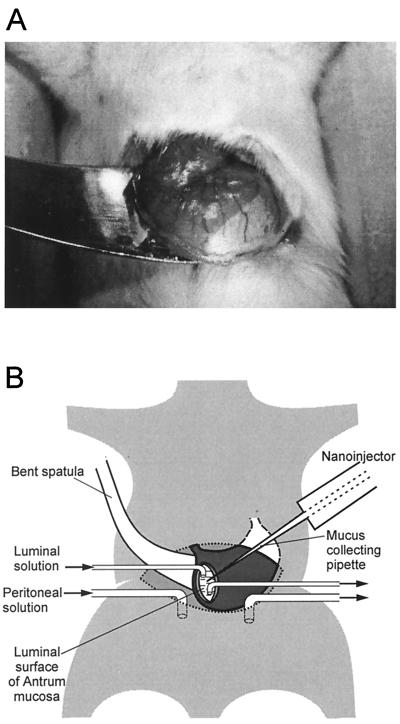
The stomach was carefully lifted through an incision in the ventral body wall and was fixed with tissue adhesive at its dorsal side to a bent spatula mounted on a micromanipulator over the ventral side of the abdominal region, as shown in Fig. 1A. A small incision was made in the ventral wall of the antrum by use of a high-frequency-current scalpel for thermocautery (Erbotom T 71 D; Erbe, Tübingen, FRG). Care was taken not to destroy larger branches of the left gastric artery. The chyme was sucked off the stomach without touching the dorsal wall of the antrum from inside.
FIG. 1.
Experimental setup. (A) Photograph of the stomach, carefully lifted through a ventral incision, and glued with tissue adhesive to the surface of a bent spatula. There is a sharp borderline between the white surface of the forestomach and the darker (red) surface of the corpus. (B) Schematic drawing of the nanoinjector setup. The collecting pipette is inserted through a small incision in the ventral antrum wall. The sample is collected from the dorsal antrum mucosa penetrating from the luminal side. The abdominal cavity is perfused with a solution similar to blood plasma; the gastric lumen is perfused with a CO2-saturated isotonic salt solution (pH 3.8).
The abdominal cavity was perfused with a solution containing 120 mM NaCl, 5 mM KCl, 25 mM Na2HCO3, 0.5 mM MgSO4, 20 mM Tris buffer, 2 mM CaCl2, 20 mM glucose, and 8 mM urea at pH 7.4. The gastric lumen was superfused with a solution containing 150 mM NaCl equilibrated with CO2 to give a pH of 3.8. The flow of both solutions was 50 ml/h. Small glass tubes were used for superfusion of the gastric lumen and of the abdominal cavity. Figure 1B shows a schema of the setup.
The mucosa of the dorsal wall of the antrum, visible through the ventral incision, was covered by an opaque layer of mucus through which the blood supply of the underlying mucosa could be qualitatively estimated. Bright red color indicated sufficient blood supply, pale red was a symptom of low blood pressure, and a white region indicated an anemic infarct. The anesthesia and solutions were optimized to ensure bright red color of the mucosa.
Collection of nanoliter samples.
For collection of samples, we used a previously described microinjection system that had been developed to permit the collection of very small (a few nanoliters) samples of highly viscous gels and the injection of similar volumes of liquid into such gels under high pressure (up to 104 kPa) (19).
The principle of this system is to heat or to cool down a pipette that is closed with a glass piston at the open end of the shank. The shank is filled with silicon oil, and the tip is filled with a buffer solution. For collection of nanoliter samples, the silicon oil in the pipette is preheated to a preselected temperature (50°C) by use of a microprocessor-controlled pipette holder. The pipette is inserted in the mucus, and the silicon oil is allowed to cool down (48°C), whereby a mucus sample is aspirated into the pipette tip. The pipette is withdrawn from the mucus, and the collected mucus sample is expelled by reheating the silicon oil to 60°C. Heating the silicon oil does not heat the pipette tip or sample collected in the pipette tip.
Collection pipettes were pulled from borosilicate glass filaments (outer diameter, 1.5 mm; inner diameter, 1.2 mm; Hilgenberg, Malsfeld, FRG) by use of an air jet puller (P 97; Sutter Instruments, Novato, Calif.). The tip of each pipette was filled with a phosphate buffer solution (pH 4.5). The tip of the completed pipette was beveled at an angle of 25° to a tip opening of 30 μm (Micro-pipette beveler BV-10; Sutter Instruments).
Sample analysis.
To collect a sample, the tip of the pipette had to penetrate the mucus layer and the superficial tissue. Care was taken not to penetrate the underlying mucosa through the epithelial layer, since this action would cause severe capillary hemorrhage. The collected sample was ejected into 2 μl of a buffer solution (pH 4.5) on an epoxy-coated microscope slide (Diagnostica Microscope Slide; Menzel Gläser, Braunschweig, FRG), forming a chamber with an 8-mm diameter and a 20-μm depth when the cover glass was squeezed over the microscope slide; this procedure ensured the detection of all bacteria. The microscope slide was kept on a cold plate (10°C). The actual size of each sample was measured microscopically.
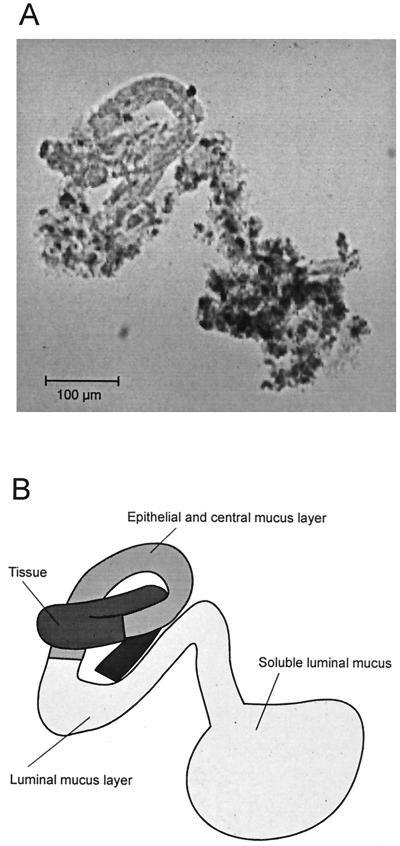
When the cylindrical probe was ejected from the pipette onto the microscope slide, it typically curled up and became tortuous, as shown in the example of Fig. 2. At a 100-fold magnification, two parts of the mucus layer in the cylindrical probe could be distinguished—one close to the epithelial cells, as evidenced by epithelial cells, and one bordering the luminal fraction. With the information from a higher magnification, the epithelial layer could be further subdivided into epithelial and central mucus layers.
FIG. 2.
Collected and ejected sample of gastric mucus. (A) Cylindrical sample (100-fold magnification). (B) Schematic drawing of the sample.
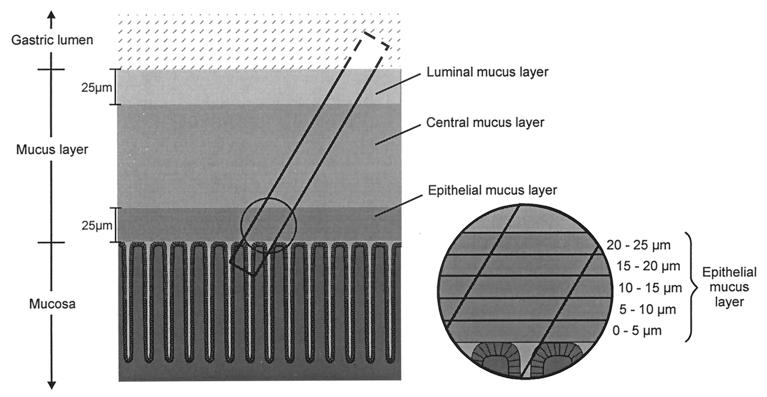
The samples were examined under the microscope at a 1,000-fold magnification. They consisted of a tissue portion, characterized by epithelial cells in a typical foveolar structure, and a mucus portion, characterized by the epithelial, the central, and the luminal mucus layers (see above). The epithelial mucus was defined as the mucus layer of the first 25 μm from the epithelial surface, the luminal mucus was defined as the mucus layer of the last 25 μm to the luminal surface, and the central mucus was defined as the remaining layer between both. Figure 3 shows a schematic representation of a sample.
FIG. 3.
Schematic drawing of the pipette inside the mucus and epithelial layer and of the collected sample. The cylindrical samples contained superficial tissue and the overlying mucus. The three layers were as follows: an epithelial mucus layer (the first 25 μm of mucus from the tissue-mucus interface), a luminal mucus layer (the last 25 μm of mucus to the mucus-lumen interface), and a central mucus layer between the two. The insert shows the further subdivision of the epithelial mucus layer into five sublayers of 5 μm each.
Detection of Helicobacter cells in the mucus samples.
Different sectors of the sample, each containing an area of epithelial or central mucus, were digitally photographed. Areas of epithelial mucus and central mucus inside a photographed sector were marked. All bacteria inside the volume of these areas were counted by moving the focal plane of the microscope through the sample. From the area of the marked sector and its depth in the chamber, the actual volume of the analyzed sample was calculated. Two or three different areas of epithelial or central mucus could typically be analyzed in each sample.
Determination of the distance between bacteria and the epithelial cell surface.
The distance between a given H. felis bacterium and the epithelial cell surface was measured. Because of the relatively large size of the bacterium (average length, 12.5 μm), the distance from the middle portion of the bacterium was used.
RESULTS
Different mucus layers.
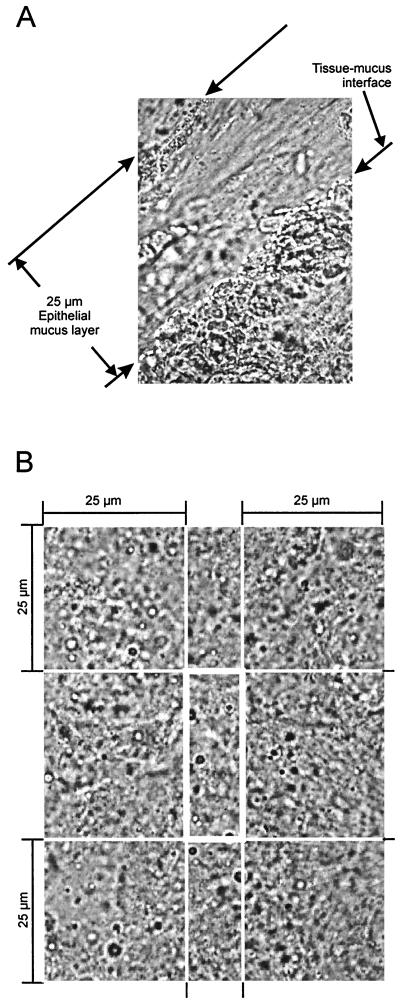
The epithelial mucus layer was distinguished from the central and luminal portions of the mucus by its high transparency and a tidy fibrillar structure. Cells detached from the epithelial surface could be identified inside the epithelial mucus layer but lost their contours inside the central or luminal mucus layer. Part of the epithelial mucus layer is shown at a 1,000-fold magnification in Fig. 4A.
FIG. 4.
Micrograph of regions analyzed under the microscope. (A) Section of a sample collected from the epithelial mucus 970-fold magnification). The photograph shows the main criteria for definition of the epithelial mucus layer: distance of less than 25 μm from the tissue surface, high transparency, and tidy fibrillar structure. (B) Magnification of the central mucus and the bordering 25-μm layers of luminal mucus and epithelial mucus.
The remaining mucus (besides the epithelial layer) was characterized by a homogeneously clouded and not well arranged structure. The depth of this portion was more than 100 μm; adhering particles made it easy to identify the luminal surface. Within the central and luminal portions of the mucus, we could not find any differences in Helicobacter colonization. We chose sections from the center of this large region of mucus, without any cell or surface contact (central mucus), for analysis, as shown in Fig. 4B.
Sample volumes.
The volume of the sample cylinders was 2.0 ± 1.7 nl (mean ± standard deviation [SD], n = 81). The mean ± SD volumes of the analyzed sections in samples collected from Helicobacter-infected and noninfected mice were as follows (number of samples): 6.5 ± 4.1 pl (83) and 8.6 ± 6.5 pl (112) for epithelial mucus, respectively, and 3.9 ± 1.0 pl (86) and 3.7 ± 1.2 pl (69) for central mucus, respectively.
Density distribution of H. felis.
On average, 22 H. felis bacteria were detected in a sample volume of 6.5 pl of epithelial mucus, a value which equals a density of about 3,400 Helicobacter bacteria per nl. In contrast, only 50 bacteria were detected per nl of central mucus. The mean ± SD (number of samples) number of H. felis bacteria per nanoliter inside the epithelial or central mucus layers of H. felis-infected and noninfected mice were as follows: 3,430 (83) and 0 (112) for epithelial mucus, respectively, and 50 (86) and 0 (69) for central mucus, respectively; the ranges for H. felis-infected mice were 500 to 10,230 and 0 to 370 bacteria per nl of epithelial mucus and central mucus, respectively.
About 20% of the mucus layer was epithelial mucus. From the density of Helicobacter bacteria inside the epithelial mucus and the central mucus and the volume ratio, we can estimate that 94% of the mucus layer colonization by Helicobacter bacteria occurs inside the epithelial mucus.
To further describe the distribution of Helicobacter bacteria in subsections of the epithelial mucus, we divided this mucus layer into five sublayers, each with a thickness of 5 μm: 0 to 5 μm, 5 to 10 μm, 10 to 15 μm, 15 to 20 μm, and 20 to 25 μm (Fig. 3). The mucus layer that immediately overlays the epithelial cells (0 to 5 μm) was completely free of bacteria. The mucus layer with the highest density of bacteria was the layer at a distance of 10 to 15 μm from the epithelium (Table 1).
TABLE 1.
Distribution of H. felis (134 bacteria) inside the epithelial mucus layer
| Distance to the tissue (μm) |
% H. felis inside the epithelial layer |
|---|---|
| 0–5 | 0 |
| 5–10 | 12 |
| 10–15 | 36 |
| 15–20 | 28 |
| 20–25 | 24 |
| Total (0–25) | 100 |
Distance of H. felis cells to the epithelial cell surface.
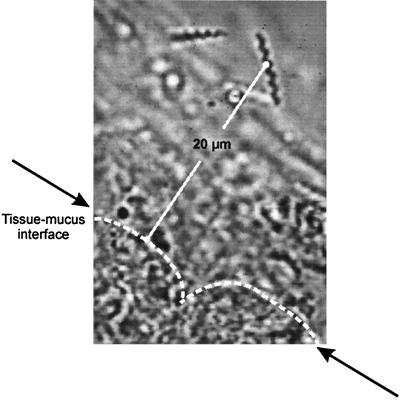
To evaluate the distance of Helicobacter bacteria to the tissue surface, we excluded the rare Helicobacter bacteria colonizing the central mucus. The distance of these bacteria to the tissue appeared to be stochastic. The mean distance of H. felis in the epithelial layer to the tissue surface was 16 ± 6 μm (mean ± SD, n = 150). Figure 5 shows an example of an H. felis bacterium and the epithelial cell surface and the measurement of the distance from the bacterium to the epithelial cell surface.
FIG. 5.
Measurement of the distance from H. felis inside the epithelial mucus to the epithelial surface.
DISCUSSION
Despite much progress in recent years in the knowledge of the pathogenesis of H. pylori infection, very little is known about the behavior of gastric Helicobacter cells in the gastric mucus. Motility has been shown to be essential for the ability of Helicobacter spp. to colonize the gastric mucosa (2, 6, 8), since there is continuous mucus production and hence mucus movement toward the gastric lumen (18). Bacteria swimming in this mucus probably constitute a key reservoir for chronic infection. However, numerous questions about the pathogenic process are unresolved. How fast do Helicobacter cells enter the gastric mucus after being ingested? Does infection depend upon certain conditions, such as phases of reduced acid secretion? Which chemical gradients guide Helicobacter cells into the mucus, and which gradients serve to maintain their position in layers with favorable conditions? Do different strains of Helicobacter have preferences within the gastric mucus? The experimental model described in this report permits some of these questions to be addressed.
The setup described has two major advantages. First, the mucus is collected from a living animal. This aspect is crucial because, after an animal is sacrificed, chemical gradients are disturbed within minutes and the mucus loses its integrity. Also, movement of the bacteria is so rapid that they can completely traverse the entire mucus layer within less than 30 s. Precise determination of the bacterial distribution therefore requires that the bacteria be immobilized instantaneously. In our model, this immobilization is achieved immediately after collection of the sample into the pipette tip because the buffer solution in the pipette is adjusted to a pH of 4.5 (9) and the microscope slide is kept at a temperature of 10°C.
The second advantage of our setup is the small sample size, which leaves the mucus layer and the mucosal cells of the sample region intact. This aspect raises the possibility of repetitive sampling from the same region to study the effect of experimentally induced changes in transmucosal gradients (e.g., changes in the pH gradient) on the distribution of bacteria.
In order to assess the usefulness of this system for research on Helicobacter spp., we have used mice infected with H. felis, one of the most widely used models of gastric Helicobacter infections (13). This model offers the advantage of providing high and relatively constant bacterial densities. For the purpose of this study, another advantage was that H. felis bacteria almost never adhere to epithelial cells (23), thus permitting the study of only mucus colonization rather than the more complicated situation in H. pylori infection, which involves both an adherent bacterial population and the population of bacteria dwelling in the mucus.
We show here that H. felis preferentially colonizes a relatively narrow layer of the mucus, close to the epithelial surface. Bacterial density did not increase steadily toward the epithelial surface; rather, there was a narrow zone in immediate proximity to the epithelial surface that was virtually free of bacteria. The pH gradient within the murine mucus layer has not been studied. However, the value measured in guinea pig mucus (18), which is about pH 5 to pH 6, may apply here as well. At least in mice, H. felis thus colonizes a very defined segment of the gastric mucus where the majority of bacteria do not directly interact with epithelial cells and are still at a pH not far from neutrality.
The few bacteria outside the epithelial layer of 25 μm and thus at a much more acidic pH (18) may, in fact, have been dead, immobilized before collection; they may thus have been carried toward the gastric lumen with the continuously growing mucus layer. Hence, our results suggest even more that H. felis occupies a very narrow layer within the gastric mucus, between 5 and 25 μm from the epithelial surface, in infected mice.
The animal model and experimental techniques described here can be easily adapted to the study of murine H. pylori infection as well as the colonization of other animals with Helicobacter species (e.g., H. pylori infection in Mongolian gerbils) (7). They also permit manipulation of conditions, such as the chemical gradient in the gastric mucus, and thereby assessment of the importance of such a gradient for the orientation of Helicobacter cells in mucus.
ACKNOWLEDGMENTS
We gratefully acknowledge the gift of H. felis-infected mice from H. O. Werling, Bayer AG, Wuppertal, Germany. We also thank Susanne Friedrich and Claudia Jung for excellent technical assistance.
This work was supported by grants Sche 46/14-1 and Su 133/2-3 (Gerhard Hess award) from the Deutsche Forschungsgemeinschaft as well as by the research support fund (FoRUM) of the Medizinische Fakultät, Ruhr-Universität Bochum.
REFERENCES
- 1.Allen A, Hutton D A, Leonard A J, Pearson J P, Sellers L A. The role of mucus in the protection of the gastroduodenal mucosa. Scand J Gastroenterol. 1986;21(Suppl. 125):71–77. doi: 10.3109/00365528609093820. [DOI] [PubMed] [Google Scholar]
- 2.Andrutis K A, Fox J G, Schauer D B, Marini R P, Li X, Yan L, Josenhans C, Suerbaum S. Infection of the ferret stomach by isogenic flagellar mutant strains of Helicobacter mustelae. Infect Immun. 1997;65:1962–1966. doi: 10.1128/iai.65.5.1962-1966.1997. [DOI] [PMC free article] [PubMed] [Google Scholar]
- 3.Covacci A, Falkow S, Berg D E, Rappuoli R. Did the inheritance of a pathogenicity island modify the virulence of Helicobacter pylori? Trends Microbiol. 1997;5:205–208. doi: 10.1016/S0966-842X(97)01035-4. [DOI] [PubMed] [Google Scholar]
- 4.Crabtree J E, Farmery S M, Lindley I J D, Figura N, Peichl P, Tompkins D S. CagA/cytotoxic strains of Helicobacter pylori and interleukin-8 in gastric epithelial cell lines. J Clin Pathol. 1994;47:945–950. doi: 10.1136/jcp.47.10.945. [DOI] [PMC free article] [PubMed] [Google Scholar]
- 5.Dunn B E, Cohen H, Blaser M J. Helicobacter pylori. Clin Microbiol Rev. 1997;10:720–741. doi: 10.1128/cmr.10.4.720. [DOI] [PMC free article] [PubMed] [Google Scholar]
- 6.Eaton K A, Suerbaum S, Josenhans C, Krakowka S. Colonization of gnotobiotic piglets by Helicobacter pylori deficient in two flagellin genes. Infect Immun. 1996;64:2445–2448. doi: 10.1128/iai.64.7.2445-2448.1996. [DOI] [PMC free article] [PubMed] [Google Scholar]
- 7.Hirayama F, Takagi S, Kusuhara H, Iwao E, Yokoyama Y, Ikeda Y. Induction of gastric ulcer and intestinal metaplasia in Mongolian gerbils infected with Helicobacter pylori. J Gastroenterol. 1996;31:755–757. doi: 10.1007/BF02347631. [DOI] [PubMed] [Google Scholar]
- 8.Josenhans C, Ferrero R L, Labigne A, Suerbaum S. Cloning and allelic exchange mutagenesis of two flagellin genes of Helicobacter felis. Mol Microbiol. 1999;33:350–362. doi: 10.1046/j.1365-2958.1999.01478.x. [DOI] [PubMed] [Google Scholar]
- 9.Karim Q N, Logan R P, Puels J, Karnholz A, Worku M L. Measurement of motility of Helicobacter pylori, Campylobacter jejuni, and Escherichia coli by real time computer tracking using the Hobson BacTracker. J Clin Pathol. 1998;51:623–628. doi: 10.1136/jcp.51.8.623. [DOI] [PMC free article] [PubMed] [Google Scholar]
- 10.Karita M, Blaser M J. Acid-tolerance response in Helicobacter pylori and differences between cagA+ and cagA− strains. J Infect Dis. 1998;178:213–219. doi: 10.1086/515606. [DOI] [PubMed] [Google Scholar]
- 11.Kersulyte D, Chalkauskas H, Berg D E. Emergence of recombinant strains of Helicobacter pylori during human infection. Mol Microbiol. 1999;31:31–43. doi: 10.1046/j.1365-2958.1999.01140.x. [DOI] [PubMed] [Google Scholar]
- 12.Labigne A, de Reuse H. Determinants of Helicobacter pylori pathogenicity. Infect Agents Dis. 1996;5:191–202. [PubMed] [Google Scholar]
- 13.Lee A, Fox J G, Otto G, Murphy J. A small animal model of human Helicobacter pylori active chronic gastritis. Gastroenterology. 1990;99:1315–1323. doi: 10.1016/0016-5085(90)91156-z. [DOI] [PubMed] [Google Scholar]
- 14.Mohammadi M, Czinn S, Redline R, Nedrud J. Helicobacter-specific cell-mediated immune responses display a predominant Th1 phenotype and promote a delayed-type hypersensitivity response in the stomachs of mice. J Immunol. 1996;156:4729–4738. [PubMed] [Google Scholar]
- 15.Nomura A, Stemmermann G N, Chyou P-H, Kato I, Perez-Perez G I, Blaser M J. Helicobacter pylori infection and gastric carcinoma among Japanese Americans in Hawaii. N Engl J Med. 1991;325:1132–1136. doi: 10.1056/NEJM199110173251604. [DOI] [PubMed] [Google Scholar]
- 16.Parsonnet J, Hansen S, Rodriguez L, Gelb A B, Warnke R A, Jellum E, Orentreich N, Vogelman J H, Friedman G D. Helicobacter pylori infection and gastric lymphoma. N Engl J Med. 1994;330:1267–1271. doi: 10.1056/NEJM199405053301803. [DOI] [PubMed] [Google Scholar]
- 17.Peterson W L. Helicobacter pylori and peptic ulcer disease. N Engl J Med. 1991;324:1043–1048. doi: 10.1056/NEJM199104113241507. [DOI] [PubMed] [Google Scholar]
- 18.Schreiber S, Scheid P. Gastric mucus of the guinea pig: proton carrier and diffusion barrier. Am J Physiol. 1997;272:G63–G70. doi: 10.1152/ajpgi.1997.272.1.G63. [DOI] [PubMed] [Google Scholar]
- 19.Schreiber S, Stüben M, Kröhan P, Scheid P. Micropipette system for sampling and injecting small volumes. J Neurosci Methods. 1998;85:27–32. doi: 10.1016/s0165-0270(98)00113-7. [DOI] [PubMed] [Google Scholar]
- 20.Suerbaum S. The complex flagella of gastric Helicobacter species. Trends Microbiol. 1995;3:168–170. doi: 10.1016/s0966-842x(00)88913-1. [DOI] [PubMed] [Google Scholar]
- 21.Suerbaum S, Josenhans C. Virulence factors of Helicobacter pylori: implications for vaccine development. Mol Med Today. 1999;5:32–39. doi: 10.1016/s1357-4310(98)01390-2. [DOI] [PubMed] [Google Scholar]
- 22.Suerbaum S, Maynard Smith J, Bapumia K, Morelli G, Smith N H, Kunstmann E, Dyrek I, Achtman M. Free recombination within Helicobacter pylori. Proc Natl Acad Sci USA. 1998;95:12619–12624. doi: 10.1073/pnas.95.21.12619. [DOI] [PMC free article] [PubMed] [Google Scholar]
- 23.Taylor N S, Hasubski A T, Fox J G, Lee A. Haemagglutination profiles of Helicobacter species that cause gastritis in man and animals. J Med Microbiol. 1992;37:299–303. doi: 10.1099/00222615-37-5-299. [DOI] [PubMed] [Google Scholar]
- 24.Tummuru M K, Cover T L, Blaser M J. Cloning and expression of a high-molecular-mass major antigen of Helicobacter pylori: evidence of linkage to cytotoxin production. Infect Immun. 1993;61:1799–1809. doi: 10.1128/iai.61.5.1799-1809.1993. [DOI] [PMC free article] [PubMed] [Google Scholar]


