Abstract
Objectives
Overlooking early gastric cancer (EGC) during endoscopy is an issue to be resolved. Image‐enhanced endoscopy is expected to improve EGC detection. This study investigated the usefulness of third‐generation narrow band imaging (3G‐NBI) and texture and color enhancement imaging (TXI) in improving the visibility of EGC using the color difference between EGC and its surrounding gastric mucosa.
Methods
In this retrospective observational study, we examined 51 superficial EGCs that underwent endoscopic submucosal dissection and were observed by all three methods: 3G‐NBI, TXI, and white light imaging (WLI). The primary endpoint was to compare the color difference of each method. For each EGC, we prepared one non‐magnifying image for each method so that the location and size of the lesion in each image were the same. The L*a*b* color space was used to evaluate the color values. When the color values of the cancerous lesion and its surrounding mucosa were (L*c, a*c, b*c) and (L*s, a*s, b*s), respectively, the color difference was defined to be [(L*c−L*s)2+(a*c−a*s)2+(b*c−b*s)2]1/2.
Results
The median color difference was 9.2 (interquartile range, 5.3–15.7) in WLI, 13.5 (interquartile range, 9.4–19.5) in 3G‐NBI, and 15.3 (interquartile range, 9.1–22.1) in TXI. Statistically, the color difference was significantly larger in 3G‐NBI than in WLI (p < 0.001) and TXI compared with WLI (p < 0.001). However, there was no significant difference between 3G‐NBI and TXI (p = 0.330).
Conclusions
Regarding color difference, both 3G‐NBI and TXI were estimated to be more useful than WLI in improving the visibility of superficial EGC.
Keywords: color difference, early gastric cancer, image‐enhanced endoscopy, narrow band imaging, texture and color enhancement imaging
INTRODUCTION
Worldwide, gastric cancer is one of the most common cancers, with more than 1 million cases per year and 5.7% of all cancer diagnoses. 1 , 2 Its prognosis is poor with a 5‐year survival rate of 31% because most cases are already metastatic when diagnosed. 2 Ratios of early gastric cancer (EGC) are high in gastric cancer detected by screening esophagogastroduodenoscopy. 3 Moreover, the group of patients treated for endoscopically detected EGC had fewer deaths than the group that did not receive treatment. 4 These findings suggest that endoscopic detection and treatment of EGC may reduce mortality from gastric cancer. 5 White light imaging (WLI) is the most common method of endoscopic observation of the stomach 6 ; however, even expert endoscopists can overlook EGC under standard WLI. The endoscopic abnormalities of EGC observed by WLI are often subtle and indistinguishable from benign inflammatory changes in the surrounding mucosa. Therefore, missing EGC by WLI is not uncommon, and a meta‐analysis article reports a rate of 9.4% missed ECGs (95% confidence interval 5.7%–13.1%). 7
The usefulness of image‐enhanced endoscopy (IEE) for the detection of EGC has been studied. 8 Narrow band imaging (NBI) is representative of IEE, and second‐generation NBI (2G‐NBI) produces higher‐quality images than first‐generation NBI owing to the improved NBI filter and a xenon lamp. However, 2G‐NBI did not increase the EGC detection rate over conventional WLI in a randomized controlled trial. 9 In 2020, a new endoscopic system using five‐color light‐emitting diodes (LEDs) as a light source became available. This system allows the use of third‐generation NBI (3G‐NBI) and texture and color enhancement imaging (TXI) for detecting EGC. Regarding 3G‐NBI, no studies have examined its usefulness for detecting EGC. TXI has been reported to improve the visibility of EGC compared with WLI, 10 , 11 but there are no studies comparing TXI with other IEE.
This study aimed to simultaneously investigate the usefulness of 3G‐NBI and TXI in improving the visibility of superficial EGC by evaluating the color difference between the cancerous lesion and the surrounding gastric mucosa.
METHODS
Study design
This single‐center, retrospective observational study was conducted at Ishikawa Prefectural Central Hospital, a tertiary referral center in Japan. In accordance with the Declaration of Helsinki, the institutional review board of Ishikawa Prefectural Central Hospital approved this study (approval No.1966; June 7, 2022), and all subjects were provided the opportunity to opt out. Because there were no appropriate previous studies, we conducted this exploratory study with a limited target period instead of calculating the sample size.
ECGs studied
Among 108 EGCs that underwent endoscopic submucosal dissection (ESD) between August 2020 and March 2021, we examined 51 superficial EGCs that were scrutinized by all three observation methods (3G‐NBI, TXI, and WLI) before ESD. Because the protruding type (0–I) and excavated type (0–III) are easy to recognize, the eligible macroscopic type was limited to the superficial type (0–IIa, 0–IIb, and 0–IIc) for this study. We excluded 1 type 0–I, 1 type 0–III, and 55 EGCs for which appropriate images could not be prepared for analysis (Figure 1).
FIGURE 1.
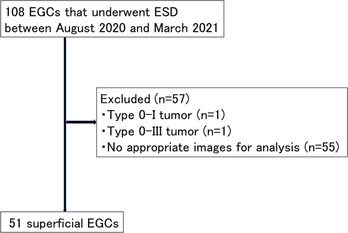
Flowchart of the study subjects. Note, 108 early gastric cancers (EGCs) underwent endoscopic submucosal dissection (ESD) between August 2020 and March 2021
Instruments
An endoscopic system (EVIS X1) with a video processor (CV‐1500) was used in the study. This is a novel endoscopic system that uses LEDs in five colors as a light source and has an IEE called TXI in addition to 3G‐NBI. The video processor settings for structure enhancement were type B, level 6 for WLI, and type B, level 8 for NBI. TXI was used in mode 1. We used the GIF‐EZ1500, GIF‐XZ1200, or GIF‐H290Z gastrointestinal videoscope. These gastroscopes allow endoscopists to switch to 3G‐NBI or TXI by pressing a button on the gastroscope. All the above‐mentioned endoscopic instruments are manufactured by Olympus Corporation (Tokyo, Japan).
3G‐NBI
The NBI system has a dedicated, built‐in, narrow‐bandwidth filter in its light source, with central wavelengths of 415 nm and 540 nm and a bandwidth of 30 nm. 12 Because hemoglobin absorbs this narrow‐band light, the microvascular architecture of the mucosal surface can be easily visualized. In contrast to 2G‐NBI, which uses a xenon lamp as the light source, we have defined 3G‐NBI as the NBI that uses a five‐color LED as the light source.
Texture and color enhancement imaging
TXI is a new IEE modality. 13 This is a white light‐based IEE that is designed to improve the dimensional characterization of subtle surface irregularities, enhance brightness in dark areas, and emphasize color changes.
TXI consists of six consecutive processes. A white light endoscopic image is separated into a detail layer and a base layer. The texture is highlighted by enhancing the detail layer. A dark area can be selectively brightened to adjust the brightness of the base layer. The two enhanced layers are merged to create a TXI as output. Additionally, the color tone of the output is augmented, amplifying the differences between color images, particularly between the bandwidths for white and red, by directly enhancing the color tone in the International Commission on Illumination (CIE) 1976 L∗a∗b∗space. 14 TXI has two settings: TXI mode 1 (texture and brightness, and color enhancement) and TXI mode 2 (texture and brightness enhancement). We used TXI mode 1 in this study because previous studies suggested that TXI mode 1 is more useful than TXI mode 2 in the recognition of EGC. 10 , 11
Evaluation of color difference
A representative case illustrating the evaluation of color difference is shown in Figure 2. For each lesion, we prepared one non‐magnifying image (1920 × 1080 pixels) for each method so that the location and size of the lesion in the three images (3G‐NBI, TXI, and WLI) were the same. Regarding image selection, firstly we extracted all non‐magnifying images in which the entire lesion was captured and the lesion was moderately extended. Then, we selected one set of three images from these extracted images, in which the lesion was most similarly captured in all three methods. A region of interest (ROI) was defined as a circle with a diameter of 24 pixels with reference to a previous study. 15 One ROI was set for each cancerous lesion and the surrounding mucosa at the lesion boundary near the lens of the endoscope. The lesion boundaries in the images were determined based on the results of magnifying NBI and pathology obtained with ESD specimens. The CIE L*a*b* color space developed in 1976 was used to evaluate the hue. When the color values (L*a*b*) of the ROI at the edge of the cancerous lesion and its surrounding mucosa were represented as (L*c, a*c, b*c) and (L*s, a*s, b*s), respectively, their color difference was defined to be [(L*c−L*s)2+(a*c−a*s)2+(b*c−b*s)2]1/2. We compared the color differences obtained by the three observation methods. All calculations of color difference were performed using Image Processing and Analysis in Java software (ImageJ 16 ). The color values were measured by a different person than the one who performed the statistical analysis for this study.
FIGURE 2.
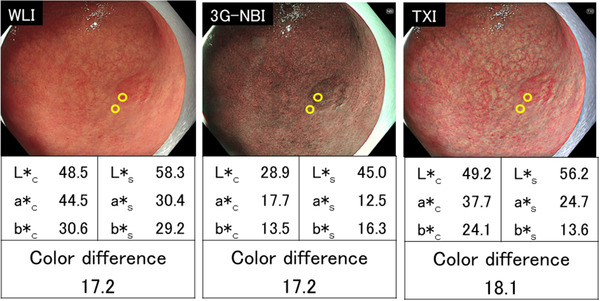
Representative color difference measurement. A depressed lesion (0‐IIc) in the middle third of the stomach was observed. The final histopathological diagnosis was well‐differentiated adenocarcinoma, confined to the mucosa. The color difference was 17.2 in white light imaging (WLI), 17.2 in third‐generation narrow band imaging (3G‐NBI), and 18.1 in texture and color enhancement imaging (TXI). When the color values (L*a*b*) of the region of interest at the edge of the cancerous lesion and its surrounding mucosa were represented as (L*c, a*c, b*c) and (L*s, a*s, b*s), respectively, the color difference was defined to be [(L*c−L*s)2+(a*c−a*s)2+(b*c−b*s)2]1/2
Definition of EGCs
An EGC is defined as a tumor confined to the mucosa or submucosa (without regard to lymph node metastasis), and it was classified according to the Japanese Classification of Gastric Carcinoma. 17 The depth of cancer was divided into the following two groups: T1a was considered to be a tumor confined to the mucosa, and T1b was considered to be a tumor confined to the submucosa. Malignant epithelial tumors, including papillary, tubular (well and moderately differentiated), poorly differentiated (solid and non‐solid type), signet‐ring cell, and mucinous, were diagnosed as gastric cancer. Histological types were divided into two categories: differentiated (papillary or tubular) and undifferentiated (poorly differentiated or signet‐ring cell or mucinous). Gross types were classified as 0‐IIa (superficial elevated), 0‐IIb (superficial flat), or 0‐IIc (superficial depressed). Tumor locations were anatomically classified into three portions, the upper, middle, and lower parts, by the lines connecting the trisected points on the lesser and greater curvatures of the stomach.
Evaluation of background factors
The Kimura–Takemoto classification was used for the endoscopic diagnosis of gastric mucosal atrophy. 18 In the Kyoto Classification of Gastritis developed in 2015, 19 gastric mucosal atrophy was divided into three groups: none (C‐0 to C‐1), mild (C‐2 to C‐3), and severe (O‐1 to O‐3). In accordance with this classification, patients were divided into a non‐atrophic group (C‐0 to C‐1), and a mildly and severely atrophic group (C‐2 to O‐3) in this study. We also examined the gastric mucosal atrophy around the lesion, as it may affect the color difference.
Helicobacter pylori (H. pylori) infection status was divided into three groups: current infection, non‐infection, and past infection. Current infection was defined as positive by any of the following approaches: rapid urease test, microscopic examination, culture method, serum immunoglobulin G antibody testing (≥10 U/ml; H. pylori antibody kit; Special Reference Laboratories, Tokyo, Japan), urea breath test, or fecal H. pylori antigen measurement. Non‐infection was defined as a negative result for all tests performed in serum immunoglobulin G antibody testing (<3 U/ml), urea breath test, and fecal H. pylori antigen measurement, and a case that was endoscopically considered as uninfected using the Kyoto Classification of Gastritis. 19 Finally, past infection was defined as that which did not fit either the current infection or non‐infection definitions.
Outcomes
The primary endpoint was to compare the color difference in the three groups (WLI, 3G‐NBI, and TXI). The secondary endpoint was to compare color differences in the three groups for each location, macroscopic type, histological type, median tumor size, tumor depth, endoscopic gastric atrophy, H. pylori infection status, and gastrointestinal videoscope used.
Statistical analysis
All statistical analyses were performed using EZR (Easy R; Saitama Medical Center, Jichi Medical University, Saitama, Japan), which is a graphical user interface for R (www.r‐project.org). More precisely, it is a modified version of R Commander, designed to add statistical functions frequently used in biostatistics. 20 Continuous variables are presented as the median. A comparison of the color difference between the three modes was examined using the Wilcoxon signed‐rank test. The Bonferroni correction was performed on the primary endpoint, and a p‐value of less than 0.016 (=0.05/3) was considered statistically significant.
RESULTS
The clinicopathological characteristics are shown in Table 1. There were 46 males (90.0%), with a median age of 75 (range 55–90). Most patients (96.0%) showed mild and severe endoscopic gastric atrophy and gastric mucosal atrophy around the lesion. Thirty‐nine patients (76.5%) had a current or past H. pylori infection, and two patients (3.9%) had non‐infection status. The predominant gastrointestinal videoscope used was GIF‐EZ1500 (54.9%) followed by GIF‐H290Z (25.5%). Eighty percent of lesions were located in the upper two‐thirds of the stomach. The predominant macroscopic type was type 0‐IIc (64.7%) followed by type 0–IIa (33.3%), and the median tumor size was 13 mm (range 3–41 mm). Most lesions (92.2%) were differentiated in the histological types and 88.2% were pT1a in the invasion depth. Biopsies were performed prior to observation in all but one lesion.
TABLE 1.
Clinicopathological characteristics
| Patient characteristics and instrument used | N = 51 |
|---|---|
| Sex | |
| Male | 46 |
| Female | 5 |
| Median age, years (range) | 75 (55–90) |
| Endoscopic gastric atrophy | |
| Mild and severe | 49 |
| None | 2 |
| H. pylori infection status | |
| Current | 25 |
| Non‐infection | 2 |
| Past | 14 |
| Unknown | 10 |
| Gastrointestinal videoscope | |
| GIF‐EZ1500 | 28 |
| GIF‐XZ1200 | 10 |
| GIF‐H290Z | 13 |
| Lesion characteristics | N = 51 |
|---|---|
| Location | |
| Upper | 20 |
| Middle | 20 |
| Lower | 10 |
| Anastomosis | 1 |
| Macroscopic type | |
| 0–IIa | 17 |
| 0–IIb | 1 |
| 0–IIc | 33 |
| Median tumor size, mm (range) | 13 (3–41) |
| Histological type | |
| Differentiated | 47 |
| Undifferentiated | 4 |
| Invasion depth | |
| pT1a | 45 |
| pT1b | 6 |
| Atrophy around the lesion | |
| Presence | 49 |
| Absence | 2 |
Abbreviation: H. pylori, Helicobacter pylori.
The median color difference was 9.2 (interquartile range 5.3–15.7) in WLI, 13.5 (interquartile range 9.4–19.5) in 3G‐NBI, and 15.3 (interquartile range 9.1–22.1) in TXI. Statistically, the color difference was significantly larger in 3G‐NBI than in WLI (p < 0.001) and significantly larger in TXI than in WLI (p < 0.001). However, there was no significant difference between 3G‐NBI and TXI (p = 0.330; Figure 3).
FIGURE 3.
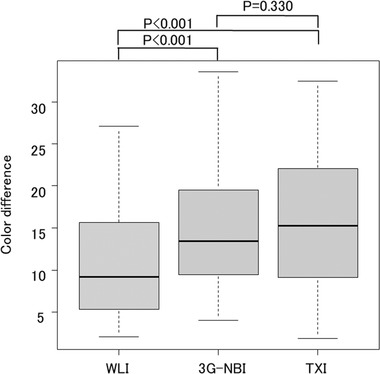
Comparison of color differences in the three groups: white light imaging (WLI), third‐generation narrow band imaging (3G‐NBI), and texture and color enhancement imaging (TXI). The color difference was significantly larger in 3G‐NBI than in WLI (13.5 vs. 9.2, respectively; p < 0.001) and significantly larger in TXI than in WLI (1.3 vs 9.2, p < 0.001). However, there was no significant difference between 3G‐NBI and TXI (p = 0.330)
For each lesion, the color difference with respect to WLI is shown in Figure 4. The color difference in the two cases was smaller in 3G‐NBI and TXI than in WLI. The color difference in the six cases was larger in 3G‐NBI and smaller in TXI than in WLI (a representative case is shown in Figure 5). The color difference in the nine cases was larger in TXI and smaller in 3G‐NBI than in WLI (a representative case is shown in Figure 6).
FIGURE 4.
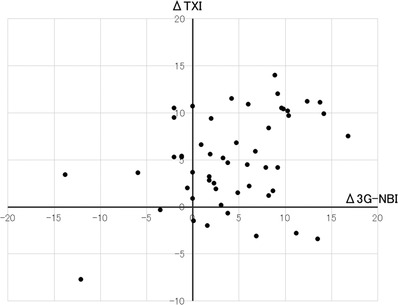
Color difference with respect to white light imaging (WLI) in each lesion. A third‐generation narrow band imaging (3G‐NBI) is defined as the difference in color between 3G‐NBI and WLI. A Δtexture and color enhancement imaging (TXI) is defined as the difference in the color difference between TXI and WLI
FIGURE 5.
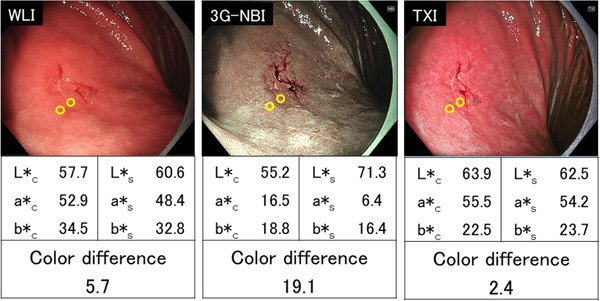
A representative case in which the color difference was larger in third‐generation narrow band imaging (3G‐NBI) and smaller in texture and color enhancement imaging (TXI) than in white light imaging (WLI).A depressed lesion (0‐IIc) in the upper third of the stomach (13 mm in diameter) was observed. The final histopathological diagnosis was well‐differentiated adenocarcinoma, confined to the mucosa. The color difference was 5.7 in WLI, 19.1 in 3G‐NBI, and 2.4 in TXI
FIGURE 6.
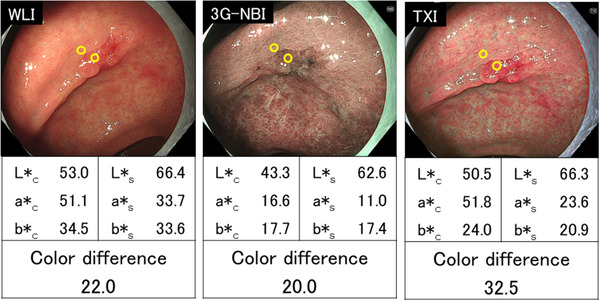
A representative case in which the color difference was larger in texture and color enhancement imaging (TXI) and smaller in third‐generation narrow band imaging (3G‐NBI) than in white light imaging (WLI). A depressed lesion (0–IIc) in the lower third of the stomach (25 mm in diameter) was observed. The final histopathological diagnosis was well‐differentiated adenocarcinoma, confined to the mucosa. The color difference was 22.0 in WLI, 20.0 in 3G‐NBI, and 32.5 in TXI
The median color difference per background factor in each modality is presented in Table 2. The majority of background factors had large color differences for both TXI and 3G‐NBI compared with WLI. There were no background factors that showed significant differences in color differences between TXI and 3G‐NBI.
TABLE 2.
Median color difference per background factors (n = 51)
| Median color difference | p‐Value | |||||
|---|---|---|---|---|---|---|
| WLI | 3G‐NBI | TXI | WLI versus 3G‐NBI | WLI versus TXI | 3G‐NBI versus TXI | |
| Location | ||||||
| upper–middle (n = 41) | 9.9 | 13.6 | 16.1 | <0.001 | <0.001 | 0.280 |
| lower (n = 10) | 4.4 | 12.2 | 10.6 | <0.001 | <0.001 | 1.000 |
| Macroscopic type | ||||||
| 0–IIa (n = 17) | 8.9 | 11.9 | 15.3 | <0.001 | <0.001 | 0.404 |
| 0–IIb (n = 1) | 3.6 | 7.5 | 3.0 | 1.000 | 1.000 | 1.000 |
| 0–IIc (n = 33) | 9.8 | 15.1 | 15.6 | <0.001 | <0.001 | 0.560 |
| Histological type | ||||||
| Differentiated (n = 47) | 9.4 | 13.6 | 15.3 | <0.001 | <0.001 | 0.626 |
| Undifferentiated (n = 4) | 8.5 | 12.7 | 16.5 | 0.250 | 0.125 | 0.250 |
| Median tumor size | ||||||
| <10 mm (n = 11) | 7.7 | 13.4 | 13.2 | <0.001 | <0.001 | 0.638 |
| ≥10 mm (n = 40) | 10.2 | 13.5 | 15.8 | <0.001 | <0.001 | 0.405 |
| Invasion depth | ||||||
| pT1a (n = 45) | 8.3 | 13.4 | 15.1 | <0.001 | <0.001 | 0.388 |
| pT1b (n = 6) | 19.7 | 18.1 | 21.7 | 0.438 | 0.563 | 0.563 |
| Endoscopic gastric atrophy | ||||||
| Present (n = 49) | 8.9 | 13.6 | 15.2 | <0.001 | <0.001 | 0.554 |
| Absent (n = 2) | 12.4 | 11.4 | 20.4 | 1.000 | 0.500 | 0.500 |
| H. pylori infection status | ||||||
| current/past (n = 49) | 8.9 | 13.6 | 15.2 | <0.001 | <0.001 | 0.554 |
| non‐infection (n = 2) | 12.4 | 11.4 | 20.4 | 1.000 | 0.500 | 0.500 |
| Gastrointestinal videoscope | ||||||
| GIF‐EZ1500 (n = 28) | 11.9 | 14.5 | 16.7 | 0.008 | <0.001 | 0.186 |
| GIF‐XZ1200 (n = 10) | 7.2 | 9.4 | 9.0 | 0.010 | 0.020 | 0.432 |
| GIF‐H290Z (n = 13) | 8.9 | 13.6 | 17.0 | <0.001 | <0.001 | 0.685 |
Abbreviations: 3G‐NBI, third‐generation narrow band imaging; H. pylori, Helicobacter pylori; TXI, texture and color enhancement imaging; WLI, white light imaging.
DISCUSSION
Our study showed that 3G‐NBI and TXI were more useful than WLI in improving the visibility of EGC in terms of color difference. However, there was no significant difference between 3G‐NBI and TXI. This is the first study to simultaneously investigate the usefulness of 3G‐NBI and TXI in improving the visibility of superficial EGC by evaluating the color difference.
To detect EGC in screening esophagogastroduodenoscopy using WLI, it is necessary to recognize color differences and morphological findings from the surrounding gastric mucosa. However, the endoscopic abnormalities observed in EGC are so slight that even expert endoscopists can miss EGC. IEE is expected to detect EGC more efficiently, and several studies have been conducted. Yoshida et al. reported that 2G‐NBI did not increase the EGC detection rate over WLI in an open‐label, randomized, controlled tandem trial (2G‐NBI: 2.3% vs WLI: 1.9%, p = 0.41). 9 An endoscopic system using 5‐color LEDs was released worldwide in 2020, and we are now in the era of 3G‐NBI. However, no studies have examined the usefulness of 3G‐NBI for detecting EGC. TXI emphasizes three image components (texture, brightness, and color) in WLI, there were two previous studies that reported the visibility of EGC in TXI. 10 , 11 Ishikawa et al. investigated the color difference between non‐neoplastic and neoplastic areas of 12 gastric neoplasms in WLI and TXI. 10 The color difference was significantly higher for TXI mode 1 than for WLI and TXI mode 2. Abe et al. also investigated the color difference between 20 non‐neoplastic and neoplastic areas of the stomach by comparing WLI, TXI mode 1, and TXI mode 2. 11 Their study constructed still images of TXI mode 1 and TXI mode 2 from WLI images that were consistently in the distance, angle, and air insufflation, by using computer simulation. Their study demonstrated that TXI mode 1 could improve the visibility of EGC compared with WLI by more objective analysis than the study by Ishikawa et al. Both reports indicated that TXI may improve the visibility of EGC compared with WLI. However, none of the previous studies compared it with other IEEs.
We therefore simultaneously compared 3G‐NBI, TXI, and WLI, which are available for EGC screening. As a result, we were able to show the potential usefulness of 3G‐NBI and TXI for the detection of EGC. The majority of cases had larger color differences in both TXI and 3G‐NBI compared with WLI. Interestingly, however, only the color difference of either 3G‐NBI or TXI was larger than that of WLI in some cases. It is assumed that there are EGCs for which 3G‐NBI is more effective and EGCs for which TXI is more effective for detection. However, because of the small sample size, this issue could not be resolved in this study. Future large‐scale studies are expected.
The present study has several limitations. First, it was conducted at a single institution. Second, we examined visibility, not detectability. Since the results of this study do not indicate the usefulness of 3G‐NBI and TXI in actual clinical practice, the detection rate of EGCs will need to be studied in a multicenter, prospective, randomized, controlled trial. The third limitation is the identity of the image. For each lesion, we selected one non‐magnifying image for each method so that the location and size of the lesion in the three images were the same. Hence, the three images in each observation method are not exactly the same. Finally, since this study did not analyze the visibility of non‐cancerous lesions, false positives may increase in clinical practice. It is a matter to be considered in future clinical studies.
In conclusion, this investigation demonstrated that both 3G‐NBI and TXI were more useful than WLI in improving the visibility of EGC in terms of color difference.
CONFLICT OF INTEREST
The authors declare that they have no conflict of interest.
ACKNOWLEDGMENT
We thank Andrea Baird, MD, from Edanz (https://jp.edanz.com/ac) for editing a draft of this manuscript.
REFERENCES
- 1. Bray F, Ferlay J, Soerjomataram I, Siegel RL, Torre LA, Jemal A. Global cancer statistics 2018: GLOBOCAN estimates of incidence and mortality worldwide for 36 cancers in 185 countries. CA Cancer J Clin 2018; 68: 394–424. [DOI] [PubMed] [Google Scholar]
- 2. Rawla P, Barsouk A. Epidemiology of gastric cancer: Global trends, risk factors and prevention. Prz Gastroenterol 2019; 14: 26–38. [DOI] [PMC free article] [PubMed] [Google Scholar]
- 3. Khanderia E, Markar SR, Acharya A, Kim Y, Kim Y‐W, Hanna GB. The influence of gastric cancer screening on the stage at diagnosis and survival: A meta‐analysis of comparative studies in the Far East. J Clin Gastroenterol 2016; 50: 190–7. [DOI] [PubMed] [Google Scholar]
- 4. Tsukuma H, Oshima A, Narahara H, Morri T. Natural history of early gastric cancer: A non‐concurrent, long term, follow up study. Gut 2000; 47: 618–21. [DOI] [PMC free article] [PubMed] [Google Scholar]
- 5. Jun JK, Choi KS, Lee HY et al. Effectiveness of the Korean National Cancer Screening Program in reducing gastric cancer mortality. Gastroenterology 2017; 152: 1319–28. [DOI] [PubMed] [Google Scholar]
- 6. Yao K, Uedo N, Kamada T et al. Guidelines for endoscopic diagnosis of early gastric cancer. Dig Endosc 2020; 32: 663–98. [DOI] [PubMed] [Google Scholar]
- 7. Pimenta‐Melo AR, Monteiro‐Soares M, Libânio D, Dinis‐Ribeiro M. Missing rate for gastric cancer during upper gastrointestinal endoscopy. Eur J Gastroenterol Hepatol 2016; 28: 1041–9. [DOI] [PubMed] [Google Scholar]
- 8. Tajiri H, Niwa H. Proposal for a consensus terminology in endoscopy: How should different endoscopic imaging techniques be grouped and defined? Endoscopy 2008; 40: 775–8. [DOI] [PubMed] [Google Scholar]
- 9. Yoshida N, Doyama H, Yano T et al. Early gastric cancer detection in high‐risk patients: A multicentre randomised controlled trial on the effect of second‐generation narrow band imaging. Gut 2021; 70: 67–75. [DOI] [PMC free article] [PubMed] [Google Scholar]
- 10. Ishikawa T, Matsumura T, Okimoto K et al. Efficacy of texture and color enhancement imaging in visualizing gastric mucosal atrophy and gastric neoplasms. Sci Rep 2021; 11: 6910. [DOI] [PMC free article] [PubMed] [Google Scholar]
- 11. Abe S, Yamazaki T, Hisada IT et al. Visibility of early gastric cancer in texture and color enhancement imaging. DEN Open 2022; 2: e46. [DOI] [PMC free article] [PubMed] [Google Scholar]
- 12. Gono K, Obi T, Yamaguchi M et al. Appearance of enhanced tissue features in narrow‐band endoscopic imaging. J Biomed Opt 2004; 9: 568–77. [DOI] [PubMed] [Google Scholar]
- 13. Sato T. TXI: Texture and color enhancement imaging for endoscopic image enhancement. J Healthc Eng 2021; 2021: 5518948. [DOI] [PMC free article] [PubMed] [Google Scholar]
- 14. Kuehni RG. Color‐tolerance data and the tentative CIE 1976 L*a*b formula. J Opt Soc Am 1976; 66: 497–500. [DOI] [PubMed] [Google Scholar]
- 15. Fujiyoshi T, Miyahara R, Funasaka K et al. Utility of linked color imaging for endoscopic diagnosis of early gastric cancer. World J Gastroenterol 2019; 25: 1248–58. [DOI] [PMC free article] [PubMed] [Google Scholar]
- 16. Rasband WS. Image J U. S. National Institutes of Health (Computer program). Version 1.53. Bethesda, Maryland, USA. 2020. [cited 2020 Nov 7]. Available from: http://imagej.nih.gov/ij/
- 17. Japanese Gastric Cancer Association . Japanese classification of gastric carcinoma: 3rd English edition. Gastric Cancer 2011; 14: 101–12. [DOI] [PubMed] [Google Scholar]
- 18. Kimura K, Takemoto T. An endoscopic recognition of the atrophic border and its significance in chronic gastritis. Endoscopy 1969; 1: 87–97. [Google Scholar]
- 19. Kamada T, Haruma K, Inoue K, Shiotani A. Helicobacter pylori infection and endoscopic gastritis – Kyoto classification of gastritis. Nihon Shokakibyo Gakkai Zasshi 2015; 112: 982–93. (in Japanese). [DOI] [PubMed] [Google Scholar]
- 20. Kanda Y. Investigation of the freely available easy‐to‐use software “EZR” (Easy R) for medical statistics. Bone Marrow Transplant 2013; 48: 452–8. [DOI] [PMC free article] [PubMed] [Google Scholar]


