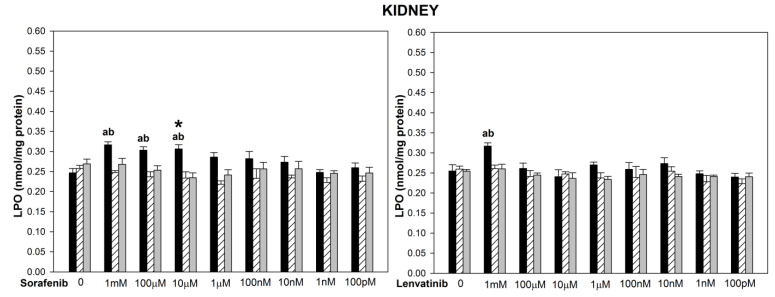
Figure 3.
Lipid peroxidation (LPO), measured as MDA + 4 − HDA level, in porcine kidney homogenates, incubated in the presence of sorafenib (A) (1 mM, 100 µM, 10 µM, 1 µM, 100 nM, 10 nM, 1 nM, 100 pM) or lenvatinib (B) (1 mM, 100 µM, 10 µM, 1µM, 100 nM, 10 nM, 1 nM, 100 pM) alone (black bars), or sorafenib/lenvatinib together with melatonin (5.0 mM) (striped bars) or together with indole-3-propionic acid (5.0 mM) (grey bars). LPO level is expressed in nmol/mg protein. Data are presented as mean ± SE (error bars). a p < 0.05 vs. control (without any substance); b p < 0.05 vs. respective concentration of sorafenib with melatonin (5.0 mM) or with indole-3-propionic acid (5.0 mM); * p < 0.05 vs. lenvatinib in the same concentration.

