Abstract
Background and Objectives
Amyotrophic lateral sclerosis (ALS) is a multisystem disorder, as supported by clinical, molecular, and neuroimaging evidence. As a consequence, predicting clinical features requires a description of large-scale neuronal dynamics. Normally, brain activity dynamically reconfigures over time, recruiting different brain areas. Brain pathologies induce stereotyped dynamics which, in turn, are linked to clinical impairment. Hence, based on recent evidence showing that brain functional networks become hyperconnected as ALS progresses, we hypothesized that the loss of flexible dynamics in ALS would predict the symptoms severity.
Methods
To test this hypothesis, we quantified flexibility using the “functional repertoire” (i.e., the number of configurations of active brain areas) as measured from source-reconstructed magnetoencephalography (MEG) in patients with ALS and healthy controls. The activity of brain areas was reconstructed in the classic frequency bands, and the functional repertoire was estimated to quantify spatiotemporal fluctuations of brain activity. Finally, we built a k-fold cross-validated multilinear model to predict the individual clinical impairment from the size of the functional repertoire.
Results
Comparing 42 patients with ALS and 42 healthy controls, we found a more stereotyped brain dynamics in patients with ALS (p < 0.05), as conveyed by the smaller functional repertoire. The relationship between the size of the functional repertoire and the clinical scores in the ALS group showed significant correlations in both the delta and the theta frequency bands. Furthermore, through a k-fold cross-validated multilinear regression model, we found that the functional repertoire predicted both clinical staging (p < 0.001 and p < 0.01, in the delta and theta bands, respectively) and symptoms severity (p < 0.001, in both the delta and theta bands).
Discussion
Our work shows that (1) ALS pathology reduces the flexibility of large-scale brain dynamics, (2) subcortical regions play a key role in determining brain dynamics, and (3) reduced brain flexibility predicts disease stage and symptoms severity. Our approach provides a noninvasive tool to quantify alterations in brain dynamics in ALS (and, possibly, other neurodegenerative diseases), thus opening new opportunities in disease management and a framework to test, in the near future, the effects of disease-modifying interventions at the whole-brain level.
Amyotrophic lateral sclerosis (ALS) is caused by a combination of pathogenic processes encompassing the whole brain.1 Up to 50% of patients with ALS develop cognitive and/or behavioral impairment, with about 13% developing the behavioral variant of frontotemporal dementia.2
Accounting for symptoms induced by widespread neurodegeneration requires a precise description of the fine-tuned, large-scale interactions among brain regions.3 The progression of ALS shifts the functional brain networks toward hyperconnectedness (that is, a regime where the activity of each brain region over time is (too) strongly constrained by the rest of the brain).4 However, the interactions among regions occur in bursts,5 which account for most of the (time-averaged) functional connectivity6 and have been linked to behavioral outcomes, underlying their physiologic significance.7 Hence, average (i.e., static) functional connectivity might not be enough to account for complex symptoms, and time-resolved analyses might be needed.
The healthy brain quickly recruits the appropriate brain regions, in the correct order, at any moment, to respond to the environment. To this end, the brain does not passively “wait” for stimuli, but, rather, it constantly recruits different groups of regions, each of which might be optimal for a given stimulus and the appropriate response.8 The more the brain reconfigures itself (i.e., the more it is flexible), the better it can respond to tasks.9 These “reconfigurations” reflect themselves in large-scale bursts of activations in brain signals called “neuronal avalanches.”10 In fact, although avalanches preferentially spread along the structural connectome,11 they constantly reconfigure, as captured by a large number of patterns over time. Hence, the number of such patterns (i.e., the size of the functional repertoire) provides a measure of brain flexibility, and its reduction relates to clinical impairment.12
Hence, we hypothesized that brain dynamics would be more stereotyped (less flexible) in patients with ALS as compared with healthy controls. Furthermore, given that complex brain functions require flexibility, a restriction of the functional repertoire might underpin clinical impairment.
To estimate flexibility, we used source-reconstructed magnetoencephalographic (MEG) data, which have a millisecond time resolution. MEG measures extremely weak oscillations of the magnetic fields produced by postsynaptic neuronal activity,13 using a helmet equipped with ultrasensitive (fT, 10−15 Tesla) sensors of the magnetic field (superconducting quantum interference devices). Compared with EEG, MEG (1) allows for a temporally and spatially accurate reconstruction of the neural signals14 because magnetic fields are undistorted by the layers surrounding the brain (bones and meningeal sheets) and (2) is reference-free, which helps providing unbiased estimates of functional connectivity.4,10
We filtered the signal in the classic frequency bands and defined a neuronal avalanche as an event that begins when at least 1 brain region deviates from its baseline activity and ends when all regions restore their typical level of activity. Given a neuronal avalanche, we defined its corresponding pattern as the set of all the brain areas that were recruited. Finally, we defined the functional repertoire as the set of the unique patterns that happened over time (i.e., the part of the state-space that has been visited) and used its size as a proxy for the flexibility of the brain dynamics. We further hypothesized that the restriction of the functional repertoire would relate to a worsening of the patients' symptoms. To test this hypothesis, we built a model to predict disease severity and clinical staging based on the size of the functional repertoire.
Methods
Study Participants
Patients with ALS were recruited from the ALS Center of the First Division of Neurology of the University of Campania “Luigi Vanvitelli” (Naples, Italy) from September to December 2016 and from May 2018 to March 2019. Patients were right-handed and native Italian speakers diagnosed with ALS according to the revised El-Escorial criteria.15 All patients underwent Edinburgh Cognitive and Behavioural ALS Screen (ECAS)16 to assess global cognitive functioning. None of the patients showed any variation in the screened genes SOD1, TARDBP, FUS/TLS, and C9ORF72. Healthy controls were also included.
Inclusion criteria were (1) no use of drugs that could interfere with MEG signals; (2) no other major systemic, psychiatric, or neurologic diseases; and (3) no focal or diffuse brain damage at routine MRI.
Standard Protocol Approvals, Registrations, and Patient Consents
The study protocol was approved by the Local Ethics Committee (University of Campania “Luigi Vanvitelli”) with Protocol No. 591/2018, and all participants provided written informed consent in accordance with the Declaration of Helsinki.
Brain Network Analysis
MRI Acquisition
As previously described,17 MRI images of patients with ALS and healthy controls were acquired on a 3T scanner equipped with an 8-channel parallel head coil (General Electric Healthcare, Milwaukee, WI). MR scans were acquired either after the MEG recording or a minimum of 21 days earlier (within 1 month). This was performed to minimize the risk of noise due to the MRI affecting the MEG acquisition. In particular, 3 dimensional T1-weighted images (gradient-echo sequence inversion recovery prepared fast spoiled gradient recalled-echo, time repetition = 6,988 ms, inversion time = 1,100 ms, echo time = 3.9 ms, flip angle = 10, voxel size = 1 × 1 × 1.2 mm3) were acquired. Some participants (7 patients and 11 controls) did not complete the MRI because of the difficulty in lying down or because they refused to perform the MRI scan. A standard MRI template was used in these cases.
MEG Acquisition
MEG data were acquired with a 163-magnetometer system placed in a magnetically shielded room (AtB Biomag UG, Ulm, Germany).18 Data acquisition, preprocessing, and source reconstruction were performed as previously described.4
Briefly, before each acquisition, 4 reference positions (nasion, right, and left preauricular and apex) were digitalized. Electrocardiographic and electrooculographic signals were corecorded.19 The brain activity of each participant was recorded in 2 segments, each 3.5 minutes long, during the resting state with eyes closed. Data were acquired with a sampling frequency of 1,024 Hz, and a 4th-order Butterworth IIR bandpass filter was then applied to remove components below 0.5 and above 48.0 Hz.20 The filter was implemented offline using Matlab 2019a and the Fieldtrip toolbox 2014.21
Data Preprocessing
Principal component analysis was used to orthogonalize the sensors over the base of the references. Then, after visual selection of the data from an experienced operator, supervised independent component analysis (ICA) was used to remove physiologic artefacts such as electrocardiogram and eye blinks (if present).
Source Reconstruction
Source reconstruction was performed using the Fieldtrip toolbox.21 MEG data were coregistered to the MRI, and a beamformer approach22 was used to reconstruct time series related to the centroids of 116 regions of interest (ROIs), derived from the automated anatomical labeling atlas.23,24 Singular value decomposition was used to obtain a scalar. We then considered the first 90 ROIs for further analysis, excluding the cerebellum given the low reliability.25 The source-reconstructed signals were filtered in the classic frequency bands: delta (0.5–4.0 Hz), theta (4.0–8.0 Hz), alpha (8.0–13.0 Hz), beta (13.0–30.0 Hz), and gamma (30.0–48.0 Hz).
Analysis of Brain Dynamics
Neuronal Avalanches and Branching Parameter
To quantify spatiotemporal fluctuations of brain activity, we first estimated neuronal avalanches. As previously described,26 an avalanche is defined as an event starting when an unexpected (given a linear process) fluctuation of regional activity is present and ending when all regions are back to normal activity. The number of activations in all ROIs in an avalanche corresponds to its size. Each of the 90 source-reconstructed signals was z-transformed and thresholded according to a cutoff of 3 standard deviations (i.e., z > |3|).12 To confirm that the results are not dependent on the choice of a given threshold, we repeated the analyses setting the threshold to z > |2.5| and z > |3.5|.
To select a suitable bin length, we computed the branching ratio σ27 as follows: for each participant, for each time bin size, and for each avalanche, the geometrically averaged ratio of the number of events (activations) between the subsequent time bin and the current time bin was calculated as
 |
 |
where σi is the branching parameter of the ith avalanche in the data set, Nbin is the total amount of bins in the ith avalanche, nevents (j) is the total number of events active in the jth bin, and Naval is the total number of avalanches in each participant's recording.
The bin length equal to 3 samples yielded a critical process with σ = 1, hinting at the avalanches as occurring in the context of a dynamical regime near a phase transition. However, we varied time bins from 1 to 5. To compare the dynamics of brain activity among the participants, we took into consideration the same duration for each participant time series (122.79 seconds). Segments of equal duration were randomly selected from the whole recording. For each avalanche, an avalanche pattern was defined as the set of all areas that were above the threshold at any point during the avalanche.
Functional Repertoire
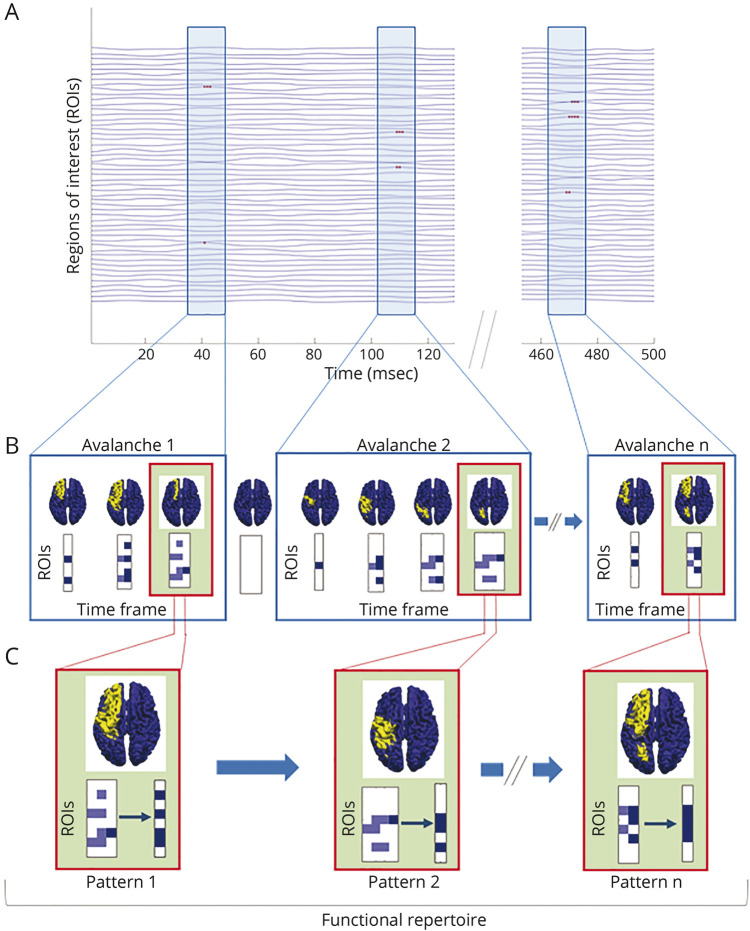
For each participant, we estimated the functional repertoire defined as the number of unique avalanche patterns which occurred during the recording.12 Unique indicates that each avalanche pattern only counts once toward the size of the functional repertoire (i.e., it does not matter if a given avalanche pattern appears only once or multiple times because the functional repertoire refers to the kinds of patterns that occurred, not their number per se). A representation of avalanche patterns and the functional repertoire is shown in Figure 1.
Figure 1. Schematic Representation of Neuronal Avalanches and Functional Repertoire.
(A) Source-reconstructed time series. Light blue rectangles represent the time frames in which neuronal avalanches occur; red dots in the rectangles denote activated brain regions (signal above the threshold) in a time interval (msec). (B) In the boxes, avalanche patterns of 3 different neuronal avalanches are illustrated (for clarity, the avalanches reported last up to 4 time frames). An avalanche is defined as an event that begins when at least 1 brain region deviates from its baseline activity (above the threshold) and ends when all regions display a typical level of activity (below the threshold). Given a neuronal avalanche, its corresponding pattern is the set of all the brain areas that were recruited at any time. The brain plots for each time frame of an avalanche show the areas above (yellow) and below (blue) the threshold. Each matrix represents an avalanche pattern: dark blue squares indicate the brain regions (ROIs) activated at a certain time frame, while the light blue ones are all the regions that have been activated up to that moment. (C) In the green boxes, for each of the above avalanches, the brain plot and the set of unique avalanche patterns are illustrated. Unique means that each avalanche pattern only counts once toward the size of the functional repertoire. The number of unique avalanche patterns defines the size of the functional repertoire and is used as a proxy for the flexibility of the brain dynamics.
Switching Between States
A switch is defined as crossing the threshold level, in either direction, and, therefore, occurs when an active region becomes inactive, and vice versa, between 2 consecutive time bins. The switch rate (number of switches over duration), averaged over areas, was computed for each participant.
Regional Influence on the Functional Repertoire
At this stage, we split the total functional repertoire into 2 groups: patterns that occurred in both the clinical and control participants (“shared repertoire”) and patterns that were unique to either group (“group-specific repertoire”). Then, using the Kolmogorov-Smirnov test, we compared the distributions of brain region occurrences between shared and group-specific repertoires and performed permutation testing to identify which brain regions were recruited significantly more in the group-specific repertoire than in the shared repertoire. We then tested if these occurrences were higher in the healthy or the patient group.
Multilinear Model Analysis
We then moved on to test the hypothesis that efficient brain dynamics is linked to the correct functioning of the brain, and hence, the restriction of the functional repertoire is related to disease severity and to clinical staging. To test this hypothesis, we built a multilinear model to predict clinical measures and disease staging, adding brain flexibility (as measured by the size of the functional repertoire)28 to demographic, amnestic, and clinical information. Specifically, we considered the Amyotrophic Lateral Sclerosis (ALS) Functional Rating Scale–Revised (ALSFRS-R) and the stage of the disease (King's and MiToS clinical staging systems) as dependent variables, while age, education level, sex, disease duration, phenotype, ECAS scores, and size of the functional repertoire were considered as predictors. Multicollinearity was assessed through the variance inflation factor.29 We validated our model using the k-fold cross-validation, with k = 5.30 Specifically, k iterations were performed to train our model, and at each iteration, the kth subgroup was used as a test set. The validation was also performed using leave-one-out cross-validation (LOOCV); see the Supplement (links.lww.com/WNL/C297).
Statistical Analysis
To compare age and educational level between patients with ALS and healthy controls, we performed a t-test, while Chi-square was used for sex comparison. Permutation testing or Kolmogorov-Smirnov test was performed to compare patients and controls, as appropriate. For permutation testing, the data were permuted 10,000 times, and at each iteration, the absolute value of the difference between the 2 groups was observed, building a null distribution of absolute differences. Finally, the empirical observed difference was rank-ordered against this distribution, yielding a significance value. The relationship between the size of the functional repertoire and the clinical scores was investigated in the ALS group using the Spearman correlation coefficient.
The results were corrected by the false discovery rate, across both parameters and frequency bands, and the significance level was set at p-value < 0.05. We reported the corrected significances throughout the article. All statistical analyses were performed in Matlab 2019a.
Data Availability
Data not provided in the article because of space limitations may be shared (anonymized) at the request of any qualified investigator, conditional to acceptance by the Ethical Committee. The code used is available in reference 31.
Results
Clinical and Demographic Characteristics of Patients With ALS
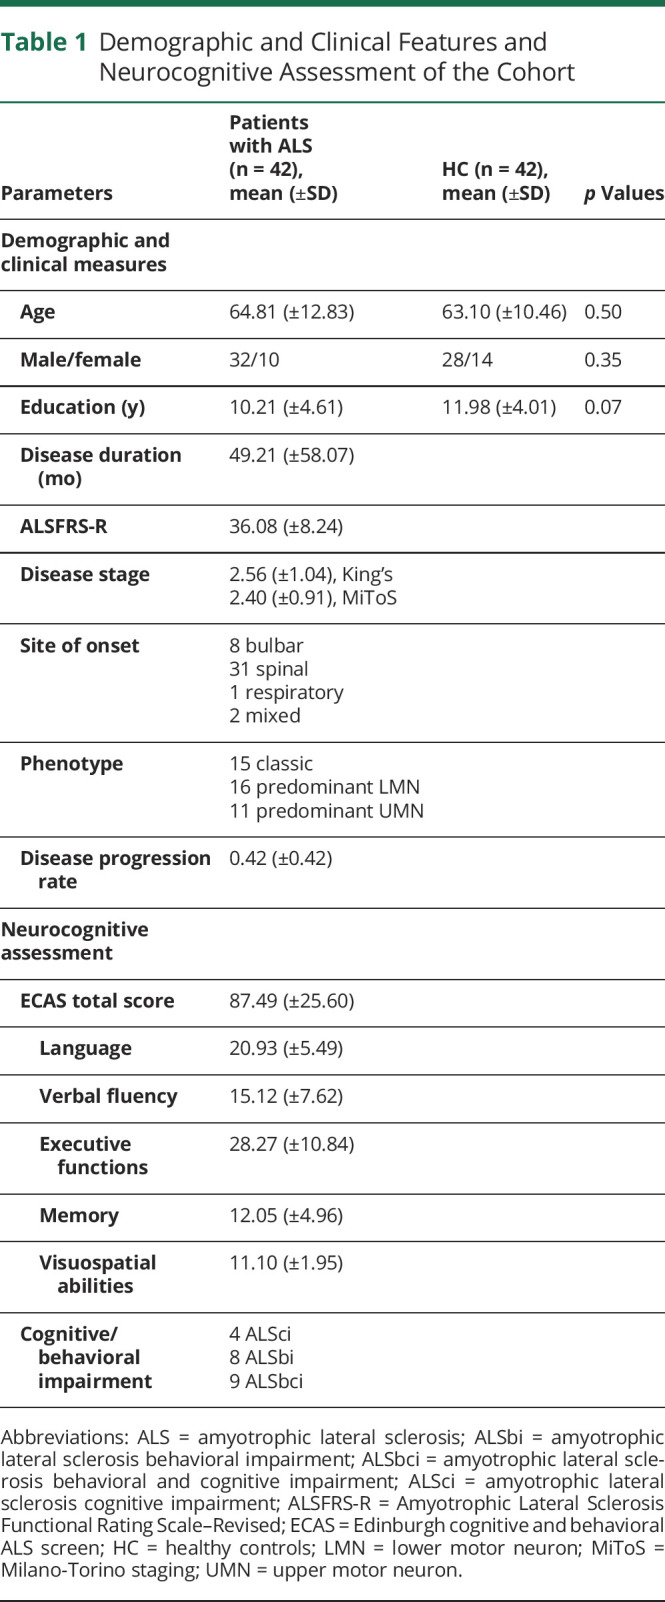
Forty-two individuals (32 males, 10 females) diagnosed with ALS according to the revised El-Escorial criteria of ALS15 and 42 healthy controls (28 males, 14 females) were enrolled in the study. We used the total ALSFRS-R32 and the ALS clinical staging systems to quantify both symptoms' severity and disease staging. Hence, patients were classified according to both the King's33 and the Milano-Torino Staging (MiToS)34 disease staging systems, which are based on the appearance of sequential clinical milestones during ALS.
According to the strong criteria for cognitive and behavioral assessment in ALS,35 4 patients had cognitive impairment, 8 patients had behavioral impairment, and 9 patients had both conditions.
Furthermore, 15 patients had a classic phenotype, 16 had lower motor neuron–dominant phenotypes (i.e., 8 patients had a “flail arm” phenotype, 6 had a “flail leg” phenotype, and 2 patients had a “pure lower motor neuron” phenotype), and 11 had a predominant upper motor neuron (UMN) phenotype.
All clinical information about the cohort, such as ALSFRS-R score, stage of the disease, ALS phenotype, site of onset, disease progression rate, and neurocognitive assessment, are reported in Table 1.
Table 1.
Demographic and Clinical Features and Neurocognitive Assessment of the Cohort
Functional Repertoire, Avalanche Patterns, and Local Dynamics
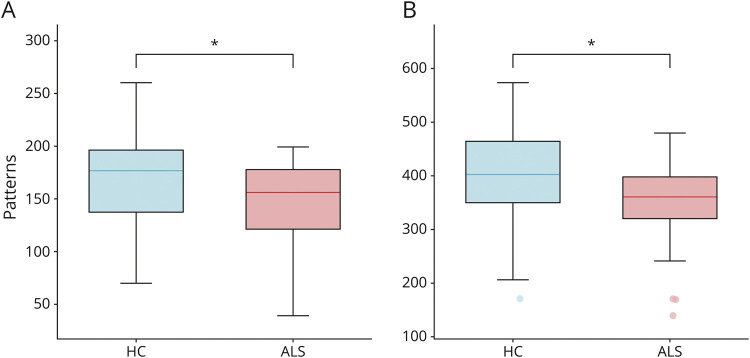
We used source-reconstructed resting-state MEG data acquired from a cohort of patients with ALS and healthy controls to quantify the functional repertoire, which is the total number of unique avalanche patterns occurred in each individual. A comparison between the 2 groups revealed that patients with ALS expressed a restricted functional repertoire, with a lower number of visited patterns. More specifically, we observed these results in both the delta (p = 0.046; Figure 2A) and the theta (p = 0.046; Figure 2B) frequency bands.
Figure 2. Comparison of the Number of Unique Avalanche Patterns.
Box plots illustrating the differences in the size of the functional repertoire in healthy controls (HC) and patients with ALS (ALS), in delta (A) and theta (B) frequency bands. The central mark in the box indicates the median, the edges of the box the 25th and 75th percentiles, and the whiskers extend to the 10th and 90th percentiles. The outliers are plotted individually using dots. Significance p-value: *p < 0.05, corrected. The figure was made using Matlab 2019a. ALS = amyotrophic lateral sclerosis.
To prove the robustness of our results to specific choices of the avalanche threshold and bin length, we tested these variables across a moderate range of values and repeated the analyses. Specifically, we first used different binnings, ranging from 1 to 5. The results remained unchanged, with patients with ALS displaying a restricted functional repertoire for all the binnings explored (for binning = 2, p = 0.009 (delta band) and p = 0.010 (theta band); for binning = 3, p = 0.010 (delta) and p = 0.012 (theta); for binning = 4, p = 0.010 (delta) and p = 0.015 (theta); for binning = 5, p = 0.011 (delta) and p = 0.019 (theta); see eTable 1, links.lww.com/WNL/C297). Furthermore, the avalanche threshold was modified, ranging from 2.5 to 3.5. For both cases, the differences between the groups were confirmed (for z = |2.5|, p = 0.028 in the delta frequency band and p = 0.030 in the theta frequency band, while for z = |3.5|, p = 0.005 and p = 0.007 in the delta and theta bands, respectively; see eTable 1).
We also evaluated how many times each active region became inactive, and vice versa (number of switches), finding no significant differences between the 2 groups (data not shown). These results confirmed that brain dynamics is qualitatively altered in patients with ALS, as compared with controls. In fact, the same number of switches means that the rate at which each region changes its status is similar in the 2 groups. Nonetheless, patients only visit a restricted number of patterns as compared with controls. Hence, the restriction of the functional repertoire is not due to different activation rates but genuinely reflects impaired flexibility.
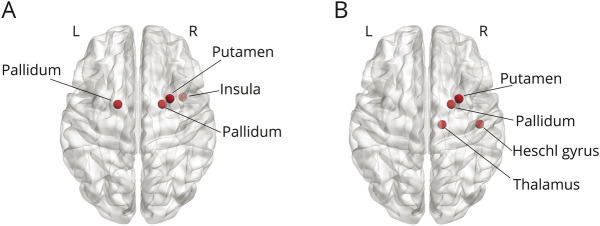
Subsequently, we investigated the influence of specific regions on avalanche patterns. First, we compared the distributions of brain region occurrences between shared and group-specific patterns. The Kolmogorov-Smirnov test confirmed that the 2 distributions were significantly different (p < 0.001), meaning that there was an uneven involvement of brain regions in the avalanches of the 2 groups. Hence, we conducted a post hoc analysis through a permutation test to identify which brain areas occurred more often in the group-specific patterns. The analysis highlighted several brain regions occurring significantly more in the group-specific repertoire than in the shared repertoire (Figure 3). In particular, in the delta frequency band, the right insula (p = 0.011), the right putamen (p = 0.023), and the pallidum bilaterally (p = 0.034 and p = 0.049, right and left, respectively) were more often involved in avalanches in the ALS group than in the controls (Figure 3A). Similarly, in the theta band, the right Heschl's gyrus (p = 0.025), the right putamen (p = 0.031), the right pallidum (p = 0.011), and the right thalamus (p = 0.045) occurred mainly in the ALS-specific repertoire (Figure 3B).
Figure 3. Mapping of Brain Regions Occurring Significantly More in the ALS-Specific Unique Avalanche Patterns.
In particular, in the delta frequency band (A), the right insula (p = 0.011), the right putamen (p = 0.023), and the pallidum bilaterally (p = 0.034 and p = 0.049, right and left, respectively) are more often involved in avalanches in the ALS group than in the controls. Similarly, in the theta band (B), the right Heschl's gyrus (p = 0.025), the right putamen (p = 0.031), the right pallidum (p = 0.011), and the right thalamus (p = 0.044) occur mainly in the ALS-specific repertoire. Significance was set as p < 0.05. The image was made using Matlab 2019a, including BraiNetViewer v. 1.62. ALS = amyotrophic lateral sclerosis.
Multilinear Model Analysis
Subsequently, to understand the clinical significance of the restricted functional repertoire observed in patients with ALS, we correlated the size of the functional repertoire with the ECAS total score, the ALSFRS-R, and both the King's and the MiToS clinical staging systems.
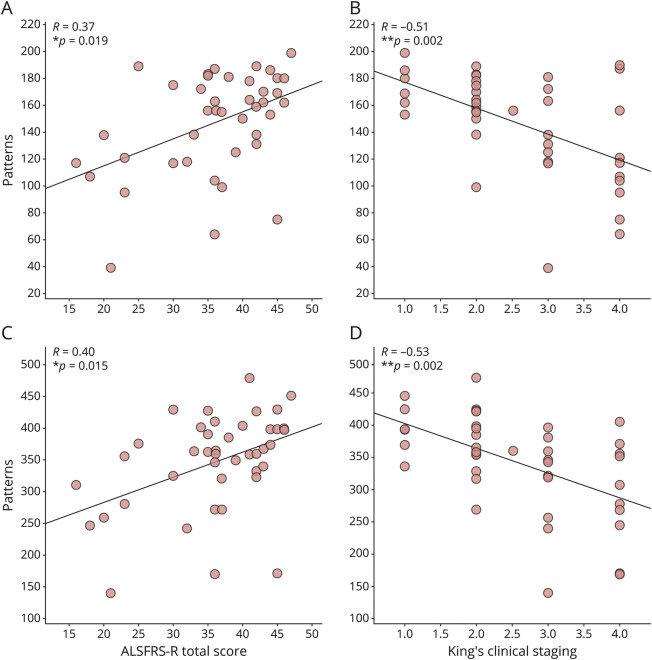
We observed significant correlations between the size of the functional repertoire and the clinical features in both the delta and the theta frequency bands. Particularly, in the delta band, the larger the functional repertoire, the lower the clinical impairment, as measured by the ALSFRS-R (R = 0.37, p = 0.019; Figure 4A), and the better the clinical staging, as measured by both the King's (R = −0.51, p = 0.002; Figure 4B) and the MiToS (R = −0.41, p = 0.015; eFigure 1A, links.lww.com/WNL/C297) disease staging systems. Similar results were observed in the theta frequency band, where the number of avalanche patterns was larger in the least-compromised patients (correlation with ALSFRS-R: R = 0.40, p = 0.015; Figure 4C), and smaller in more advanced patients, again as measured by the King's (R = −0.53, p = 0.002; Figure 4D) and the MiToS (R = −0.47, p = 0.005; see eFigure 1B) staging systems. These results could also be observed in the theta frequency band, where the number of avalanche patterns correlated positively with the ALSFRS-R (R = 0.40, p = 0.015; Figure 4C) and negatively with the King's (R = −0.53, p = 0.002; Figure 4D) and the MiToS (R = −0.47, p = 0.005; see eFigure 1B) staging systems. Conversely, there were no significant correlations between the number of avalanche patterns and the ECAS total score, neither in the delta band (R = 0.16, p = 0.30) nor in the theta band (R = 0.14, p = 0.39) (data not shown).
Figure 4. Relationship Between Brain Dynamics and Clinical Features in the ALS Group in the Delta (A and B) and the Theta (C and D) Frequency Bands.
(A) Positive correlation between the number of unique avalanche patterns and the ALSFRS-R (R = 0.37, p = 0.019) and (B) negative correlation between the number of patterns and the King's clinical staging system (R = −0.51, p = 0.002) in the delta band; (C) Positive correlation between the number of unique avalanche patterns and the ALSFRS-R (R = 0.40, p = 0.015) and (D) negative correlation between the number of patterns and the King's clinical staging system (R = −0.53, p = 0.002) in the theta band. The Spearman correlation coefficient was used, and the results were corrected by false discovery rate (FDR) correction. Significance p-values: *p < 0.05, **p < 0.01. The figure was made using Matlab 2019a. ALS = amyotrophic lateral sclerosis.
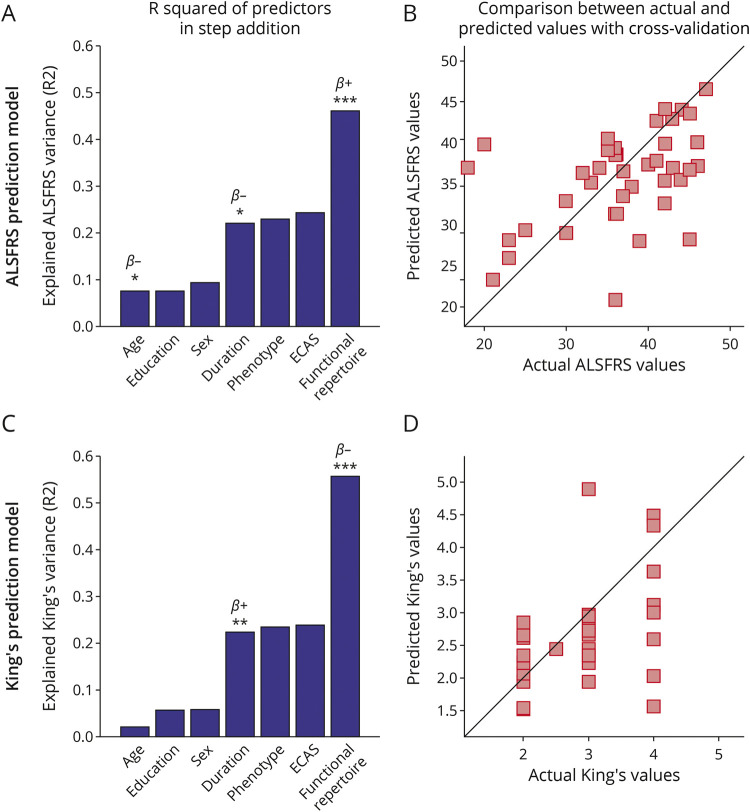
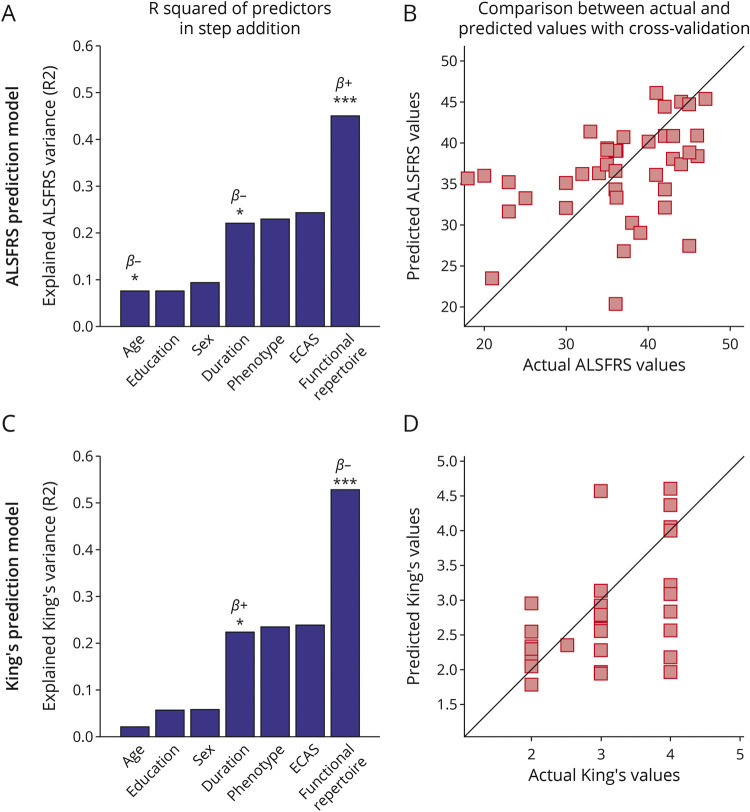
Then, we used a multilinear model analysis with k-fold cross-validation to evaluate if demographics, clinical, and brain dynamics features could predict the ALSFRS-R and the disease stage. We found that the size of the functional repertoire significantly improves the predictive capacity of the model in both the delta and the theta frequency bands (Figures 5 and 6).
Figure 5. Multilinear Model With k-Fold Cross-validation in the Delta Frequency Band.
Using as predictors age, education, sex, disease duration, ALS phenotype, ECAS, and the size of the functional repertoire, the model predicts (A and B) the ALSFRS-R (age: p = 0.038, β = −0.23; disease duration: p = 0.020, β = −0.05; functional repertoire: p < 0.001, β = 0.11); (C and D) the King's clinical staging system (disease duration: p < 0.01, β = 0.01; functional repertoire: p < 0.001, β = −0.02). In (A and C), the explained variance of the variable to be predicted as a function of the predictors is illustrated. Significant predictors are indicated by asterisks; positive and negative coefficients are illustrated with β+ and β−, respectively; significance p-values: *p < 0.05, **p < 0.01, ***p < 0.001. In (B and D), scatter plots of the comparison between actual and predicted values are reported. The figure was made using Matlab 2019a. ALS = myotrophic lateral sclerosis; ECAS = Edinburgh Cognitive and Behavioural ALS Screen
Figure 6. Multilinear Model With k-Fold Cross-validation in the Theta Frequency Band.
Using as predictors' age, education, sex, disease duration, ALS phenotype, ECAS, and the size of the functional repertoire, the model predicts (A and B) the ALSFRS-R (age: p = 0.024, β = −0.25; disease duration: p = 0.041, β = −0.04; functional repertoire: p < 0.001, β = 0.05); (C and D) the King's clinical staging system (disease duration: p = 0.024, β = 0.01; functional repertoire: p < 0.001, β = −0.01). In (A and C), the explained variance of the variable to be predicted as a function of the predictors is illustrated. Significant predictors are indicated by asterisks; positive and negative coefficients are illustrated with β+ and β−, respectively; significance p-values: *p < 0.05, ***p < 0.001. In (B and D), scatter plots of the comparison between actual and predicted values are reported. The figure was made using Matlab 2019a. ALS = myotrophic lateral sclerosis; ECAS = Edinburgh Cognitive and Behavioural ALS Screen.
In the delta band, the model provided significant predictions of the ALSFRS-R (Figure 5, A and B, R2 = 0.46), and both the King's (Figure 5, C and D, R2 = 0.56) and the MiToS (eFigure 2 A, B, links.lww.com/WNL/C297, R2 = 0.52) clinical staging systems. Similarly, in the theta band, the ALSFRS-R (Figure 6 A, B, R2 = 0.45), and both the King's (Figure 6, C and D, R2 = 0.53) and the MiToS (eFigure 2 C, D, R2 = 0.50) staging systems were predicted. The comparison between actual and predicted values obtained through the k-fold validation method30 is shown in the panels B and D of both Figures 5 and 6, while the residual distribution is shown in eFigure 3 (delta band) and eFigure 4 (theta band), in the Supplement. No significant contribution of education level, sex, ALS phenotype, and ECAS was observed.
We also validated our model using the LOOCV approach. The results were confirmed in both the delta (eFigures 5, 6, 7 in the Supplement, links.lww.com/WNL/C297) and the theta (eFigures 6, 8, 9 in the Supplement) frequency bands.
Discussion
In this work, we set out to predict clinical impairment in ALS from the flexibility of brain dynamics (i.e., reduced functional repertoire). Our results showed that patients with ALS have a restricted functional repertoire as compared with healthy controls. This was demonstrated by the lower number of distinct (i.e., unique) avalanche patterns. The size of the functional repertoire correlated directly with the ALSFRS-R and negatively with both the King's and the MiToS clinical staging systems.
It has been proposed that the healthy brain operates in a regime that maximizes flexibility, thereby facilitating adaptive behavior. The brain in ALS might be operating in a suboptimal dynamical regime, resulting in more stereotyped activity. We borrow from statistical mechanics the concept of neuronal avalanches: fast, aperiodic bursts of activations that spread across the whole brain.11 If the brain is operating in a regime that allows flexible activity, neuronal avalanches efficiently reconfigure themselves over time.26 The restriction of the functional repertoire observed in patients with ALS might reflect the effect of pathophysiologic processes on the large-scale brain dynamics, as previously observed in other neurodegenerative diseases.12,36
Our results were specific to the delta and the theta frequency bands. However, alterations in regional power or static functional connectivity have been described in all frequency bands.37,38 Ours is the first M/EEG study directly addressing the dynamic, aperiodic, scale-free activity in ALS. Hence, on the one hand, comparing our results with previous results, that were based on power spectra or static connectivity, is not trivial. On the other hand, preliminary evidence from fMRI shows altered low-frequency brain dynamics in ALS,39 which corroborates our results (given the comparable time scales). However, comparing the results should be performed cautiously.
To test whether some brain regions were specifically important in determining pathologic patterns of activity, we analyzed shared and group-specific avalanche patterns. We classified avalanche patterns either as shared, if they occurred in both groups, or as group-specific, if they occurred in either group. Our results highlighted several brain regions being recruited significantly more often in ALS-specific neuronal patterns. In particular, basal ganglia were more often involved in group-specific patterns, in both the delta and the theta frequency bands. This finding may suggest the key role of subcortical regions in the coherent recruitment of cortical areas40 and the association between the altered functioning of these regions and the cognitive and behavioral deficits in ALS,41,42 Finally, it corroborates the wide-spread involvement on the brain in ALS.43
Subsequently, we reasoned that if the functional repertoire is capturing a pathophysiologic process, then it should be related to the stage of the disease and, in turn, allow its prediction. We found, as said, a positive correlation with the ALSFRS-R and a negative correlation with both the King's and the MiToS clinical staging systems. Our findings might be framed within the hypothesis that the neuropathologic mechanisms in ALS shift the operational regime of the brain to a (presumably) suboptimal state that no longer allows sufficient flexibility to support correct behavior, thereby relating to disability and staging (as measured by the ALSFRS-R). Consistent with our work, time-resolved approaches showed that reduced temporal variability in ALS relates to disease severity.44
Using a multilinear model analysis, we showed that the size of the functional repertoire is a significant predictor of both clinical staging and impairment, even after accounting for age, education, gender, disease duration, phenotype, and ECAS. This supports the hypothesis that pathophysiologic mechanisms impair brain flexibility, which could then be used as a noninvasive readout.
Our work straightforwardly characterizes qualitative alterations of the whole-brain dynamics. This framework is mathematically grounded linking microscopic mechanisms to changes observed in the data. Hence, in the framework of personalized medicine, it might be possible to use our approach to tailor large-scale mechanistic models to the individual patients. However, to this end, longitudinal studies are warranted. Furthermore, despite the lower spatial resolution, neuronal avalanches can be observed using EEG, which might allow the application of our methodology on a wider scale.
In conclusion, our work shows that (1) pathophysiologic changes in ALS are reflected in reduced flexibility and, possibly, less effective large-scale communication; (2) subcortical regions contribute to brain dynamics and are affected by the pathophysiologic processes of ALS (however, we found these regions from a post hoc analysis that was not corrected for multiple comparison, and this finding should be regarded as merely explorative); and (3) the reduction of flexibility in ALS predicts disease stage and clinical impairment.
Glossary
- ALS
amyotrophic lateral sclerosis
- ALSFRS-R
Amyotrophic Lateral Sclerosis Functional Rating Scale-Revised
- ECAS
Edinburgh Cognitive and Behavioural ALS Screen
- LOOCV
leave-one-out cross-validation
- MEG
magnetoencephalography
- MiToS
Milano-Torino Staging
- ROIs
Regions of Interest
Appendix. Authors

Study Funding
This study was funded by University of Naples Parthenope within the Project “Bando Ricerca Competitiva 2017” (D.R. 289/2017) (G.S.), by University of Naples “Parthenope” within the Project “Ricerca Locale, 2018” (G.S.), by the European Union's Horizon 2020 Research and Innovation Program under grant agreement No. 945539 (SGA3) Human Brain Project (VJ, PS), and by grant agreement No. 826421 Virtual Brain Cloud (V.J., P.S.). L.L. Gollo was funded by NHMRC-ARC fellowship ID: APP1110975.
Disclosure
The authors report no relevant disclosures. Go to Neurology.org/N for full disclosures.
References
- 1.Prado LdeGR, Rocha NP, de Souza LC, et al. Longitudinal assessment of clinical and inflammatory markers in patients with amyotrophic lateral sclerosis. J Neurol Sci. 2018;394:69-74. doi: 10.1016/j.jns.2018.08.033 [DOI] [PubMed] [Google Scholar]
- 2.Salameh JS, Brown RH Jr, Berry JD. Amyotrophic lateral sclerosis. In: Seminars in Neurology Vol 35. Thieme Medical Publishers; 2015:469-476. [DOI] [PubMed] [Google Scholar]
- 3.D'Angelo E, Wheeler-Kingshott CG. Modelling the brain: elementary components to explain ensemble functions. La Riv Del Nuovo Cim. 2017;40(7):297-333. [Google Scholar]
- 4.Sorrentino P, Rucco R, Jacini F, et al. Brain functional networks become more connected as amyotrophic lateral sclerosis progresses: a source level magnetoencephalographic study. Neuroimage Clin. 2018;20:564-571. doi: 10.1016/j.nicl.2018.08.001 [DOI] [PMC free article] [PubMed] [Google Scholar]
- 5.Tagliazucchi E, Balenzuela P, Fraiman D, Chialvo DR. Criticality in large-scale brain fMRI dynamics unveiled by a novel point process analysis. Front Physiol. 2012;3:15. doi: 10.3389/fphys.2012.00015 [DOI] [PMC free article] [PubMed] [Google Scholar]
- 6.Rabuffo G, Fousek J, Bernard C, Jirsa V. Neuronal cascades shape whole-brain functional dynamics at rest. eNeuro. 2021;8(5):ENEURO.0283-21.2021. doi: 10.1523/ENEURO.0283-21.2021 [DOI] [PMC free article] [PubMed] [Google Scholar]
- 7.Liégeois R, Li J, Kong R, et al. Resting brain dynamics at different timescales capture distinct aspects of human behavior. Nat Commun. 2019;10(1):1-9. doi: 10.1038/s41467-019-10317-7 [DOI] [PMC free article] [PubMed] [Google Scholar]
- 8.Deco G, Jirsa VK, McIntosh AR. Emerging concepts for the dynamical organization of resting-state activity in the brain. Nat Rev Neurosci. 2011;12(1):43-56. doi: 10.1038/nrn2961 [DOI] [PubMed] [Google Scholar]
- 9.Garrett DD, Kovacevic N, McIntosh AR, Grady CL. The importance of being variable. J Neurosci. 2011;31(12):4496-4503. doi: 10.1523/JNEUROSCI.5641-10.2011 [DOI] [PMC free article] [PubMed] [Google Scholar]
- 10.Stam CJ. Use of magnetoencephalography (MEG) to study functional brain networks in neurodegenerative disorders. J Neurol Sci. 2010;289(1-2):128-134. doi: 10.1016/j.jns.2009.08.028 [DOI] [PubMed] [Google Scholar]
- 11.Sorrentino P, Seguin C, Rucco R, et al. The structural connectome constrains fast brain dynamics. eLife. 2021;10:e67400. doi: 10.7554/eLife.67400 [DOI] [PMC free article] [PubMed] [Google Scholar]
- 12.Sorrentino P, Rucco R, Baselice F, et al. Flexible brain dynamics underpins complex behaviours as observed in Parkinson's disease. Sci Rep. 2021;11(1):1-12. doi: 10.1038/s41598-021-83425-4 [DOI] [PMC free article] [PubMed] [Google Scholar]
- 13.Lopes da Silva F. EEG and MEG: relevance to neuroscience. Neuron . 2013;80(5):1112-1128. doi: 10.1016/j.neuron.2013.10.017 [DOI] [PubMed] [Google Scholar]
- 14.Baillet S. Magnetoencephalography for brain electrophysiology and imaging. Nat Neurosci. 2017;20(3):327-339. doi: 10.1038/nn.4504 [DOI] [PubMed] [Google Scholar]
- 15.Brooks BR, Miller RG, Swash M, Munsat TL. El Escorial revisited: revised criteria for the diagnosis of amyotrophic lateral sclerosis. Amyotroph Lateral Scler Other Mot Neuron Disord. 2000;1(5):293-299. doi: 10.1080/146608200300079536 [DOI] [PubMed] [Google Scholar]
- 16.Siciliano M, Trojano L, Trojsi F, et al. Edinburgh Cognitive and Behavioural ALS Screen (ECAS)-Italian version: regression based norms and equivalent scores. Neurol Sci. 2017;38(6):1059-1068. doi: 10.1007/s10072-017-2919-4 [DOI] [PubMed] [Google Scholar]
- 17.Polverino A, Rucco R, Stillitano I, et al. In Amyotrophic lateral sclerosis blood cytokines are altered, but do not correlate with changes in brain topology. Brain Connect. 2020;10(8):411-421. doi: 10.1089/brain.2020.0741 [DOI] [PubMed] [Google Scholar]
- 18.Liparoti M, Troisi Lopez E, Sarno L, et al. Functional brain network topology across the menstrual cycle is estradiol dependent and correlates with individual well‐being. J Neurosci Res. 2021;99(9):2271-2286. doi: 10.1002/jnr.24898 [DOI] [PMC free article] [PubMed] [Google Scholar]
- 19.Gross J, Baillet S, Barnes GR, et al. Good practice for conducting and reporting MEG research. Neuroimage. 2013;65:349-363. doi: 10.1016/j.neuroimage.2012.10.001 [DOI] [PMC free article] [PubMed] [Google Scholar]
- 20.Rucco R, Liparoti M, Jacini F, et al. Mutations in the SPAST gene causing hereditary spastic paraplegia are related to global topological alterations in brain functional networks. Neurol Sci. 2019;40(5):979-984. doi: 10.1007/s10072-019-3725-y [DOI] [PMC free article] [PubMed] [Google Scholar]
- 21.Oostenveld R, Fries P, Maris E, Schoffelen JM. FieldTrip: open source software for advanced analysis of MEG, EEG, and invasive electrophysiological data. Comput Intell Neurosci. 2011:156869. doi: 10.1155/2011/156869 [DOI] [PMC free article] [PubMed] [Google Scholar]
- 22.Van Veen BD, Van Drongelen W, Yuchtman M, Suzuki A. Localization of brain electrical activity via linearly constrained minimum variance spatial filtering. IEEE Trans Biomed Eng. 1997;44(9):867-880. doi: 10.1109/10.623056 [DOI] [PubMed] [Google Scholar]
- 23.Gong G, He Y, Concha L, et al. Mapping anatomical connectivity patterns of human cerebral cortex using in vivo diffusion tensor imaging tractography. Cereb Cortex. 2009;19(3):524-536. doi: 10.1093/cercor/bhn102 [DOI] [PMC free article] [PubMed] [Google Scholar]
- 24.Tzourio-Mazoyer N, Landeau B, Papathanassiou D, et al. Automated anatomical labeling of activations in SPM using a macroscopic anatomical parcellation of the MNI MRI single-subject brain. Neuroimage. 2002;15(1):273-289. doi: 10.1006/nimg.2001.0978 [DOI] [PubMed] [Google Scholar]
- 25.Brookes MJ, Woolrich M, Luckhoo H, et al. Investigating the electrophysiological basis of resting state networks using magnetoencephalography. Proc Natl Acad Sci. 2011;108(40):16783-16788. doi: 10.1073/pnas.1112685108 [DOI] [PMC free article] [PubMed] [Google Scholar]
- 26.Shriki O, Alstott J, Carver F, et al. Neuronal avalanches in the resting MEG of the human brain. J Neurosci. 2013;33(16):7079-7090. doi: 10.1523/JNEUROSCI.4286-12.2013 [DOI] [PMC free article] [PubMed] [Google Scholar]
- 27.Haldeman C, Beggs JM. Critical branching captures activity in living neural networks and maximizes the number of metastable states. Phys Rev Lett. 2005;94(5):58101. doi: 10.1103/PhysRevLett.94.058101 [DOI] [PubMed] [Google Scholar]
- 28.Shen X, Finn ES, Scheinost D, et al. Using connectome-based predictive modeling to predict individual behavior from brain connectivity. Nat Protoc. 2017;12(3):506-518. doi: 10.1038/nprot.2016.178 [DOI] [PMC free article] [PubMed] [Google Scholar]
- 29.Belsley DA, Kuh E, Welsch RE. Regression Diagnostics: Identifying Influential Data and Sources of Collinearity. Vol 571. John Wiley & Sons; 2005. [Google Scholar]
- 30.Varoquaux G, Raamana PR, Engemann DA, Hoyos-Idrobo A, Schwartz Y, Thirion B. Assessing and tuning brain decoders: cross-validation, caveats, and guidelines. Neuroimage. 2017;145:166-179. doi: 10.1016/j.neuroimage.2016.10.038 [DOI] [PubMed] [Google Scholar]
- 31.Sorrentino P. Flexibility_als (Matlab 2019a). 2022. https://github.com/pierpaolosorrentino/flexibility_als.
- 32.Cedarbaum JM, Stambler N, Malta E, et al. The ALSFRS-R: a revised ALS functional rating scale that incorporates assessments of respiratory function. J Neurol Sci. 1999;169(1-2):13-21. doi: 10.1016/s0022-510x(99)00210-5 [DOI] [PubMed] [Google Scholar]
- 33.Balendra R, Jones A, Jivraj N, et al. Estimating clinical stage of amyotrophic lateral sclerosis from the ALS Functional Rating Scale. Amyotroph Lateral Scler Front Degener. 2014;15(3-4):279-284. doi: 10.3109/21678421.2014.897357 [DOI] [PubMed] [Google Scholar]
- 34.Al-Chalabi A, Chiò A, Merrill C, et al. Clinical staging in amyotrophic lateral sclerosis: analysis of Edaravone Study 19. J Neurol Neurosurg Psychiatry. 2021;92(2):165-171. doi: 10.1136/jnnp-2020-323271 [DOI] [PMC free article] [PubMed] [Google Scholar]
- 35.Strong MJ, Abrahams S, Goldstein LH, et al. Amyotrophic lateral sclerosis - frontotemporal spectrum disorder (ALS-FTSD): revised diagnostic criteria. Amyotroph Lateral Scler Frontotemporal Degener. 2017;18(3-4):153-174. doi: 10.1080/21678421.2016.1267768 [DOI] [PMC free article] [PubMed] [Google Scholar]
- 36.Rucco R, Bernardo P, Lardone A, et al. Neuronal avalanches to study the coordination of large-scale brain activity: application to Rett syndrome. Front Psychol. 2020;11:2845. doi: 10.3389/fpsyg.2020.550749 [DOI] [PMC free article] [PubMed] [Google Scholar]
- 37.Iyer PM, Egan C, Pinto-Grau M, et al. Functional connectivity changes in resting-state EEG as potential biomarker for amyotrophic lateral sclerosis. PLoS One. 2015;10(6):e0128682. doi: 10.1371/journal.pone.0128682 [DOI] [PMC free article] [PubMed] [Google Scholar]
- 38.Dukic S, McMackin R, Costello E, et al. Resting-state EEG reveals four subphenotypes of amyotrophic lateral sclerosis. Brain. 2021; awab322. doi: 10.1093/brain/awab322 [DOI] [PMC free article] [PubMed] [Google Scholar]
- 39.Ma X, Lu F, Chen H, et al. Static and dynamic alterations in the amplitude of low-frequency fluctuation in patients with amyotrophic lateral sclerosis. PeerJ. 2020;8:e10052. doi: 10.7717/peerj.10052 [DOI] [PMC free article] [PubMed] [Google Scholar]
- 40.Goldberg JA, Rokni U, Boraud T, Vaadia E, Bergman H. Spike synchronization in the cortex-basal ganglia networks of parkinsonian primates reflects global dynamics of the local field potentials. J Neurosci. 2004;24(26):6003-6010. doi: 10.1523/JNEUROSCI.4848-03.2004 [DOI] [PMC free article] [PubMed] [Google Scholar]
- 41.Machts J, Loewe K, Kaufmann J, et al. Basal ganglia pathology in ALS is associated with neuropsychological deficits. Neurology. 2015;85(15):1301-1309. doi: 10.1212/WNL.0000000000002017 [DOI] [PubMed] [Google Scholar]
- 42.Tu S, Menke RAL, Talbot K, Kiernan MC, Turner MR. Regional thalamic MRI as a marker of widespread cortical pathology and progressive frontotemporal involvement in amyotrophic lateral sclerosis. J Neurol Neurosurg Psychiatry. 2018;89(12):1250-1258. doi: 10.1136/jnnp-2018-318625 [DOI] [PubMed] [Google Scholar]
- 43.Ahmed RM, Devenney EM, Irish M, et al. Neuronal network disintegration: common pathways linking neurodegenerative diseases. J Neurol Neurosurg Psychiatry. 2016;87(11):1234-1241. doi: 10.1136/jnnp-2014-308350 [DOI] [PMC free article] [PubMed] [Google Scholar]
- 44.Chen H, Zou Z, Zhang X, Shi J, Huang N, Lin Y. Dynamic changes in functional network connectivity involving amyotrophic lateral sclerosis and its correlation with disease severity. J Magn Reson Imaging. 2021;54(1):239-248. doi: 10.1002/jmri.27521 [DOI] [PubMed] [Google Scholar]
Associated Data
This section collects any data citations, data availability statements, or supplementary materials included in this article.
Data Availability Statement
Data not provided in the article because of space limitations may be shared (anonymized) at the request of any qualified investigator, conditional to acceptance by the Ethical Committee. The code used is available in reference 31.


