

Abstract
Background and Objectives
Duchenne muscular dystrophy (DMD) is a progressive muscle degenerative disorder with a well-characterized disease phenotype but considerable interindividual heterogeneity that is not well understood. The aim of this study was to evaluate the effects of dystrophin variations and genetic modifiers of DMD on rate and age of muscle replacement by fat.
Methods
One hundred seventy-five corticosteroid treated participants from the ImagingDMD natural history study underwent repeated magnetic resonance spectroscopy (MRS) of the vastus lateralis (VL) and soleus (SOL) to determine muscle fat fraction (FF). MRS was performed annually in most instances; however, some individuals had additional visits at 3 or 6 monthss intervals. FF changes over time were modeled using nonlinear mixed effects to estimate disease trajectories based on the age that the VL or SOL reached half-maximum change in FF (mu) and the time required for FF change (sigma). Computed mu and sigma values were evaluated for dystrophin variations that have demonstrated the ability to lead to a mild phenotype as well as compared between different genetic polymorphism groups.
Results
Participants with dystrophin gene deletions amenable to exon 8 skipping (n = 4) had minimal increases in SOL FF and had an increase in VL mu value by 4.4 years compared with a reference cohort (p = 0.039). Participants with nonsense variations within exons that may produce milder phenotypes (n = 11) also had minimal increases in SOL and VL FFs. No differences in estimated FF trajectories were seen for individuals amenable to exon 44 skipping (n = 10). Modeling of the SPP1, LTBP4, and thrombospondin-1 (THBS1) genetic modifiers did not result in significant differences in muscle FF trajectories between genotype groups (p > 0.05); however, trends were noted for the polymorphisms associated with long-range regulation of LTBP4 and THBS1 that deserve further follow-up.
Discussion
The results of this study link the historically mild phenotypes seen in individuals amenable to exon 8 skipping and with certain nonsense variations with alterations in trajectories of lower extremity muscle replacement by fat.
Duchenne muscular dystrophy (DMD) is a progressive muscle degenerative disorder with a well-characterized disease phenotype but considerable interindividual heterogeneity.1 Understanding the factors leading to disease heterogeneity can affect care planning, inform drug discovery, and explain variability in clinical trial cohorts.2 The use of corticosteroid therapy contributes to disease course changes as corticosteroids improve muscle strength, delay loss of ambulation (LOA), and reduce scoliosis development.3-5 However, nonpharmacologic factors such as dystrophin gene variations and genetic modifiers are also likely sources of disease heterogeneity.6-8
Some dystrophin variations presumed to cause DMD often lead to milder clinical phenotypes, ostensibly because of production of small amounts of dystrophin. For example, exon 3–7 deletions, exon 45 deletions, and nonsense variations within certain, often in-frame, exons can cause both DMD and Becker muscular dystrophy (BMD) phenotypes.6,7,9,10 Genetic modifiers of disease progression may also explain variability in disease progression that cannot be explained by corticosteroid use or dystrophin variations.2,8 A single-nucleotide polymorphism (SNP) in SPP1, the gene encoding osteopontin, and 4 nonsynonymous SNPs in LTBP4, which encodes latent transforming growth factor beta (TGFβ) binding protein 4, were associated with older age at LOA in some studies,11-13 but findings have not been consistently replicated.14-19 SNPs that regulate LTBP4 and thrombospondin-1 (THBS1) have also been suggested to delay age at LOA in a single study.20
Age at LOA has been the primary outcome used to assess the modifying effects of dystrophin gene variations and genetic polymorphisms on disease course; however, the ImagingDMD natural history study offers a unique opportunity to assess effects on muscle fatty accumulation, which is an objective biomarker that can be evaluated in ambulatory and nonambulatory individuals. ImagingDMD participants underwent longitudinal magnetic resonance spectroscopy (MRS) of the lower extremity muscles, with quantification of muscle fatty infiltration, expressed as a fat fraction (FF). In DMD, FF increases predictably with age and worsening disease progression.21 Therefore, the primary aim of this study was to determine the effects of different genetic modifiers of disease progression in DMD on muscle fatty replacement.
Methods
Standard Protocol Approvals, Registrations, and Participant Consents
The 2-year pilot study was approved by the Institutional Review Board at the University of Florida, and the ImagingDMD (NCT01484678) and optional biosample studies were approved by the Institutional Review Boards at each participating site (University of Florida, Oregon Health & Science University, and The Children's Hospital of Philadelphia). Written informed consent was obtained, with participants age younger than 18 years providing assent.
Study Design
The study cohort consisted of participants enrolled in the longitudinal ImagingDMD natural history study initiated in 2010 and the 2-year pilot study conducted before ImagingDMD.22 Participants in the pilot study had up to 5 study visits (baseline, 3, 6, 12, and 24 months) while participants in the ImagingDMD study visited the study site at annual intervals with a subset having additional visits because of steroid initiation or LOA. Inclusion criteria were a clinical or genetic diagnosis of DMD, symptom onset before age 5 years, and age 4–18 years at enrollment.23 Participants were excluded if they had contraindications to MR examination or other comorbid conditions affecting the skeletal muscles. Participants were not prohibited from participating in clinical trials while enrolled in the ImagingDMD study.
MRS was performed at each study visit, and DNA was collected by using skin punch biopsy, blood collection, or saliva samples from ImagingDMD participants who consented to an optional companion biosample study. Corticosteroid treatment and medication information was obtained at each visit from parent report. Here, we limited analyses to corticosteroid-treated participants because the effect of steroids on muscle FF trajectories is large, and a mixed cohort could obscure any effects related to dystrophin variations or genetic modifiers.4,24 Corticosteroid-untreated individuals were defined as participants who never took corticosteroids or those who took them <1 year before LOA and did not initiate corticosteroids before their 8th birthday.
Dystrophin Variations
Participants' dystrophin variation was determined from parent-provided laboratory genetic reports. In some cases, dystrophin variations were precisely determined through unrelated research studies, and these results were provided by participant parents. Pediatric neurologists verified the coding of each participant's variation after independent examination of genetic reports. For a subset of individuals who underwent whole-genome sequencing in an unrelated research project, the reported dystrophin variation was verified (see “Genotyping of Genetic Modifier Alleles” below). Dystrophin variation subgroups of interest were variations amenable to skipping of exons 8 and 44 and nonsense variations within specific exons. These dystrophin variants have all been shown to lead to possible disease heterogeneity and can produce both DMD and BMD phenotypes.6,7,9,10
Genotyping of Genetic Modifier Alleles
High-quality DNA extracted from participant saliva, blood, or cultured fibroblasts was used to determine the genotypes from 4 previously reported genetic modifier polymorphisms: SPP1 (rs28357094), LTBP4 (rs2302729, rs1131620, rs10880—rs1051303 inferred from rs1131620), a site upstream of LTBP4 (rs710160), and a site upstream of THBS1 (rs2725797).11,13,20 The latter 2 SNPs were discovered after the initiation of this project; therefore, only participants with extra biobanked DNA were able to be genotyped through a combination of targeted genotyping and whole-genome sequencing. This subset was random and not biased toward any specific dystrophin variation or genetic modifier.
Targeted genotyping was performed using DNA extracted from samples with the Qiagen DNeasy Blood & Tissue Kit (Qiagen 69506), GoTaq Green DNA polymerase Master Mix (Promega, Madison, WI), and primer pairs spanning genomic DNA regions containing the specific SNPs of interest. PCR amplicons were electrophoresed on 2% agarose gels, excised, gel purified, and submitted for Sanger sequencing to Eurofins Genomics for SNP genotype confirmation.
As mentioned, a subset of participants underwent whole-genome sequencing for an unrelated research project, and for the purposes of this study, the results of the sequencing were used to determine rs2725797 (THBS1) and rs710160 (LTBP4) genotypes. The sequencing was also used to verify LTBP4 haplotypes and dystrophin variations for those participants. Sequencing libraries were prepared using Illumina's TruSeq DNA PCR-Free Library Prep Kit (Illumina 20015963), and samples were whole-genome sequenced using 100 x 100 paired end reads on an Illumina HiSeq X 10 system at the Human Longevity Institute at the University of California, Los Angeles. The mean coverage was 35X. FASTQ files were aligned to GRCh38 with no alternate contigs using BWA version 0.7.17. All variant identification steps proceeded through Genome Analysis Took Kit Best Practices Workflow.25 Duplicates were marked using MarkDuplicatesSpark, followed by Base Score Quality Recalibration. Variants were called using HaplotypeCaller, followed by Variant Quality Score Recalibrator. All steps were performed using GATK 4.1.2. No samples were removed because of sequencing quality. ANNOVAR (release Nov2019) was used to annotate recalibrated VCF files for gnomAD v3.1 allele frequency, segmental duplications, SIFT, ClinVar, RefSeq, and Ensembl features. THBS1 and LTBP4 phased genotypes were obtained from the final VCFs using bcftools. LTBP4 haplotypes were identified by phasing the data using EAGLE version 2.4.1 using 1,000 Genomes phase 3 final call set. Exonic DMD variations were confirmed by inspection of aligned BAM files to identify exon loss or duplication. DMD nonsense variations were identified from ANNOVAR annotations of VCF files by searching for ANNOVAR annotations of stop gain or frameshifting variants within the DMD locus. These variations were compared with participant-reported variations, and in 2 cases, WGS clarified precise exon deletion locations.
Muscle FF Modeling
Single-voxel 1H MRS-derived muscle FF was determined from the vastus lateralis (VL) in the thigh and soleus (SOL) in the calf. Detailed methods for data acquisition and analysis have been described previously.21,26 Spectra were obtained using a stimulated echo acquisition mode sequence with pulse repetition time (TR) = 3,000ms, echo time (TE) = 108ms, and 7–16 acquisitions. Spectra were integrated to determine fat and water signal intensities (SI), which were corrected for T1 and T2 relaxation effects,21 and FF was defined as SIfat/(SIfat + SIwater). All analyses were automated using custom Interactive Data Language software (version 8.8, L3Harris Geospatial, Denver, CO) and reviewed for quality control.
To estimate the trajectory of FF progression over time, each participant's MRS FF data from all study visits were modeled using nonlinear mixed effects (NLMEs) as previously described.24 The mean MRS FF for each individual at age t, FF(t) was specified as follows:
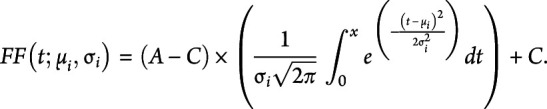 |
In the model, the fixed effects were A, the maximal value of the MRS FF (0.90), and C, the FF minimum value (0.0235).24 The estimated FF trajectories for each participant were determined by the parameters mu (µi) and sigma (σi). Mui is the age for participant i when a muscle is estimated to reach half-maximum change in FF. A smaller mu value is indicative of earlier disease progression. Sigmai is the time constant of FF progression for participant i and is reflective of the steepness of the FF trajectory at mu, a smaller sigma value indicates faster disease progression by a steeper FF curve slope at mu. Three subgroups had poor fits with NLMEs modeling secondary to limited disease progression. Muscle FF trajectories for these groups were modeled using a linear random effects model with a fixed and random intercept.
Statistical Analyses
Individual and population level FF trajectories were modeled and fit in RStudio (version 1.1.456) using the NLME, plyr, and ggplot2 packages, and goodness of fit plots were used for visual confirmation of model accuracy. For each group's modeled FF trajectory, the estimates of the parameters mu and sigma are reported. Differences in estimated mu and sigma values between variation or modifier groups were tested by including group assignment as a covariate for mui and sigmai in the NLMEs model. The Akaike information criterion (AIC) was used to select between linear and nonlinear modeling as needed. Multiple comparisons were accounted for by using the Holm-Sidak correction, and significance for corrected p values was set at p < 0.05. GraphPad Prism (Version 8.0.1, San Diego, CA) was used for data visualization and figure creation.
Data Availability
Anonymized data published within this manuscript can be requested by submitting a formal application to Dr. Krista Vandenborne, and instructions for requests have been detailed on the website imagingdmd.org. All data requests will be reviewed by the study executive committee, which comprises the study principal investigators and key study personnel.
Results
Among the 205 individuals enrolled in one or both included studies, 175 were corticosteroid treated. This includes n = 16 who participated only in the pilot natural history study, n = 17 who participated in the pilot and ImagingDMD studies, and n = 142 who were enrolled only in the ImagingDMD study (Figure 1). The mean age at enrollment was 8.7 years (standard deviation = 2.7 years), and the mean age at last visit was 13.6 (±3.7) years. Although many participants were still ambulatory at their most recent study visit, age at LOA was known for n = 77 with a mean age of 13.3 years. Twenty-five percent of participants took a conditionally approved drug at some point during the study; however, no statistical comparisons were made between treated and untreated individuals because this study was initiated before any drug approval and was not designed or powered to evaluate drug effects. Participants had a range of 1–16 MR data points (median = 6) for modeling of muscle FF. Among the entire corticosteroid-treated cohort, FF modeling estimated a mean age for SOL half-maximum ΔFF of 17.1 years and a mean age for VL half-maximum ΔFF of 12.9 years (Table 1).
Figure 1. Study Flow Diagram.

Overall, there were 175 corticosteroid-treated participants included in this study. Of those participants, the dystrophin variation was known for 169. Exonic deletions were the most common variations in the cohort, followed by nonsense variations. N = 143 participants consented to DNA collection to evaluate genetic modifier polymorphisms. After removing individuals with exon 3–7 mutations, exon 45 deletions, and nonsense variations that can produce DMD or BMD phenotypes, there were N = 125 participants included for analysis. All of these participants were genotyped for LTBP4 and SPP1 polymorphisms while a subset with additional DNA were also genotyped for rs710160 upstream of LTBP4 and rs272577 upstream of THBS1. Abbreviations: BMD = Becker muscular dystrophy; DMD = Duchenne muscular dystrophy; THBS1 = thrombospondin-1.
Table 1.
Effect of Dystrophin Variation on Disease Progression

Dystrophin Variations and Effects on FF Trajectory
Primary genetic variation reports were obtained from 169 of the corticosteroid-treated participants. Overall, 63% had exonic deletions, 8% had exonic duplications, and 29% had point or other small variations (Figure 1). There was slight enrichment of individuals with nonsense variations (18%) and deletions amenable to exon 51 skipping (15%) secondary to recruiting from early clinical trials. Using FF modeling, we identified participants with the slowest disease progression, defined here as individuals with the oldest ages at muscle half-maximum fat replacement, and evaluated their dystrophin variations. The 5 highest estimated VL and SOL mu values came from individuals with a splice site variation (IVS20-1, G>T), nonsense variation in exon 6 (c.440C>G), nonsense variation in exon 34 (c.4735G>T), an exon 46–52 deletion, 2 exon 45 deletions, and an exon 52 deletion (Figure 2, A and B). The individual with the splice site variation was rediagnosed as having BMD after participation in the study based on his slow clinical progression, despite having a genotype and biopsy suggestive of DMD. An individual with an exon 3–7 deletion had the next slowest disease progression for the SOL and VL. These results were consistent with functional status because only 2 individuals had lost the ability to walk (mean age = 15.2 years), and the rest were ambulatory at their last study visit (mean age = 19.7 years). Figure 2, C and D shows T1-weighted thigh MRIs from an individual representative of the whole cohort for age at half-maximum VL ΔFF and the slow progressor with the exon 34 nonsense variation at the same age.
Figure 2. Dystrophin Variations Associated With Slowly Progressing Individuals.

When modeling disease trajectory for the entire cohort, the identified individuals had the largest mu values indicating older ages at (A) SOL and (B) VL half-maximum ΔFF. Their individual trajectories were right shifted compared with the overall cohort (black dashed line). These slowly progressing individuals had a variety of dystrophin variations including some associated with milder phenotypes and others associated with typical DMD phenotypes. (C) A T1-weighted image of the thigh from an individual with disease progression typical of the whole cohort compared with (D) the thigh of the slow progressor with the PSC in exon 34, at the same age (∼13 years). Abbreviations: DMD = Duchenne muscular dystrophy; DEL = deletion; FF = fat fraction; PSC = premature stop codon; SOL = soleus; VL = vastus lateralis.
Next, muscle FF trajectories were evaluated for 3 variation subgroups that are known to produce both DMD and BMD phenotypes. The exon 8 skippable subgroup comprised 3 individuals with exon 3–7 deletions and one with an exon 6–7 deletion. Because very little (if any) progression occurred in the SOL muscle with FFs only slightly above control values,27 a linear random effects model was fit for the SOL. AIC criteria indicated a better fit for the separate models (NLME for cohort + linear mixed effects for exon 8 skippable group) vs using a single NLME for the entire cohort, demonstrating differences between groups (Table 1 and Figure 3A). The exon 8 skippable group also had a large VL FF trajectory curve shift toward slower disease progression with an age at half-maximum ΔFF of 18.1 years, and this reached significance (p = 0.0390) (Figure 3B). Eleven individuals had PSCs in exons that have previously been shown to sometimes lead to a BMD phenotype (exons 21, 26, 27, 38, 39, and 41).9,10 Again, because a minimal increase in FF occurred, AIC criteria indicated the PSC group was better modeled using a linear random effects model leading to differences in trajectories for both SOL and VL FF compared with participants not in the PSC group (Figure 3, C and D).
Figure 3. FF Modeling of Variations Amenable to Exon 8 Skipping and Nonsense Variations.

Individuals with dystrophin variations amenable to exon 8 skipping had significantly slower disease progression by (A) SOL and (B) VL muscle FF modeling (blue lines) than the rest of the ImagingDMD cohort (dashed black line). Individual trajectories of muscle FF for each participant (gray lines) demonstrate almost no increase in SOL muscle FF over time and increases in VL FF that occur later than typically expected. Similarly, modeling of (C) SOL and (D) VL muscle FF trajectories in individuals with premature stop codons within exons that have been shown to potentially produce a milder phenotype showed significantly slowed disease progression. (8 Skips = individuals with variations amenable to exon 8 skipping. Abbreviations: DMD = Duchenne muscular dystrophy; FF = fat fraction; PSC = premature stop codons, SOL = soleus, VL = vastus lateralis.
The exon 44 skippable subgroup comprised N = 6 with exon 45 deletions, N = 3 with exon 43 deletions, and N = 1 with an exon 37–43 deletion. There were no differences in mu or sigma values in the exon 44 skippable subgroup compared with all other variations; however, individual analysis demonstrated highly variable trajectories (Table 1 and Figure 4, A and B). Plots of each individual's estimated modeled trajectory shows that those with exon 43 or 37–43 deletions did not have slower disease progression; however, 2 of the individuals with exon 45 deletions had slower progression, consistent with prior literature (Figure 4, C and D).7
Figure 4. FF Modeling of Variations Amenable to Exon 44 Skipping.

(A and B) The modeled SOL and VL FF trajectories for the individuals amenable to exon 44 skipping (blue lines) did not differ significantly from modeled trajectories from the remainder of the cohort (black dashed line). Actual FF trajectories from the individual participants with variations amenable to exon 44 skipping (gray lines) showed variability; therefore, the modeled trajectories for each individual were plotted separately for the SOL (C) and VL (D). Two individuals with exon 45 deletions had trajectories that visually appeared to deviate from the rest while the remaining individuals with variations amenable to exon 44 skipping had trajectories typical of DMD. Abbrebiations: 44 skips = individuals amenable to exon 44 skipping; DMD = Duchenne muscular dystrophy; DEL = deletion; FF = fat fraction, SOL = soleus, VL = vastus lateralis.
Genetic Polymorphisms and Effects on Muscle Fatty Infiltration
DNA was isolated from 143 steroid-treated individuals for targeted SPP1 and LTBP4 genotyping. After removing participants with variations that can lead to BMD phenotypes (exon 8 skippable, exon 44 skippable, and certain nonsense variations) and the participant rediagnosed with BMD, there were 129 remaining DNA samples. For SPP1, there was no difference in SOL or VL mu values for modeled FF trajectories between those with and without the G allele (Table 2 and Figure 5A) nor were there differences in estimated sigma values. Similarly, we did not find any differences in SOL or VL modeling parameters between individuals homozygous for the IAAM haplotype of LTBP4 (Figure 5B).
Table 2.
Effect of Genetic Modifiers on Age at LOA and Disease Progression

Figure 5. Modifying Effects of Genetic Polymorphisms.

(A) There was no modifying effect of SPP1 genotype SOL or VL fat fraction modeled trajectories. (B) Similarly, no significant modifying effect was observed for LTBP4 genotype. (C) For rs710160 (LTBP4) and (D) rs272579 (THBS1), there were no significant differences in mu or sigma parameters between genotype groups; however, there were small absolute changes in parameters that may warrant further investigation. In the figure, the blue trajectories indicate the genotype previously associated with older age at loss of ambulation while the red trajectories indicate the genotype previously associated with younger age at loss of ambulation. Abbrebiations: THBS1 = thrombospondin-1; VL = vastus lateralis.
The rs710160 (LTBP4) and rs272577 (TBHS1) polymorphisms were identified after the initiation of this study; however, there was enough biobanked DNA to genotype n = 119 for rs710160 and n = 75 for rs2725797. For rs710160, there was a 1.4 and 1.9 years difference in mu values for the VL and SOL, respectively; however, differences in trajectory parameters did not reach significance between allele groups (Figure 5C). For THBS1, only 3 individuals were homozygous for the minor T allele; therefore, estimating FF trajectories was not possible with the recessive model used in the original modifier discovery study20 or an additive model. We opted to evaluate THBS1 using a dominant model with cautious interpretation of the results. The modeled trajectories showed a nonsignificant shift to the left for the TT and TC allele group (Figure 5D).
Discussion
We took advantage of the large and well-characterized ImagingDMD natural history cohort to evaluate the effects of specific dystrophin variations and genetic modifiers on disease progression. This cohort offered the unique opportunity to assess genotype-phenotype effects on a biomarker of muscle pathology itself, MRS-derived muscle FF. The results revealed disparate rates of FF accumulation among individuals with exonic deletions amenable to exon 8 skipping and certain nonsense variations that lead to both DMD and BMD phenotypes. In addition, based on trends observed in modifying effects of rs710160 (LTBP4) and rs2725797 (THBS1) polymorphisms, we recommend further evaluation of these polymorphisms in larger cohorts.
For primary dystrophin variations, previous work has demonstrated slower disease progression (BMD or mild DMD) in some individuals with exon 3–7 deletions (amenable to exon 8 skipping), exon 45 deletions (amenable to exon 44 skipping), and some nonsense variations, mostly within in-frame rod domain exons.6,7,9,10 Prior studies primarily used age at LOA or clinical examination to define slower disease progression. Here, we evaluated changes in disease progression measured by MRS-derived muscle FF for each of these 3 groups. FF modeling suggested that individuals amenable to exon 8 skipping indeed have slower disease progression and slowed rates of leg muscle fat infiltration. Exon 3–7 variations are known exceptions to the reading frame rule,6,28,29 and it was demonstrated in cultured myotubes that some individuals with exon 3–7 deletions have endogenous skipping of exon 8, putting the variation back in-frame.7 We hypothesize an individual with an exon 6–7 deletion in this cohort could also have endogenous exon 8 skipping. Previous work from our laboratory group has demonstrated that corticosteroids lead to approximately a 1-year increase in mu values in the VL and a 5-year increase in mu values in the SOL.24 Of note is that alterations in disease trajectory seen in individuals with variations amenable to exon 8 skipping exceeded the magnitude of effect caused by corticosteroid treatment.24
Nonsense variations causing premature stop codons are predicted to result in DMD; however, in some rare cases, they may lead instead to a BMD phenotype. Most, but not all, cases of BMD due to nonsense variations occur within in-frame exons, and it has been shown that those exons may be skipped, possibly because of exonic splicing enhancer motif destruction or exonic splicing suppressor motif creation, leading partial dystrophin production.9,10,30 Eleven participants in this cohort had nonsense variations within exons that have been reported to sometimes lead to BMD phenotypes, and all 11 were included in the analysis regardless of presenting phenotype. This subgroup had significantly better trajectory fits with linear random effects modeling because of very limited increases in muscle FF, demonstrating they had slower disease progression than the cohort in general. Of note, only 3 of the 11 participants were confirmed to be taking ataluren during the study; therefore, we do not attribute these changes in disease trajectory to ataluren use.
We did not observe significant FF trajectories alterations in the exon 44 skippable subgroup, which contrasts with past research.6,7,31,32 Individuals with exon 45 deletions, in particular, have had small amounts of dystrophin present on immunohistochemistry32 and demonstrated endogenous exon 44 skipping, restoring the reading frame.7 Only 6/10 individuals amenable to exon 44 skipping in this study had an exon 45 deletion; therefore, we may have been underpowered to detect effects. However, when we examined the slowest progressors of the whole cohort using FF modeling, 2 individuals with exon 45 deletions had among the slowest VL and SOL fatty infiltration.
With respect to genetic modifiers of disease progression, we evaluated modeled muscle FF trajectories for polymorphisms in SPP1, LTBP4, and THBS1. SPP1, the gene encoding osteopontin, was the first identified modifier of disease progression in DMD.11 Individuals with a G allele (TG or GG genotype) at rs28357094 in the promotor region had earlier age at LOA, decreased grip strength, and faster 6 minute walk test decline compared with those with a TT genotype;11,12,15 however, this finding has not been consistently replicated.14,16 Osteopontin is a cytokine associated with fibrotic and inflammatory processes whose level of expression can influence the phenotype of dystrophic muscle in preclinical DMD models.33 However, the proposed mechanism causing differential effects between rs28357094 allele groups is still being investigated.2 Similar to other groups, we were unable to replicate the protective effect of the homozygous T allele when comparing VL and SOL FF trajectories. It has been suggested that the SPP1 polymorphism may only be important in corticosteroid-treated individuals15; however, all participants included here were corticosteroid treated, so this does not account for the lack of association.
Another widely examined modifier of disease progression includes 4 nonsynonymous SNPs in LTBP4—rs2302729 (V194I), rs1131620 (T787A), rs1051303 (T820A), and rs10880 (T1140M).13 LTBP4 encodes latent TGFβ binding protein 4, and polymorphisms within the gene were found to be modifiers of disease severity in γ-sarcoglycan-null mice on different genetic backgrounds.34 In DMD, the homozygous IAAM haplotype modified age at LOA (milder phenotype) compared with VTTT/VTTT or other haplotypes,13 but again, these findings have not been consistently replicated.14-16 LTBP4 with the IAAM haplotype binds TGFβ more stably, reducing bioavailability of TGFβ for fibrotic pathway signaling.13,35 For the 4 SNPs in LTBP4, we were unable to detect alterations in VL or SOL muscle FF trajectories in the IAAM/IAAM haplotype group compared with other haplotypes; however, the power of this analysis was limited by the small IAAM/IAAM sample size.
More recently, a United Dystrophinopathy Project cohort genome wide association study was performed to determine whether additional SNPs were associated with age at LOA.20 Rs710160 was identified as an upstream regulator of LTBP4 and found to be associated with LTBP4 transcript levels, giving it biological significance.20 The homozygous C allele was associated with older age at LOA. Using a recessive model, we observed a nonsignificant increase in mu values and sigma values from trajectory modeling, indicative of slower disease progression in the CC group. We were likely underpowered with only 9 individuals having the CC genotype and feel these interesting findings warrant further follow-up in larger, independent validation cohorts.
A second SNP associated with older age at LOA, rs2725797, was also identified in the genome wide association study.20 This SNP is a functional enhancer of THBS1, a gene that encodes thrombospondin 1, which is an activator of TGFβ signaling.20 In the prior study, the T allele was associated with older age at LOA using a recessive model; however, in our cohort, only 3 individuals were homozygous for the T allele, making evaluation of this modifier sample size-limited. Of note, the minor allele frequency is reported to be much higher in African/African American individuals, and 2 of the 3 participants with the TT genotype in our study were African or African American, of a total of only 3 African/African American identifying individuals in our cohort. Therefore, the homozygous T allele was perhaps more associated with racial identity than anything else in our limited sample. However, we did assess the THBS1 polymorphism using a dominant model (TC and TT genotypes considered “protective”) because the original study found an association with a dominant model.20 Surprisingly, we noted a nonsignificant protective effect of the CC genotype when assessing SOL and VL FF modeled trajectories. In particular, the SOL mu parameter was significantly higher in the CC genotype group before correcting for multiple comparisons (uncorrected p = 0.0184). Although not examined in this study, polymorphisms in ACTN3, CD40, and TCTEX1D1 genes have also been shown to have modifying effects on disease progression.36-38
Study limitations include small samples sizes, possible inclusion bias, variable follow-up periods, and differing participant clinical care or socioeconomic statuses. First, for genetic association studies, large sample sizes are required to detect small disease-modifying effects; however, obtaining large samples in rare diseases is challenging, and this hurdle has limited the discovery genetic modifiers. We were unable to adequately assess the THBS1-associated polymorphism secondary to a limited sample having homozygosity for the minor T allele. Second, within the cohort, there was variable follow-up. For individuals who withdrew from the study while highly functional with minimal disease progression, muscle FF modeling is less reliable. Third, other factors may contribute to the rate of disease progression, such as activity levels, clinical trial participation, and quality of clinical care, which were not controlled in this natural history study and could add bias to the results. Clinical trial participation has increased substantially since the initiation of this study; however, this study was not designed to evaluate drug effects.
Overall, this novel study used MR biomarkers of muscle health to examine alterations in disease course by dystrophin variations or genetic modifiers. Specifically, we used modeling of lower extremity muscle fatty infiltration, quantified by MRS, to compare disease trajectories between different dystrophin variation or modifier allele groups. This approach provided an age-independent index of disease progression that can be assessed in ambulatory and nonambulatory individuals. It has been shown that there is a relationship between age at LOA and modeled FF results, which gives clinical relevance to the modeling approach.24,39 Future studies may consider using both modeling and clinical data such as age at LOA to evaluate disease heterogeneity because the 2 approaches may provide complementary information and be most useful when examined in tandem. For example, MR modeling may be more informative when participants have disease progression but have not lost the ability to ambulate. Conversely, LOA analysis may be more informative for individuals with limited MR data, when modeling is less precise, or individuals who have already reached very high FFs. Finally, although muscle FF modeling is a powerful tool, its use is still novel. A threshold level of data for individuals is required for accurate modeling fit for those individuals; individuals with limited MR data tend to have disease trajectories strongly related to the fit of the overall cohort. A similar limitation exists for individuals who only have MR data at very low or high FFs.
In conclusion, we demonstrated alterations in disease progression and muscle fatty infiltration trajectories for individuals amenable to exon 8 skipping and with nonsense variations in exons previously shown to produce both DMD and BMD phenotypes. In addition, we detected disease modifying trends consistent with prior studies of rs710160, associated with regulation of LTBP4, suggesting this is a candidate modifier that deserves additional investigation. The magnitude of changes in FF trajectories were greatest for exon 8 skippable participants (likely because of dystrophin production), followed by steroid effects and smallest in cases of genetic polymorphisms. These findings carry implications for clinical trial design and interpretation because disproportionate enrollment of individuals with disease modifiers may affect trial outcomes. The results of this study underscore the use of muscle MR biomarkers and disease trajectory modeling as important tools allowing for objective evaluation of disease modifiers, linking changes in muscle pathology to changes in clinical disease course and sentinel events such as LOA.
Acknowledgment
We thank the following individuals: Eric Baetscher (OHSU), Judith Steadman (UF), Christi Swiers (UF), Tammy Nicholson (UF), and Dah-Jyuu Wang (CHOP) for assistance with MR data acquisition; Hyunjun Park (UF), Hansol Kang (UF), and Naphlim Olwe (UF) for DNA collection and processing; Dr. Erika Finanger (OHSU) and Dr. John Brandsema (CHOP) for interpretation of participant-provided genetic reports; and Vicki Bordeaux (UF) and Caroline Butler (OHSU) for assisting with obtaining age at loss of ambulation data. We appreciate the enthusiastic dedication of the study participants and their families to research.
Glossary
- AIC
Akaike information criterion
- BMD
Becker muscular dystrophy
- DMD
Duchenne muscular dystrophy
- FF
fat fraction
- LOA
loss of ambulation
- MRS
magnetic resonance spectroscopy
- NLME
nonlinear mixed effect
- SOL
soleus
- SNP
single-nucleotide polymorphism
- TGFβ
transforming growth factor beta
- THBS1
thrombospondin-1
- VL
vastus lateralis
Appendix. Authors

Study Funding
This study was funded by grants from the National Institutes of Health including “Magnetic Resonance Imaging and Biomarkers for Muscular Dystrophy” (R01-AR056973) and “The Relationship between Genomic Variants and MRI/MRS Markers in DMD” (R01-AR065943). A portion of this work was conducted at Oregon Health & Science University's Advanced Imaging Research Center, which has been supported by NIH S10-OD018224 and S10-OD021701. Dr. Barnard was supported in part by T32-HD043730 and K12-HD055929 during the conduct of this work.
Disclosure
The authors report no relevant disclosures. Go to Neurology.org/N for full disclosures.
References
- 1.Birnkrant DJ, Bushby K, Bann CM, et al. Diagnosis and management of Duchenne muscular dystrophy, part 1: diagnosis, and neuromuscular, rehabilitation, endocrine, and gastrointestinal and nutritional management. Lancet Neurol. 2018,17(3):251-267. [DOI] [PMC free article] [PubMed] [Google Scholar]
- 2.Bello L, Pegoraro E. The “usual suspects”: genes for inflammation, fibrosis, regeneration, and muscle strength modify Duchenne muscular dystrophy. J Clin Med. 2019,8(5):649. [DOI] [PMC free article] [PubMed] [Google Scholar]
- 3.Mendell JR, Moxley RT, Griggs RC, et al. Randomized, double-blind six-month trial of prednisone in Duchenne's muscular dystrophy. N Engl J Med. 1989,320(24):1592-1597. [DOI] [PubMed] [Google Scholar]
- 4.McDonald CM, Henricson EK, Abresch RT, et al. Long-term effects of glucocorticoids on function, quality of life, and survival in patients with Duchenne muscular dystrophy: a prospective cohort study. The Lancet 2017,391(11019):451-461. [DOI] [PubMed] [Google Scholar]
- 5.King WM, Ruttencutter R, Nagaraja HN, et al. Orthopedic outcomes of long-term daily corticosteroid treatment in Duchenne muscular dystrophy. Neurology 2007,68(19):1607-1613. [DOI] [PubMed] [Google Scholar]
- 6.Bello L, Morgenroth LP, Gordish-Dressman H, et al. DMD genotypes and loss of ambulation in the CINRG Duchenne natural history study. Neurology 2016,87(4):401-409. [DOI] [PMC free article] [PubMed] [Google Scholar]
- 7.Wang RT, Barthelemy F, Martin AS, et al. DMD genotype correlations from the Duchenne Registry: endogenous exon skipping is a factor in prolonged ambulation for individuals with a defined mutation subtype. Hum Mutat. 2018,39(9):1193-1202. [DOI] [PMC free article] [PubMed] [Google Scholar]
- 8.Hightower RM, Alexander MS. Genetic modifiers of Duchenne and facioscapulohumeral muscular dystrophies. Muscle Nerve 2018,57(1):6-15. [DOI] [PMC free article] [PubMed] [Google Scholar]
- 9.Flanigan KM, Dunn DM, Niederhausern Avon, et al. Nonsense mutation-associated Becker muscular dystrophy: interplay between exon definition and splicing regulatory elements within the DMD gene. Hum Mutat. 2011,32(3):299-308. [DOI] [PMC free article] [PubMed] [Google Scholar]
- 10.Torella A, Zanobio M, Zeuli R, et al. The position of nonsense mutations can predict the phenotype severity: a survey on the DMD gene. PLoS One 2020,15(8):e0237803. [DOI] [PMC free article] [PubMed] [Google Scholar]
- 11.Pegoraro E, Hoffman EP, Piva L, et al. SPP1 genotype is a determinant of disease severity in Duchenne muscular dystrophy. Neurology 2011,76(3):219-226. [DOI] [PMC free article] [PubMed] [Google Scholar]
- 12.Bello L, Piva L, Barp A, et al. Importance of SPP1 genotype as a covariate in clinical trials in Duchenne muscular dystrophy. Neurology 2012,79(2):159-162. [DOI] [PMC free article] [PubMed] [Google Scholar]
- 13.Flanigan KM, Ceco E, Lamar K-M, et al. LTBP4 genotype predicts age of ambulatory loss in Duchenne muscular dystrophy. Ann Neurol. 2013,73(4):481-488. [DOI] [PMC free article] [PubMed] [Google Scholar]
- 14.van den Bergen JC, Hiller M, Bohringer S, et al. Validation of genetic modifiers for Duchenne muscular dystrophy: a multicentre study assessing SPP1 and LTBP4 variants. J Neurol Neurosurg Psychiatry 2014,86(10):1060-1065. [DOI] [PMC free article] [PubMed] [Google Scholar]
- 15.Bello L, Kesari A, Gordish-Dressman H, et al. Genetic modifiers of ambulation in the CINRG Duchenne natural history study. Ann Neurol. 2015,77(4):684-696. [DOI] [PMC free article] [PubMed] [Google Scholar]
- 16.Barp A, Bello L, Politano L, et al. Genetic modifiers of Duchenne muscular dystrophy and dilated cardiomyopathy. PLoS One 2015,10(10):e0141240. [DOI] [PMC free article] [PubMed] [Google Scholar]
- 17.Van Dorn CS, Puchalski MD, Weng H-Y, et al. DMD mutation and LTBP4 haplotype do not predict onset of left ventricular dysfunction in Duchenne muscular dystrophy. Cardiol Young 2018,28(07):910-915. [DOI] [PMC free article] [PubMed] [Google Scholar]
- 18.Chen M, Wang L, Li Y, et al. Genetic modifiers of Duchenne muscular dystrophy in Chinese patients. Front Neurol. 2020,11:721. [DOI] [PMC free article] [PubMed] [Google Scholar]
- 19.Bello L, D'Angelo G, Villa M, et al. Genetic modifiers of respiratory function in Duchenne muscular dystrophy. Ann Clin Transl Neurol. 2020,7(5):786-798. [DOI] [PMC free article] [PubMed] [Google Scholar]
- 20.Weiss RB, Vieland VJ, Dunn DM, et al. Long-range genomic regulators of THBS1 and LTBP4 modify disease severity in Duchenne muscular dystrophy. Ann Neurol. 2018,84(2):234-245. [DOI] [PMC free article] [PubMed] [Google Scholar]
- 21.Forbes SC, Willcocks RJ, Triplett WT, et al. Magnetic resonance imaging and spectroscopy assessment of lower extremity skeletal muscles in boys with Duchenne muscular dystrophy: a multicenter cross sectional study. PLoS One 2014,9(9):e106435. [DOI] [PMC free article] [PubMed] [Google Scholar]
- 22.Lott DJ, Forbes SC, Mathur S, et al. Assessment of intramuscular lipid and metabolites of the lower leg using magnetic resonance spectroscopy in boys with Duchenne muscular dystrophy. Neuromuscul Disord. 2014,24(7):574-582. [DOI] [PMC free article] [PubMed] [Google Scholar]
- 23.Barnard AM, Willcocks RJ, Finanger EL, et al. Skeletal muscle magnetic resonance biomarkers correlate with function and sentinel events in Duchenne muscular dystrophy. PLoS One 2018,13(3):e0194283. [DOI] [PMC free article] [PubMed] [Google Scholar]
- 24.Rooney WD, Berlow YA, Triplett WT, et al. Modeling disease trajectory in Duchenne muscular dystrophy. Neurology 2020,94(15):e1622–e1633. [DOI] [PMC free article] [PubMed] [Google Scholar]
- 25.Van der Auwera GA, Carneiro MO, Hartl C, et al. From FastQ data to high confidence variant calls: the Genome Analysis Toolkit best practices pipeline. Curr Protoc Bioinforma. 2013,43:11.10.1-11.10.33. [DOI] [PMC free article] [PubMed] [Google Scholar]
- 26.Triplett WT, Baligand C, Forbes SC, et al. Chemical shift-based MRI to measure fat fractions in dystrophic skeletal muscle: MR measurements of fat fraction in dystrophic muscles. Magn Reson Med. 2014,72(1):8-19. [DOI] [PMC free article] [PubMed] [Google Scholar]
- 27.Willcocks RJ, Rooney WD, Triplett WT, et al. Multicenter prospective longitudinal study of magnetic resonance biomarkers in a large Duchenne muscular dystrophy cohort. Ann Neurol. 2016,79(4):535-547. [DOI] [PMC free article] [PubMed] [Google Scholar]
- 28.Muntoni F, Gobbi P, Sewry C, et al. Deletions in the 5’ region of dystrophin and resulting phenotypes. J Med Genet. 1994,31(11):843-847. [DOI] [PMC free article] [PubMed] [Google Scholar]
- 29.Muntoni F, Torelli S, Ferlini A. Dystrophin and mutations: one gene, several proteins, multiple phenotypes. Lancet Neurol. 2003,2(12):731-740. [DOI] [PubMed] [Google Scholar]
- 30.Okubo M, Noguchi S, Hayashi S, et al. Exon skipping induced by nonsense/frameshift mutations in DMD gene results in Becker muscular dystrophy. Hum Genet. 2020,139(2):247-255. [DOI] [PMC free article] [PubMed] [Google Scholar]
- 31.van den Bergen JC, Ginjaar HB, Niks EH, et al. Prolonged ambulation in Duchenne patients with a mutation amenable to exon 44 skipping. J Neuromuscul Dis. 2014,1(1):91-94. [PubMed] [Google Scholar]
- 32.Dwianingsih EK, Malueka RG, Nishida A, et al. A novel splicing silencer generated by DMD exon 45 deletion junction could explain upstream exon 44 skipping that modifies dystrophinopathy. J Hum Genet. 2014,59(8):423-429. [DOI] [PubMed] [Google Scholar]
- 33.Vetrone SA, Montecino-Rodriguez E, Kudryashova E, et al. Osteopontin promotes fibrosis in dystrophic mouse muscle by modulating immune cell subsets and intramuscular TGF-beta. J Clin Invest. 2009,119(6):1583-1594. [DOI] [PMC free article] [PubMed] [Google Scholar]
- 34.Heydemann A, Ceco E, Lim JE, et al. Latent TGF-β–binding protein 4 modifies muscular dystrophy in mice. J Clin Invest. 2009,119(12):3703-3712. [DOI] [PMC free article] [PubMed] [Google Scholar]
- 35.Lamar K-M, Miller T, Dellefave-Castillo L, McNally EM. Genotype-specific interaction of latent TGFβ binding protein 4 with TGFβ. PLoS One 2016,11(2):e0150358. [DOI] [PMC free article] [PubMed] [Google Scholar]
- 36.Bello L, Flanigan KM, Weiss RB, et al. Association study of exon variants in the NF-κB and TGFβ pathways identifies CD40 as a modifier of Duchenne muscular dystrophy. Am J Hum Genet. 2016,99(5):1163-1171. [DOI] [PMC free article] [PubMed] [Google Scholar]
- 37.Hogarth MW, Houweling PJ, Thomas KC, et al. Evidence for ACTN3 as a genetic modifier of Duchenne muscular dystrophy. Nat Commun. 2017,8:14143. [DOI] [PMC free article] [PubMed] [Google Scholar]
- 38.Spitali P, Zaharieva I, Bohringer S, et al. TCTEX1D1 is a genetic modifier of disease progression in Duchenne muscular dystrophy. Eur J Hum Genet. 2020,28(6):815-825. [DOI] [PMC free article] [PubMed] [Google Scholar]
- 39.Naarding KJ, Reyngoudt H, van Zwet EW, et al. MRI vastus lateralis fat fraction predicts loss of ambulation in Duchenne muscular dystrophy. Neurology 2020,94(13):e1386-e1394. [DOI] [PMC free article] [PubMed] [Google Scholar]
Associated Data
This section collects any data citations, data availability statements, or supplementary materials included in this article.
Data Availability Statement
Anonymized data published within this manuscript can be requested by submitting a formal application to Dr. Krista Vandenborne, and instructions for requests have been detailed on the website imagingdmd.org. All data requests will be reviewed by the study executive committee, which comprises the study principal investigators and key study personnel.