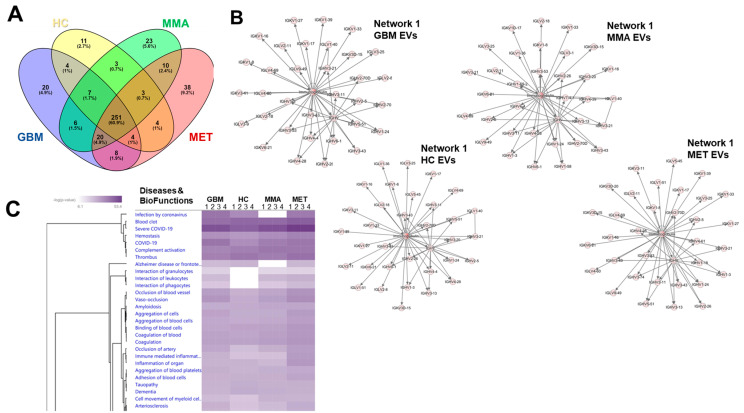
Figure 6.
Venn diagram Ingenuity Pathway Analysis (IPA) readouts of plasma EV proteomes. (A). Venn diagram showing overlapping and unique protein numbers from each plasma EV category. (B). Top networks derived from IPA Core Analysis for each plasma EV proteome showing the predominance of immunoglobulin networks (Networks were all entitled “Cancer, Infectious Disease, Organismal Injury and Abnormalities”; scores = 65–67; 33 focus molecules). (C). Comparison Analysis conducted on all four plasma EV datasets from four different patients or controls showing hierarchical clustering of the top 30 Disease and BioFunction significant categories. This is a partial representation; the full table of all 636 categories is found in Table S5.

