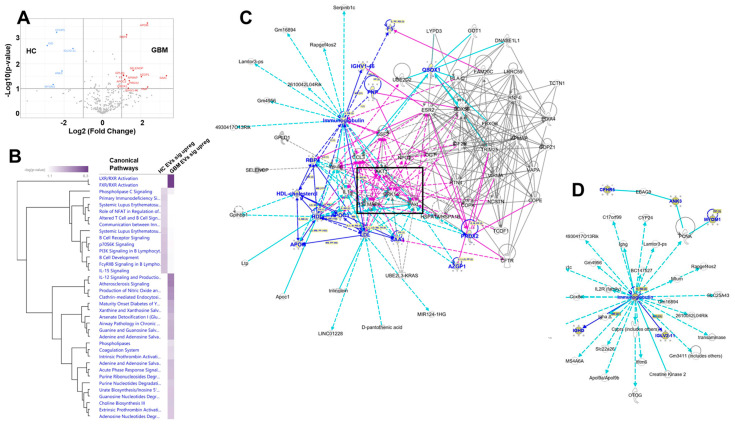
Figure 7.
Differential protein content between HC and GBM plasma EV proteomes, and IPA readouts using only those proteins. (A). Volcano graph showing significantly different protein content comparing HC plasma EVs (left side, blue designations) and GBM plasma EVs (right side, red designations. (B). Comparison analysis of the significantly different proteins (HC plasma EV proteins left column; GBM plasma EV proteins right column). Shown are all the significant canonical pathways rendered in hierarchical clustering. (C). Merge of the two interactomes from network analysis of significantly expressed GBM plasma EV proteins; black box surrounds signaling nodes of AKT, ERK1/2, and p38MAPK. Network names: (1) “Lipid Metabolism, Molecular Transport, Small Molecule Biochemistry”; score = 33; 11 focus molecules; (2) “Infectious Diseases, Organismal Injury and Abnormalities, Protein Synthesis”; score = 4; 2 focus molecules. (D). Sole network from significantly expressed HC plasma EV proteins. Network name: “Auditory Disease, Hereditary Disorder, Neurologic Disease”; score = 15; 5 focus molecules. For (C,D), proteins identified in the datasets are listed in blue color.

