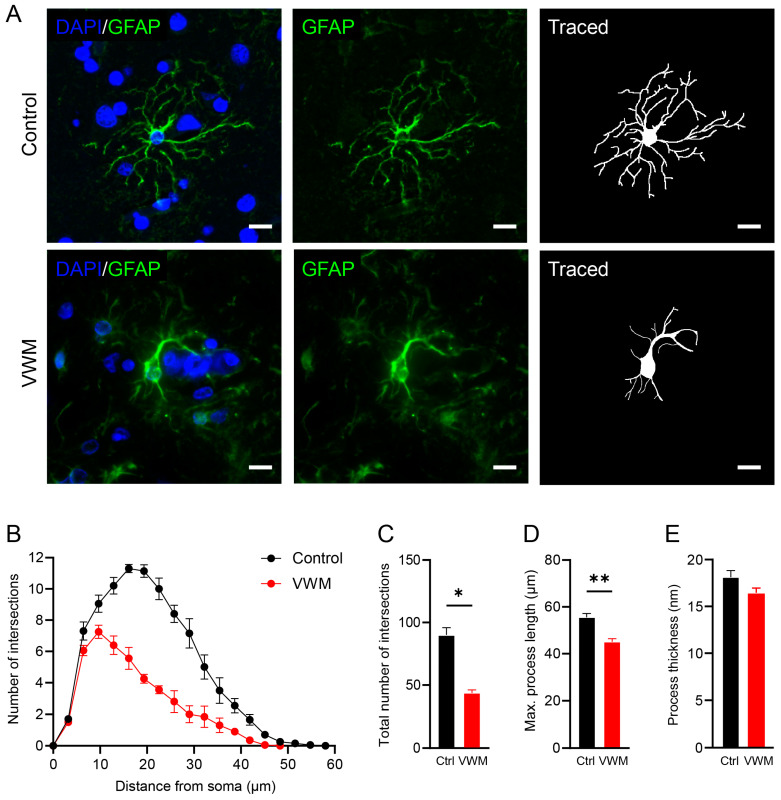
Figure 7.
Astrocytes in the VWM cortex show reduced morphological complexity. (A) Immunostaining of control and VWM cortices showing GFAP-positive astrocytes (green) and their respective tracings. Blue stain indicates nuclei. Scale bars: 10 µm. Depicted images are stains of cortical tissue of control 1 and VWM 1. (B) Sholl diagram of astrocytes in the cortex of control and VWM brains. Diagram shows number of processes intersecting with concentric rings per 3 µm, starting from the cell body. (C) Total number of intersections. (D) Maximum process length. (E) Process thickness. * p-value < 0.05, ** p-value < 0.01.

