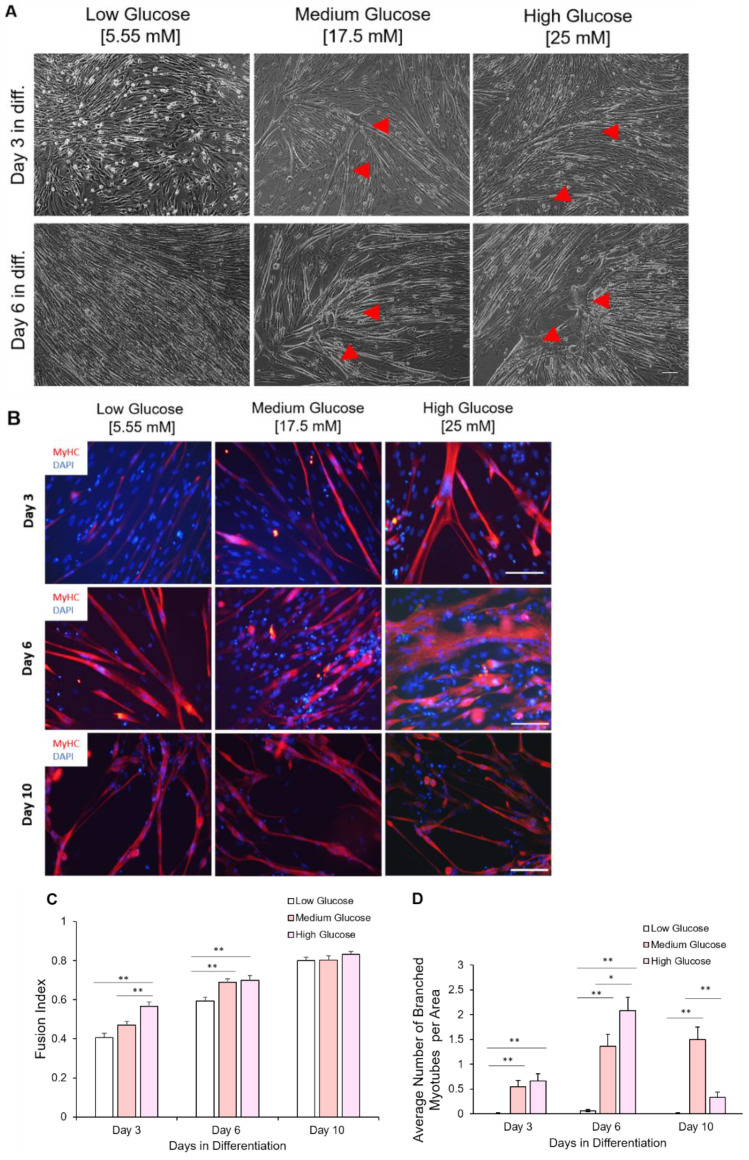
Figure 7.
Chronological morphological and fusion index analysis of myotubes differentiated from iPSC-myoblasts expanded in the three D-glucose conditions. (A) Phase contrast imaging of myotubes at days 3 and 6 of differentiation. Myoblasts expanded under high glucose conditions tended to hyper-fuse and form branched myotubes (indicated by red arrows) after differentiation initiation. Scale bar = 100 µm. Red arrows pointing to branched hypertrophic myotubes. (B) ICC images of myotubes differentiated from iPSC-derived myoblasts previously cultured in the three D-glucose concentrations at days 3, 6 and 10 of differentiation. Myoblasts expanded under high glucose conditions tended to hyper-fuse and form branched myotubes after differentiation initiation. Those branched myotubes tended to detach sooner and few were left at day 10. Scale bar = 100 µm. (C) Quantification of Fusion Index of myotubes differentiated from iPSC-derived myoblasts previously proliferated in 5.55, 17.5 and 25 mM D-glucose at 3, 6 and 10 days of differentiation. (D) Quantification of branched myotubes per image area. Error bars = SEM. P ≤ 0.1, *; P ≤ 0.05, **; P ≤ 0.01, ***. n = 6. Statistics was performed utilizing One-way ANOVA with post-hoc Tukey HSD Test.

