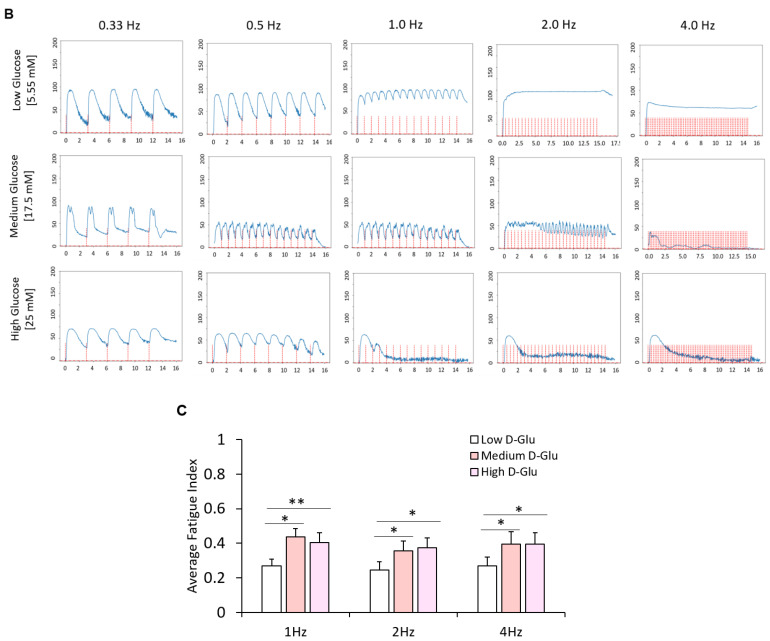
Figure 8.
Functional characterization of myotubes differentiated from iPSC-derived myoblasts previously cultured in the three D-glucose concentrations. (A) Phase images of iPSC-derived myotubes at day 7 of differentiation. (B) Contraction traces of iPSC-derived myotubes derived from 5.55, 17.5 and 25 mM D-glucose myoblast cultures at day 7 of differentiation. (C) Quantification of fatigue indices of myotubes at day 7 of differentiation. Error bars = SEM. P ≤ 0.1, *; P ≤ 0.05, **; P ≤ 0.01, ***. n = 5 for low glucose and 3 for medium and high glucose. Statistics were performed utilizing One-way ANOVA with post-hoc Tukey HSD Test.


