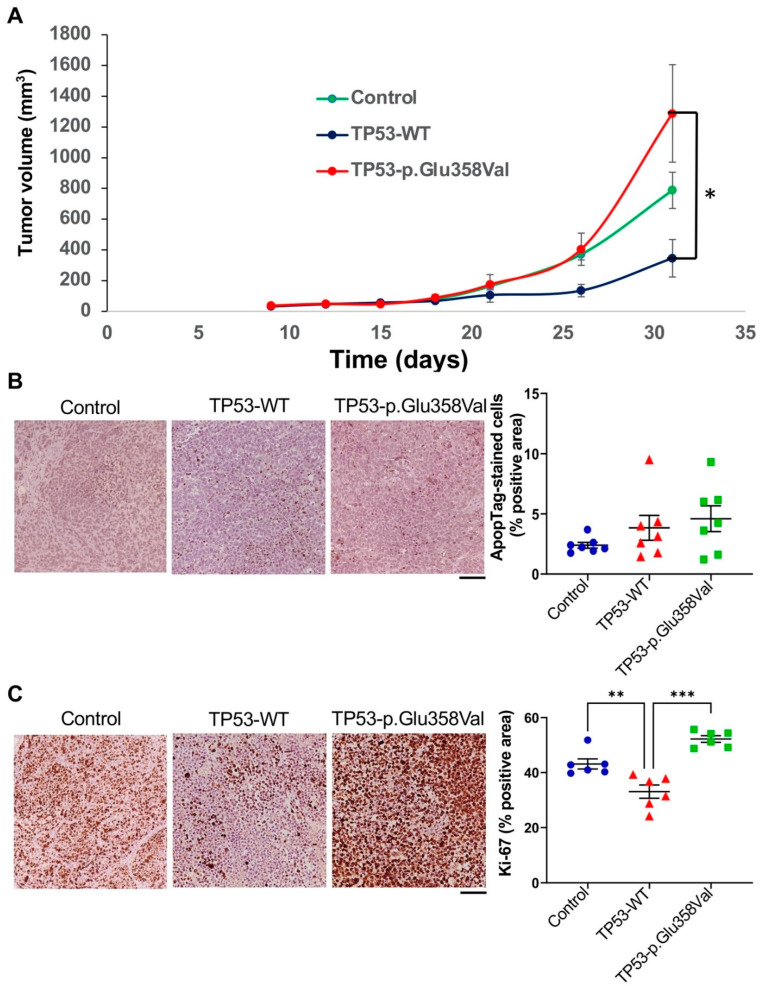
Figure 4.
Tumor grafts in mouse model. (A) The tumor volume was measured for four weeks. The diagram shows the tumor growth curve of the mouse at the indicated days after subcutaneous implant of the tumor cells (n = 5 per group). (B) H2172 tumors were sectioned and stained by ApopTag. (C) Ki-67 staining of H2172 tumor sections. Scale bar = 200 µm. * p < 0.05, ** p < 0.01, *** p < 0.001.

