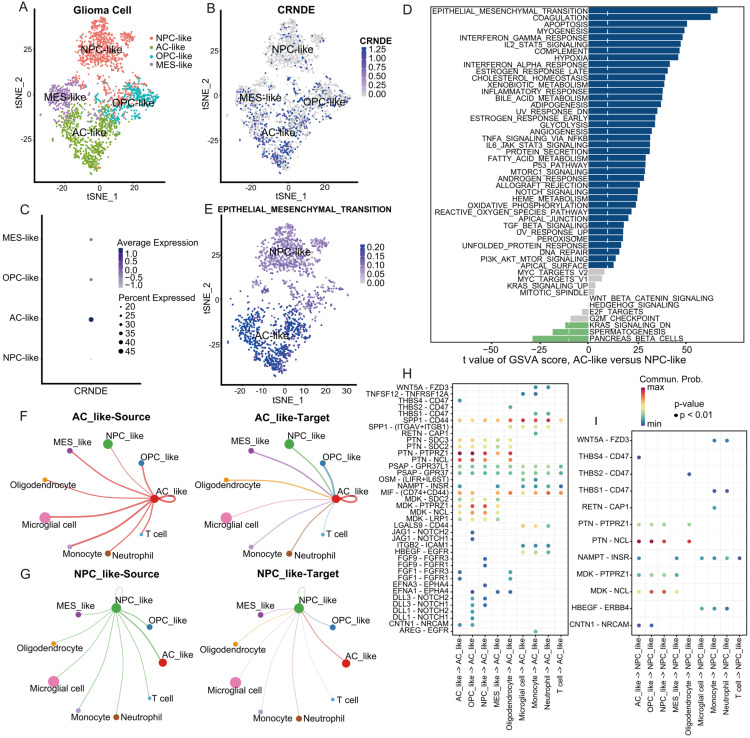
Figure 8.
Biological processes and cell–cell communications associated with the expression of CRNDE at the single-cell level. (A,B) tSNE plot of the glioma cells with each cell color-coded by (A) minor subtype and (B) the expression level of CRNDE. (C) CRNDE expression in four minor subtypes of glioma cells quantified by bubble plot. (D) Differences in pathway activities scored per cell by GSVA between AC-like and NPC-like glioma cells. (E) tSNE plot of AC-like and NPC-like glioma cells with each cell color-coded by GSVA score of the EMT process. (F,G) The number of ligand–receptor interactions associated with (F) AC-like glioma cells and (G) NPC-like glioma cells. (H,I) EMT-related ligand–receptor interactions associated with (H) AC-like glioma cells and (I) NPC-like glioma cells.

