Figure 2.
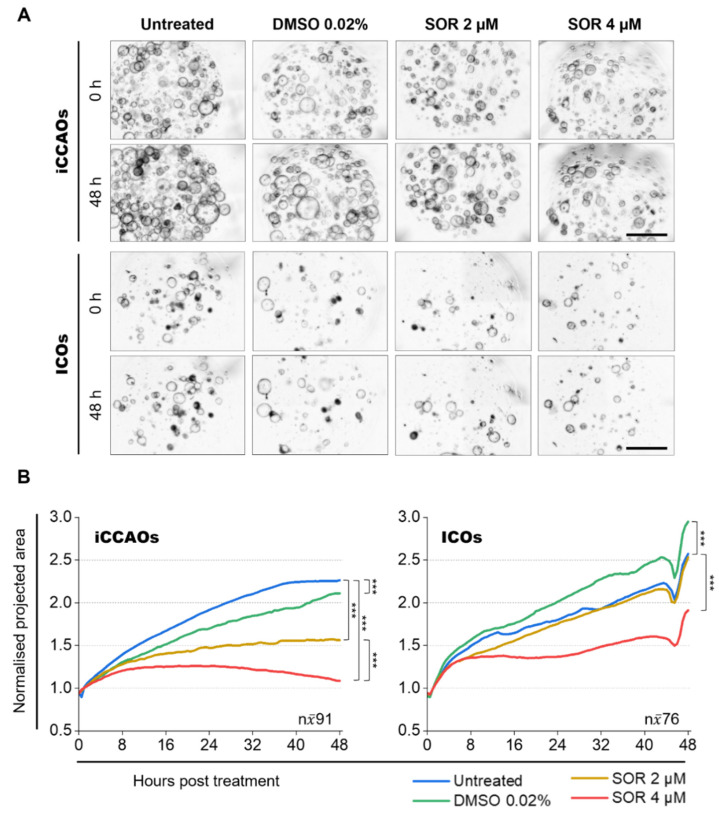
Sorafenib treatment limits iCCAO growth more extensively than ICO growth. (A) Overview of pre-processed (z-projected, stitched) brightfield images for subsequent segmentation and post-processing in the organoid growth analysis pipeline. Organoids were grown for 72 h prior to treatment. Post-treatment, organoid growth was monitored over 48 h with a recording interval of 0.5 h (≙ 97 time points, counting 0 h as time point 1). To capture the vast majority of organoids within one well (one Matrigel™ droplet), 2 × 2 tiles and 10 z-planes (z-spacing: 65 µm) were recorded with a magnification of 5×. Figure 2 shows representative stitched average intensity z-projections of n = 4 recordings for each organoid line and each condition. Microscope: AxioObserver.Z1; objective lens: Plan-Apochromat 5×/0.16; camera: AxioCam MR R3; pixel size: 1.29 × 1.29 μm2; scale bars: 1000 µm. (B) Quantification of organoid growth under sorafenib treatment. Data were generated with the organoid growth analysis pipeline. Graphs show median lines of normalized projected area (NPA) values for 97 consecutively measured time points (equivalent to recorded/analyzed time points: 48 h, 0.5 h recording interval ≙ 97 time points, counting 0 h as time point 1). Projected areas (PAs) for each organoid were normalized to their individual mean PA value over the first five time points. An overview and a comparison of relative final organoid size in NPA and percentage values are given in Table 1. For details on data distribution refer to Figures S1 and S2. Statistics were performed on median NPA values [n = 97, skewed distribution, Mann–Whitney test, *** p < 0.001].

